Journal of Chemical and Pharmaceutical Research
__________________________________________________
ISSN No: 0975-7384 CODEN(USA): JCPRC5
J. Chem. Pharm. Res., 2011, 3(6):243-258
Development and Validation of RP-HPLC Stability-Indicating Methods for
the Determination of Butamirate Citrate and Sodium Cromoglycate
Sonia T.Hassiba, Asmaa A. El
-
Zaherb, Marwa A. Fouad*cDepartment of Pharmaceutical Chemistry, Faculty of Pharmacy, Cairo University, Kasr El- Aini, Cairo, Egypt
_____________________________________________________________________________
ABSTRACT
Two novel high performance liquid chromatographic (HPLC) methods are presented for the determination of butamirate citrate (BC) and sodium cromoglycate (NaCr) in the presence of or with their degradation products. The first method was based on RP-HPLC separation of BC from its degradation product using an Agilent Zorbax ODS (C18) column with a mobile phase consisting of methanol: acetonitrile: water (100: 75: 25, v/v/v) adjusted with triethylamine to pH 9.8±0.1 with UV detection at 225 nm and using clobutinol hydrochloride (CH) as internal standard. The second method was based on HPLC separation of NaCr from its degradation product using an Agilent Zorbax ODS (C18) column with a mobile phase consisting of methanol: water (75: 25, v/v) using metronidazole (MT) as internal standard. Quantification was achieved with UV detection at 254 nm. The developed methods were applied for the determination of BC or NaCr in their pharmaceutical formulations. Both methods proved stability indicating power but in the second one, the degradation product could be evaluated along with the intact NaCr. The developed methods were validated as per ICH guidelines and were also; suitable for assay determination of the cited drugs in pharmaceutical dosage forms.
Keywords: butamirate citrate, sodium cromoglycate, HPLC, degradation product.
_____________________________________________________________________________
INTRODUCTION
Sodium cromoglycate, disodium 4,4’-dioxo-5,5’-(2-hydroxytrimethylenedioxy) di(4H-chromene-2-carboxylate), is believed to act primarily by preventing release of mediators of inflammation from sensitized mast cells through stabilization of mast cell membranes. It is used in the prophylaxis of many types of asthma [1, 2]. The official methods for the determination of
NaCr are non aqueous titration using standard perchloric acid as titrant [6] and
spectrophotometry in pure form and different pharmaceutical formulations using standard solutions [7] and A(1%, 1 cm) as the reference standard [8].
The drug has been also determined by spectrophotometric [9, 10], TLC-densitometric methods [11, 12] and also; electrochemical methods [13, 14]. Several HPLC methods were described for the determination of NaCr using UV detection [15-18], fluorescence detection [19] or tandem mass spectrometric detection [20-22]. Simultaneous determination of NaCr and salbutamol sulphate using HPLC was also adopted [23].
Literature survey revealed also published RP-HPLC assays for NaCr in presence of its related substances; one HPLC method was described for the analysis of NaCr in the presence of 3 related substances which are: 1-(2,6-dihydroxyphenyl)-ethanone (A), 1-{2-[3-(2-Acetyl-3-hydroxy-phenoxy)-2-hydroxy-propoxy]-6-hydroxy-phenyl}-ethanone (B), and diethyl cromolyn (C). Compounds were eluted on a C18 column using cetyl trimethylammonium bromide: acetonitrile: water (1g: 1l: 1l, w/v/v) as the mobile phase for drug assay, and (0.376 g: 920 ml: 1080 ml, w/v/v) as that for related compounds [24]. Another HPLC assay method was developed for the determination of NaCr in presence of 2 related substances: B and C. Using a Nova-Pak C8 column and a mobile phase of methanol: tetrabutyl ammonium dihydrogen phosphate buffer (45:55, v/v), NaCr and B eluted at 6.2 and 47.5 minutes, respectively, with an obvious large retention time difference between the drug and its impurities. Furthermore, the authors mentioned that on using the same mobile phase on C18 column, B and C did not elute from the column up to more than 90 minutes [25]. For this reason, the same authors tried to shorten the chromatographic run time by developing another method consisting of Zorbax C8 column and a mobile phase consisting of myristyl trimethylammonium bromide buffer pH 6.5: methanol (45:55, v/v). Using these conditions, NaCr and B eluted at 9.5 and 5 minutes, respectively [26]. The most common stationary phases used are octadecyldimethyl (C18 ) phases with silica as the solid support [27-30].Thus, it was deemed useful to develop a new HPLC method with a simpler mobile phase composition and reasonable retention times for the drug and its degradation product.
EXPERIMENTAL SECTION
2.1. Instrumentation
A chromatographic system consisting of Agilent 1100 series; interface was equipped with an Agilent isocratic pump G1310A, Agilent UV-visible detector G1314A, an Agilent manual injector G1328B equipped with (20 µl) injector loop, separation and quantitation were made on Agilent Zorbax ODS column (C18) 5µm, 4.6 x 250 mm. Agilent syringe, LC 100 µl (CA, U.S.A.).
Infrared spectra were recorded on Bruker FT-IR spectrophotometer Vector 22 (Billerica MA, USA) as potassium bromide discs.
Mass spectra were performed on Schimadzu GCMS-QP1000EX mass spectrophotometer (Kyoto, Japan).
2.2. Materials and reagents
BC was kindly donated by Novartis Pharma Company; Cairo, Egypt. Purity was 99.84±0.415 (n=6)according to the comparison method. NaCr was kindly donated by Amoun Pharmaceutical Company; Al-Obour City, Egypt. Purity was 99.79±0.722 (n=6) according to the comparison method.
2.3. Pharmaceutical preparations
Sinecod® syrup (batch no. Υ0012, containing 1.5 mg/ml of BC) of Novartis Pharma Company; Cairo, Egypt under license from Novartis Pharma AG., Basle, Switzerland was purchased from the market.
Nasotal® drops (batch number 2205, containing 2g NaCr per 100ml) of Amoun Pharmaceutical
Company; Al-Obour City, Egypt was purchased from the market.
2.4. Chromatographic conditions
The mobile phase (A) used in the assay of BC was prepared by mixing methanol: acetonitrile: water (100:75:25, v/v/v) adjusted with triethylamine to pH 9.8 ±0.1. Quantification was carried out with a flow rate 1 ml/min, at ambient temperature and UV detection at 225 nm.
The mobile phase (B) used in the assay of NaCr was prepared by mixing methanol: water (75:25, v/v). Quantification was carried out with a flow rate 1.2 ml/min, at ambient temperature and UV detection at 254 nm.
2.5. Preparation of 2-phenylbutyric acid (PBA)
BC (500 mg) was refluxed with 0.1M sodium hydroxide (50 ml) at 100oC for 10 hr. The reaction was followed till complete disappearance of BC with thin layer chromatography using chloroform: methanol (9:1, v/v) as the developing system. Subsequently, the solution was acidified using 1M hydrochloric acid and extracted with chloroform (4 x 10 ml). The aqueous layer was discarded. The combined chloroform extracts were dried over anhydrous sodium sulphate and evaporated to dryness to yield white precipitate of 2-phenylbutyric acid (PBA) (m.p.= 46 oC (reported 39-42 [31]). The stock solution of PBA was prepared by dissolving in the mobile phase (A) to prepare solution (1mg ml-1).
2.6. Preparation of 1-{2-[3-(2-Acetyl-3-hydroxy-phenoxy)-2-hydroxy propoxy]-6-hydroxy-phenyl}-ethanone (Deg1)(previously mentioned B)
NaCr (500 mg) was refluxed with 10% aqueous potassium hydroxide (10 ml) for 2 hr.
Subsequently, the solution was acidified with glacial acetic acid until complete precipitation of the degradation product (m.p. = 165oC (as reported [32]). The precipitate was filtered and dried under vacuum. The stock solution of Deg1 was prepared by dissolving in the mobile phase (B) to prepare solution (0.6mg ml-1).
2.7. Preparation of 4-(2-{3-[2-(3-Carboxy-3-oxo-propionyl)-3-hydroxy-phenoxy]-2-hydroxy-propoxy}-6-hydroxy-phenyl)-2,4-dioxo-butyric acid tetrasodium salt (Deg2)
chromatography using silica gel as the stationary phase and gradient elution of chloroform: methanol as the mobile phase.
2.8. Standard solutions and calibration graphs
Stock solutions of BC and CH were prepared by dissolving each compound in the mobile phase (A) to obtain concentrations of 2 mg ml-1 and 0.15 mg ml-1, respectively. Standard solutions of
BC were prepared by dilution of accurately measured aliquots of BC stock solution with the
mobile phase (A), after the addition of CH stock solution (1ml), to reach concentration range of 100-1200 µg ml-1.
Stock solutions of NaCr and MT were prepared by dissolving each compound in the mobile phase (B) to obtain concentrations of 2mg ml-1 and 0.8mg ml-1, respectively. Standard solutions of NaCr and Deg1 were prepared by dilution of accurately measured aliquots of NaCr and Deg1 stock solutions, respectively, with the mobile phase (A), after the addition of MT stock solution (1ml), to reach concentration range of 100-600 µg ml-1 for NaCr and 30-180 µg ml-1 for Deg1.
Triplicate 20 µl injections were made for each concentration and chromatographed under the specified conditions described previously. The ratios (R) of the recorded AUPs of each compound to that of the corresponding internal standard were plotted versus the corresponding concentrations.
2.9. Sample preparation 2.9.1. For Sinecod syrup
A volume of syrup equivalent to 30 mg BC was introduced into a 50 ml volumetric flask and diluted to volume with the mobile phase (A) to reach concentration of 0.6 mg ml-1. Aliquots equivalent to BC (1.44- 4.8 mg) were introduced into a series of 10 ml volumetric flasks. The general procedure for HPLC method of BC described under calibration was followed.
2.9.2. For Nasotal drops
A volume of nasal drops equivalent to 100 mg NaCr was introduced into a 50 ml volumetric flask and diluted to volume with the mobile phase (B) to obtain NaCr solution (2 mg ml-1). Aliquots equivalent to NaCr (1.2- 3.6 mg) were introduced into a series of 10 ml volumetric flasks. The general procedure for HPLC method of NaCr described under calibration was followed.
2.10. Validation of the methods
Methods validation was carried out in accordance to ICH guidelines [33].
2.10.1. Optimization of the chromatographic conditions
The system suitability tests were used to verify that the chromatographic systems used are adequate for the analysis. Tests include number of theoretical plates, resolution, relative retention and capacity factor; all were calculated for each chromatographic system.
2.10.2. Linearity and range
The methods were validated as described under standard solutions and calibration graphs. The calibration range was established within the protocol range necessary, according to each drug concentration present in the pharmaceutical product.
2.10.3. Specificity and accuracy
by analyzing BC in presence of PBA in laboratory prepared binary mixtures and also NaCr and
Deg1. Complete peak separation was achieved and laboratory prepared mixtures were used to
determine the cited drugs in presence of/and their degradation products. The concentrations of the samples used to determine the accuracy were 240-1200 µg ml-1 for BC in presence of 50-100
µg ml-1 for BPA where it was 360-600 µg ml-1 for NaCr and 48-138 µg ml-1 for Deg1. Moreover, the standard addition technique was applied to assess the methods accuracy.
2.10.4. Precision
The %RSD of assay of BC, NaCr and Deg1 were calculated using 6 injections. The intra-day and inter-day variability was determined by repeated injections of three different concentrations in triplicate for 3 days.
2.10.5. LOD and LOQ
LOD and LOQ were determined on the basis of standard deviation (σ) of the response and slope (S) of the calibration curve using 3.3 σ/S and 10 σ/S, respectively. (Values are the averages of 6 experiments).
2.10.6. Robustness
The robustness of the methods was checked by varying the pH of the mobile phase by ± 0.1% and its organic strength by ±0.2%.
RESULTS AND DISCUSSION
3.1. Identification of the degradation products 3.1.1. Identification of PBA
BC and oxeladin citrate (OC) are ester type drugs susceptible to hydrolysis. As reviewed in
literature, possible ester hydrolysis of OC was achieved by refluxing the drug in alkaline aqueous solution for 3 hr [34]. Following the same published procedure, BC was boiled with 0.1M sodium hydroxide Fig. (1). Reaction was followed using thin layer chromatography till complete disappearance of BC spot. Complete degradation reaction required reflux for 10 hr. The assignment of the degradation product as 2-phenylbutyric acid (PBA) was based on spectral analyses. The mass spectrum of PBA showed a peak at m/z 164 representing the molecular ion peak Fig. (2). The IR spectrum of PBA lacked the characteristic ester C=O stretching band of
BC at 1733.2 cm-1. The 1H-NMR spectrum of PBA was characterized by the presence of the aromatic protons at δ 7.31 ppm, protons of the ethyl chain at δ 0.93, 1.83 and 2.12 ppm, and benzylic proton at δ 3.48 ppm. Moreover, the spectrum lacked the characteristic signals of 2-(diethylamino) ethoxyethyl chain protons Fig. (3).
3.1.2. Identification of Deg1
CH3 OH O CH3
O O
O
N CH3
CH3
O
H O N CH3
CH3
+
BC
PBA
Figure (1): BC degradation scheme.
[image:6.595.215.399.67.358.2] [image:6.595.187.425.378.629.2]Figure (3): 1H-NMR spectrum of 2-phenylbutyric acid (PBA).
Figure (4): NaCr degradation scheme.
3.1.3. Identification of Deg2
A thorough look in literature revealed the presence of a general method for carrying out partial degradation of the chromone ring using alcoholic and not aqueous alkaline solution [38-40]. Based on this knowledge, this method was successfully applied to NaCr in order to prepare
Deg2 Fig. (4).Careful acidification of the solution has to be carried out as Deg2 is unstable in
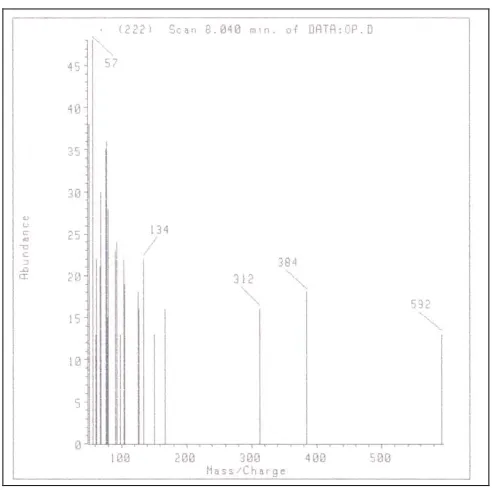
acidic medium leading to ring closure to NaCr again [9]. UV spectrum of Deg2 in alkaline pH shows hypsochromic shift to 310 nm (NaCr has an absorption maximum at 326 nm) with an increase in absorption intensity, while in neutral pH, the strong band at 310 nm disappears and is replaced by two weaker bands at 267 and 330 nm (as reported [9]) Fig. (6).IR spectra of NaCr and Deg2 were not able to differentiate between the two compounds because the OH stretching and CO stretching bands appear nearly at the same frequency (NaCr 3394, 1638 cm-1) (Deg2 3397, 1633 cm-1). Mass spectrum of Deg2 showed a peak at m/z 592 corresponding to molecular ion peak, Fig. (7).
Figure (6): UV absorption spectra of NaCr in 0.1M sodium hydroxide ______ , Deg2 in 0.1M sodium hydroxide --- and Deg2 in methanol …….. .
[image:8.595.208.405.250.439.2] [image:8.595.183.429.494.739.2]3.2. Method development and optimization 3.2.1. For BC and PBA
One method for the determination of BC by HPLC was described. A mobile phase, containing tetraethylammonium hydrogen sulfate, methanol and acetonitrile adjusted to pH 3.5, was used to separate BC (tR= 8.26 min) in cough preparation, ”Sinecod” syrup, using Lichrosorb RP-18
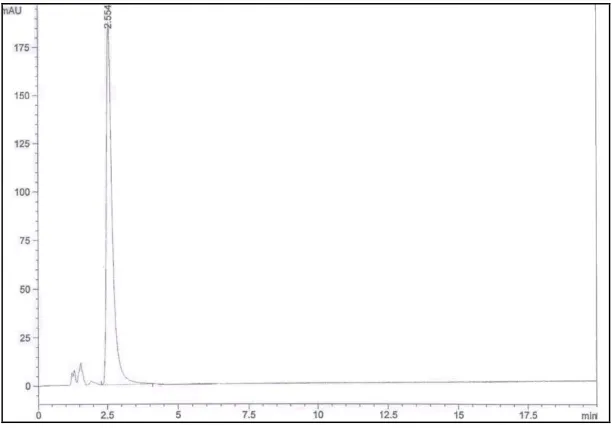
column and UV detection at 258 nm [4]. Another HPLC method was described in literature to separate oxeladin citrate; which possess high structure similarity with the drug under investigation, from its alkaline degradation product. This method simply uses a mobile phase consisting of acetonitrile: 0.1% phosphoric acid (60:40, v/v) and a Nucleosil C18 column at 220 nm UV detection [34]. This mobile phase was prepared, overall pH was measured and it was found to be 2.38. Thus, it was concluded from both methods that acidic pH was necessary for the drug elution from the RP-stationary phase and to separate it from its alkaline degradation product. Many trials have been performed with different solvents in various proportions at acidic pH-values to reach the optimum stationary/mobile phase matching. Acidity was adjusted using either phosphoric acid, glacial acetic acid or ammonium acetate/acetic acid buffer. The chosen mobile phase was water: methanol (25:75, v/v) adjusted to pH= 4.58 using phosphoric acid Fig. (8). Nevertheless, all these attempts failed to resolve BC from its syrup components, thus, it was decided to determine the drug in cough preparation using syrup extract, prepared by extracting the butamirate base from other excipients after alkalinisation of the syrup. Injecting this extract produced blank chromatogram from which we could conclude that the peak eluted by injecting BC was actually the peak of the drug counter ion, citric acid (CA). This finding was supported by injecting citric acid solution which eluted at the same retention time (tR= 2.554
min) Fig. (9).
Figure (8): Retention time of butamirate citrate (BC), 2-phenylbutyric acid (PBA) using water: methanol (25: 75, v/v) adjusted with phosphoric acid to pH 4.58 at a flow rate of 2 ml/min and UV detection at 225 nm.
[image:9.595.231.379.390.619.2]degradation product; which prevents its determination in the pharmaceutical formulation Fig. (11). Due to the low UV sensitivity of BC, a full study was performed to choose optimum wavelength of detection and flow rate based on capacity factor and peak area. This study revealed that the best capacity factor and peak area were obtained using UV detection at 225 nm and a flow rate of 1 ml/min (Table 1).
Figure (9): Retention time of citric acid using water: methanol (25:75, v/v) adjusted with phosphoric acid to pH 4.58 at a flow rate of 2 ml/min and UV detection at 225 nm.
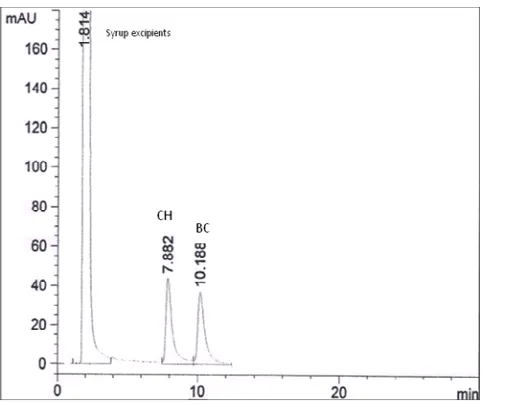
[image:10.595.153.459.151.365.2] [image:10.595.188.427.408.680.2]Figure (11): Retention time of syrup excipients, clobutinol hydrochloride (CH) and butamirate citrate (BC) using methanol: acetonitrile: water (100:75:25, v/v/v) adjusted with triethylamine to pH 9.8 ±0.1 at a flow
rate of 1 ml/min and UV detection at 225 nm.
Table(1): Effect of different wavelengths and flow rates on capacity factor and peak area ratio of BC and its internal standard(CH)
flow rate 0.8 ml/min 1 ml/min 1.6 ml/min
Drug BC CH BC CH BC CH
Retention time 13
min 9.9 min Peak Area Ratio 10 min 7.8 min Peak Area Ratio 6.3 min 4.9 min Peak Area Ratio
225 nm 5546 1675 3.311 4470 1323 3.379 2764 817 3.383
230 nm 3029 824 3.676 2326 629 3.698 1434 402 3.567
235 nm 1103 118 9.311 637 74 8.597
240 nm 494 18 27.319 300 12 24.544
a
ta, min 0.92 0.7 0.5
b
TR of PBA,
min 2.223 1.786 1.142
c
(K’) 1.416 1.551 1.284
aVoid time; bRetention time; cCapacity factor
3.2.2. For NaCr and Deg1
The developed HPLC has been applied for the determination of NaCr, Deg1 and Deg2. To optimize the HPLC assay parameters, the mobile phase composition was studied. Due to their difference in polarity, a satisfactory separation between NaCr and Deg1 was obtained with a mobile phase consisting of methanol: water (75:25, v/v) Fig. (12).
This mobile phase could not separate NaCr and Deg2 due to the great similarity in the structure and in the polarity of the two compounds. The partial overlap of the two eluents using same previously mentioned chromatographic conditions with 1 ml min-1 flow rate is shown in Fig. (13). Several attempts have been carried out to separate the peak of the open ring structure from that of NaCr, these trials include changes in methanol: water proportions, addition of acetonitrile to the mobile phase with different ratios, and finally increasing the basicity of the mobile phase by adding different amount of triethylamine. All these attempts did not achieve the required separation of the two peaks. Removal of methanol from the mobile phase causes retention of
Deg1 on the column up to more than 30 minutes. MT was chosen as internal standard as it eluted
[image:11.595.186.444.69.272.2] [image:11.595.58.557.360.492.2]showed complete separation between the drug, its degradation product, the internal standard and drops excipients (methylparaben sodium and propylparaben sodium) Fig. (14).
Figure (12): The chromatogram of NaCr, Deg1 and MT using methanol: water (75:25, v/v) at a flow rate 1.2 ml/min and UV detection at 254 nm.
Figure (13): Retention time of sodium cromoglycate (NaCr), its degradation product (Deg2) using methanol: water (75:25, v/v) at a flow rate 1 ml/min at ambient temperature and UV detection at 254 nm.
3.3. Validation of the method
3.3.1. Optimization of the chromatographic conditions
[image:12.595.196.418.113.344.2] [image:12.595.166.447.388.584.2]Figure (14): Retention time of sodium cromoglycate (NaCr), metronidazole (MT), methylparaben sodium (MPS) and propylparaben sodium (PPS) using methanol: water (75:25, v/v) at a flow rate 1.2 ml/min at
ambient temperature and UV detection at 254 nm.
Table(2): System suitability tests for the HPLC method proposed for the determination of BC and NaCr and their degradation products
Parameter PBA CH BC NaCr MT Deg 2
a
N 1840 1586 2441 1062 2442 1676
bR 14.910 2.850 4.843 9.705
c
α 6.442 1.320 2.101 3.601
d
K’ 1.576 10.151 13.404 1.610 3.382 12.180 e
RSD,% --- --- 0.208 0.889 --- 1.182 a
Number of theoretical plates
b
Resolution
cRelative retention d
Capacity factor
eRelative standard deviation
3.3.2. Linearity and range
The linearity of the calibration curves and adherence of the system to Beer's law were verified by the high correlation coefficient. The analytical data for the calibration curves including the mean recovery, SD, confidence limits of slopes, slope and intercept standard deviations (Sb, Sa) and
standard errors of the estimations are summarized (Table 3).
3.3.3. Specificity and accuracy
The HPLC methods were found to be specific with complete separation of BC (tR 10.08±0.1
min.) and complete separation of NaCr (tR 1.305±0.1 min.) from its degradation products under
[image:13.595.186.481.63.351.2]3.3.4. Precision, LOD, LOQ
Results of %RSD and that of the intra and inter-day precision along with that of LOD and LOQ were satisfactory as presented in Table 3.
3.3.5. Statistical studies
Statistical comparison between the results of the proposed methods and those of the reference methods, obtained by using the student's t-test and F- ratio showed no significant differences. It can be concluded that the proposed analytical methods are sufficiently accurate and precise (Table 4).
Table(3): Results obtained by the HPLC methods for the determination of BC and NaCr and their degradation products
Parameter BC NaCr Deg 2
Retention time, min 10.083 1.35 6.61
Wavelength of detection, nm 225 254 254
Calibration range, µgmL-1 100-1200 100-600 30-180
Regression equation y= 0.0074 x +0.058 y= 0.0346 x+0.2611 y= 0.0225 x- 0.0573
Correlation coefficient (r) 0.9999 0.9997 0.9999
a
Sb 3.53 x10
-5
3.82 x10⁻⁴ 9.59x10⁻⁵
b
Sa 0.025 0.149 0.011
cLOD 15.608 6.359 3.665
d
LOQ 47.297 38.805 6.275
Confidence limit of the slope 0.0074±9.07x10⁻⁵ 0.0346±1.06x10⁻³ 0.0225±2.67x10⁻⁴
Confidence limit of the intercept 0.058±0.064 0.2611±0.414 -0.0573±0.030
Standard error of the estimation 0.035 0.16 0.012
Intra day
Mean of concentrations (µg/ml) n=3 201.239 598.613 1200.769 185.84 367.704 544.976 55.101 67.405 135.979 e
RSD,% 0.441 0.149 0.888 0.319 0.17 0.123 0.264 0.472 0.306
Inter day
Mean of concentrations (µg/ml) n=3 201.785 601.636 1200.777 186.172 364.161 537.125 54.94 66.837 133.247
RSD,% 0.345 0.068 0.087 0.249 0.05 0.251 0.747 0.654 0.223
Results
1) Drug in laboratory made mixture,% 100.07 ± 0.208 100.31 ± 0.892 99.77 ± 1.179 2) Drug in dosage form, %
3) Drug added,%
96.56 ± 0.705 99.52± 0.655
108.05 ± 0.746 100.63± 0.478 a
Standard deviation of the slope
b
Standard deviation of the intercept
c
Limit of detection
d
Limit of quantification
e
Relative standard deviation
Table(4): Results Of tests of significance for the HPLC methods for the determination of BC and NaCr and their degradation products
Statistical Term BC NaCr
Reference methodb HPLC method Reference methodc HPLC method
Mean 99.84 100.07 99.79 100.31
S.D.± 0.415 0.208 0.722 0.892
S.E.± 0.169 0.085 0.295 0.364
RSD, % 0.416 0.208 0.723 0.889
n 6 6 6 6
V 0.172 0.043 0.521 0.796
t (2.228)a 1.216 1.110
F (5.050)a 4.000 1.528
CONCLUSION
proposed method has the advantages of overcoming the high retention time previously reported for NaCr and its degradation product and using simpler and cheaper mobile phase composition than ion pairing which is still considered a complicated method. Moreover; the second proposed method is a stability indicating assay that can determine NaCr and Deg1 simultaneously. Satisfactory results were obtained from validation of the methods, thus both methods can be used for routine analysis and quality control of the cited drugs in small laboratories.
REFERENCES
[1] JL McGuire. Pharmaceuticals: Classes, Therapeutic Agents, Areas of Application, Respiratory Tract, Wiley-Vch, New York 2000; 2, 837-900.
[2] P Kathleen. Martindale: The Complete Drug Reference, 35th edition, The Pharmaceutical Press, London, 2007; 1400, 1019-1021.
[3] I Doi; C Altesor; M Knochen. Quim. Anal., 1996; 15(2), 148-153.
[4] ET Malliou; CG Antoniou; JE Koundourellis. Anal. Sci., 2003; 19(4), 563-568.
[5] B Koppenhoefer; A Jakob; XF Zhu; BC Lin. J High Resolut Chromatogr, 2000; 23(6), 413-429.
[6] The European Pharmacopeia (EuP), 5th edition, The council of Europe, 2004; Through The British Pharmacopoeia, The Stationary Office on Behalf of The Medicines and Healthcare Products Regulatory Agency, London, UK, 2007; 2912-2913.
[7] The United States Pharmacopoeia (USP 30), National Formulary (NF 25) Asian edition, The United States Pharmacopeal Convention. 2007; 1838-1840.
[8] The British Pharmacopoeia,The Stationary Office on Behalf of The Medicines and Healthcare Products Regulatory Agency, London, UK, 2007; 2803- 2804
[9] J Tillman; DW Whymark. Analyst, 1971; 96(1147), 689- 698
[10]YS Yang; YC Ren; S Zhou; J Xu. Yaowu Fenxi Zazhi. 1999; 19(2),125
[11]V Kocic-Pesic; D Radulovic; D Pecanac; L Zivanovic. Farmaco. 1992; 47(12), 1563-1567. [12]X Xie; X Pan; Z Wang. Zhongguo Yiyao Gongye Zazhi. 1990; 21(4), 171-174
[13]FC Pereira; AG Fogg; MVB Zanoni. Talanta. 2003; 60(5), 1023-1032.
[14]JC Moreira; SE Foster; JA Rodrigues, AG Fogg. Analyst. 1992; 117(6), 989-991. [15]JJ Gardner. J Chromatogr B Biomed Appl 30:1 J Chromatography. 1984; 305, 228-232. [16]OA Aswania; SA Corlett; H Chrystyn. J Chromatogr B Biomed Appl. 1997; 690(1-2), 373-378.
[17]LL Ng. J AOAC Int. 1994; 77(6), 1689-1694.
[18]A Segall; F Vitale; R Ricci; G Giancaspro; MT Pizzorno. Drug Dev Ind Pharm. 1997; 23(8), 839-842.
[19]K Mawatari; S Mashiko; Y Sate; Y Usui; F Iinuma; M Watanabe. Analyst. 1997; 122(7), 715-717.
[20]ML Ozoux; J Girault; JM Malgouyat; O Pasquier. J Chromatogr B Biomed Appl. 2001; 765(2), 179-185.
[21]XY Liu; TT Qu; BJ Wang; CM Wei; GY Yuan; R Zhang; RC Guo. Biomed Chromatogr,
2008; 22(9), 1021-1027.
[22]ZJ Lin; R Abbas; LM Rusch; L Shum. J Chromatogr B Analyt Technol Biomed Life Sci,
2003; 788(1), 159-166.
[23]JQ Wang; L Yu; H Dai. Yaowu Fenxi Zazhi, 1999; 19(6), 388-390.
[24]RM Duhaime; LK Rollins; DJK Gorecki; EG Lovering. J AOAC Int, 1994; 77(6), 1439-1442.
[25]R Mansfield; J Huang; S Thatcher; RB Miller; CW Davis. J Liq Chromatogr Relat Technol,
[26]M Barnes; R Mansfield; S Thatcher. J Liq Chromatogr Relat Technol, 2002; 25(12), 1721-1745.
[27]SD Santhosam, S Kannan, SL Devi; J. Chem. Pharm. Res., 2010, 2(6):62-67.
[28]B Jayakar, M Kumar, C Saravanan and MV Kumudhavalli; J. Chem. Pharm. Res., 2010, 2(1):478-481.
[29]BA Moussa, RI El-Bagary and YA Al-Eryani; J. Chem. Pharm. Res., 2011, 3(5):425-437. [30]BV Kumar, KP Kumar, K Suresh, S Apsar, P Srikanth and Y Suneetha; J. Chem. Pharm.
Res., 2011, 3(3):784-791.
[31]ChemBlink online database of chemicals from around the world, 2009. [32]http://www.chemblink.com/products/90-27-7.htm
[33]NK Sangwan. Eur J Med Chem, 1987; 22(2), 153-156.
[34]ICH Q2 (R1) Validation of Analytical Procedures: Text and Methodology. 2005. [35]El-Gindy. Farmaco, 2005; 60(8), 689-699.
[36]E Spath; W Gruber. Berichte, 1938; 71B, 106-113. [37]TA Geissman. J Am Chem Soc, 1949; 71(4), 1498.
[38]TA Geissman; E Hinreiner. J Am Chem Soc, 1951; 73(2), 782-786.
[39]F Ati; S El-Aoufi; A Chergui; HY Aboul-Enein; B Maouche. J Iran Chem Soc, 2008; 5(3), 506-513.