Full Length
DEVELOPMENT AND MANAGEMENT OF SOLAR AND WIND HYBRID TECHNOLOGY FOR
1
Ashish kumar and
1
M.Tech (Renewable Energy Technology), Delhi
2
Former AICTE Director, Associate Professor, Delhi Technological University, New Delhi
ARTICLE INFO ABSTRACT
Energy is vital for sustaining life on earth. The scope of this paper is to study the optimization and control of solar
software tools namely Homer is also included. A virtual case study for designing a solar hybrid system is considered. The results along wi
study verifies that solar
conventional sources of energy. These systems give better reliability, reduce pollution and are a good tool for the u
hybrid technologies creates a path of clean development and progress of developing country like India.
Copyright©2017, Ashish kumar and Kesari.This is an open access article
unrestricted use, distribution, and reproduction in any medium, provided the original work is properly cited.
INTRODUCTION
A renewable energy resource is a favorable alternative for rural energy supply. In order to handle their fluctuating nature, however, hybrid systems can be applied. These systems use different energy generation systems in combination, to ensure a stable energy supply in times of shortages of one of the energy resources. Key hope attributed to these systems is their good potential for economic development. Specifically, hybrid systems are alternative approach towards decentralized and vast electrification of the developing countries like India, one of the possible and feasible hybrid system can be made by combining the technologies presented above. They may be designed either as stand-alone mini-grids or in smaller scale as household systems. One of the major problems of solar energy and wind energy is the fluctuation of energy supply, which results in intermittent delivery of power supply and becomes problematic when a constant power supply is required f general purposes. This drawback can be avoided by the use of hybrid systems instead of using them individually. According to Weber, a hybrid system can be defined as “A combination of different, but complementary energy supply systems at the same place, i.e. solar cells and wind power plants”. This hybrid system is more reliable and efficient to use in practical world.
*Corresponding author: Dr. Kesari J.P.
Former AICTE Director, Associate Professor, Delhi Technological University, New Delhi , India
ISSN: 2230-9926
International Journal of Development Research
Vol. 0Article History:
Received 20th November, 2016 Received in revised form 18th December, 2016
Accepted 24th January, 2017
Published online 28th February, 2017
Key Words:
Homer, Hybrid, Design, Solar, Wind
Full Length Research Article
DEVELOPMENT AND MANAGEMENT OF SOLAR AND WIND HYBRID TECHNOLOGY FOR
THE PROGRESS OF INDIA
Ashish kumar and
2, *Dr. Kesari J.P.
M.Tech (Renewable Energy Technology), Delhi Technological University, New Delhi
Former AICTE Director, Associate Professor, Delhi Technological University, New Delhi
ABSTRACT
Energy is vital for sustaining life on earth. The scope of this paper is to study the
optimization and control of solar-wind hybrid systems. A brief introduction to the optimization software tools namely Homer is also included. A virtual case study for designing a solar hybrid system is considered. The results along with cost analysis are also presented. The case study verifies that solar-wind hybrid systems can prove to be a better option to replace the conventional sources of energy. These systems give better reliability, reduce pollution and are a good tool for the utility for demand side management. These type of non
hybrid technologies creates a path of clean development and progress of developing country like India.
This is an open access article distributed under the Creative Commons Attribution License, which permits reproduction in any medium, provided the original work is properly cited.
A renewable energy resource is a favorable alternative for rural energy supply. In order to handle their fluctuating nature, however, hybrid systems can be applied. These systems use generation systems in combination, to ensure a stable energy supply in times of shortages of one of the energy resources. Key hope attributed to these systems is their good potential for economic development. Specifically, hybrid proach towards decentralized and vast electrification of the developing countries like India, one of the possible and feasible hybrid system can be made by combining the technologies presented above. They may be in smaller scale as household systems. One of the major problems of solar energy and wind energy is the fluctuation of energy supply, which results in intermittent delivery of power supply and becomes problematic when a constant power supply is required for general purposes. This drawback can be avoided by the use of hybrid systems instead of using them individually. According Weber, a hybrid system can be defined as “A combination of different, but complementary energy supply systems at the i.e. solar cells and wind power plants”. This hybrid system is more reliable and efficient to use in practical
Former AICTE Director, Associate Professor, Delhi Technological
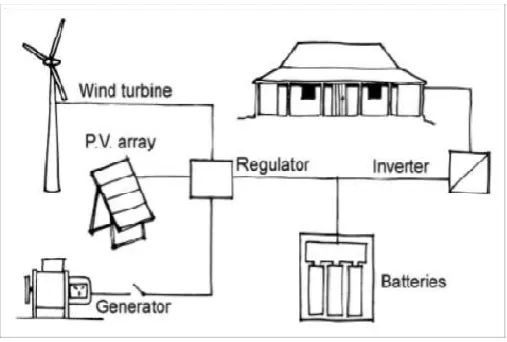
[image:1.595.308.562.534.705.2]Solar-wind hybrid power generation system when optimized, give increased efficiency and fulfill power demand at much lower cost when compared to coal based and gas based power plants. The schematic illustration of the component parts of solar-wind hybrid power plant are shown below in Figure
Figure 1. Schematic illustration of the component parts of solar-wind hybrid power plant
Working of Solar-Wind Hybrid Power System
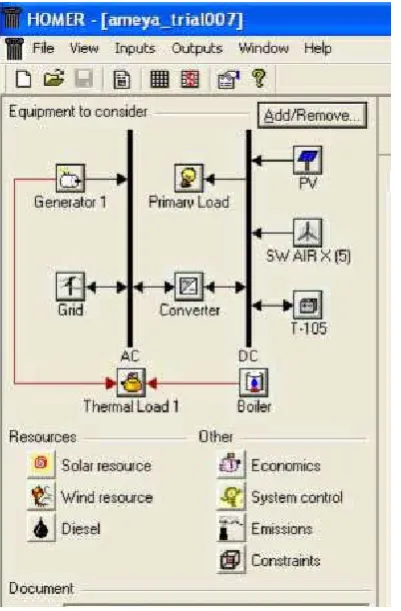
A schematic simulating model of a typical solar system is shown in the Figure 2.
International Journal of Development Research
Vol. 07, Issue, 02, pp.11504-11509, February,2017
DEVELOPMENT RESEARCH
DEVELOPMENT AND MANAGEMENT OF SOLAR AND WIND HYBRID TECHNOLOGY FOR
Technological University, New Delhi
Former AICTE Director, Associate Professor, Delhi Technological University, New Delhi
Energy is vital for sustaining life on earth. The scope of this paper is to study the working, sizing, wind hybrid systems. A brief introduction to the optimization software tools namely Homer is also included. A virtual case study for designing a solar-wind th cost analysis are also presented. The case wind hybrid systems can prove to be a better option to replace the conventional sources of energy. These systems give better reliability, reduce pollution and are a tility for demand side management. These type of non-conventional renewable hybrid technologies creates a path of clean development and progress of developing country like
distributed under the Creative Commons Attribution License, which permits
wind hybrid power generation system when optimized, give increased efficiency and fulfill power demand at much lower cost when compared to coal based and gas based power plants. The schematic illustration of the component parts of
power plant are shown below in Figure-1.
Schematic illustration of the component parts of wind hybrid power plant
Wind Hybrid Power System
A schematic simulating model of a typical solar-wind hybrid in the Figure 2.
Figure 2. A simulating model of a typical solar-wind hybrid system
During daytime, solar photovoltaic array converts
sunlight into electricity and stores this DC power in battery bank.
Wind generator acts like a back-up or make-up device
to keep the required power levels and starts generating electricity when wind speed goes beyond the cut-in speed of the wind turbine. The wind turbine is of self-regulated type with a protection system for over speed. The hybrid controller has inbuilt solar charge controller and wind charge regulator. It maximizes charging current and prevents excess discharge/overcharge of the batteries.
During partial availability of both solar and wind
energy, a generator is provided to make up the power. This ensures the efficient and un-fluctuated running of connected loads to our hybrid power system
Design of solar-wind hybrid power system
A combined approach of time series probabilistic + dynamic mechanical and electrical model procedure is required to be followed which is discussed below:
Time Series Probabilistic design
1) Collect the load historical data for minimum 5 years.
Classify the data as follows:
a) Monthly b) Hourly
c) Special incidents
d) Rate of increase or Decrease in load.
2) Determine the nature of load and classify it as follows:
a) Concentrated continuous
b) Distributed continuous c) Concentrated discontinuous. d) Distributed discontinuous
3) Analyze the operating characteristics of load, efficiency of
load etc.
4) With the help of above data magnitude and nature of load
can be determined.
5) The meteorological data for the past 10-15 years has to be
studied too.
6) Understand the weather pattern of a particular area and
classify the data as follows:
a) Temperature
b) Atmospheric pressure
c) Wind speed
d) Humidity Solar Radiation Rainfall.
Note: This data has to be classified on the monthly and hourly basis.
7) A combined datasheet of the above two information is
made as follows:
Table 1. Sample Datasheet
Month: Year: Time
Hrs
Temp °C
Wind Speed m/s
Solar Radiation w/m³
Load Kwh 00.00
to 24.00
8) From the above datasheet we can design the components as
follows:
a) Based on the load requirement, the total generating
capacity of the system can be estimated.
b) As per the prevalent wind and solar conditions, the
percentage of electricity generation from wind and solar is decided.
Example: At some places the summer may be for longer duration hence the solar PV capacity may be higher. Generally, the ratio lies as follows:
Electricity from wind 60% to 70% Electricity from sun 30% to 40%
c) Based on the terrain of the site, available wind speeds
and atmospheric conditions the components like towers, aero generators etcare selected.
d) Based on load calculations the storage battery capacity is decided.
e) The capacity of dump load is calculated. The proper
utilization of the dump load is the analyzed.
f) From the data of renewable sources, load conditions,
and the equipment selected the system supervisory control is designed.
Dynamic Mechanical + Electrical Approach
The tower height and type is selected (lattice or tubular)
otherwise next combination is tested. The predictions stated are done using complex mechanical concepts of strength of materials, stress-strain relationships etc.
The dynamic electrical approach is applied to the solar
photovoltaic cell, control equipment and load. The steady state and transient responses of all three components are studied separately.
In some special cases harmonic analyzers are used to calculate the total harmonic distortion and its various effects. If necessary, the harmonics are suppressed by using some special equipment. Thus the combined approach gives us the best possible technically sound configuration of the solar-wind hybrid system.
Software used for the Design of Hybrid Systems
The National Renewable Energy Laboratory has developed two very useful tools for the design of hybrid power systems. They are as follows:
HYBRID
HOMER
Homer
HOMER is the Hybrid Optimization Model for Electric Renewable. HOMER has been in development at NREL since 1994. In short, HOMER is a computer model that helps design standalone electric power systems. You give it information about electrical loads, renewable resources, and component costs, and HOMER designs the optimal power system to serve those loads.
Inputs to HOMER
HOMER divides inputs into four categories:
load inputs—the system’s electrical and thermal loads,
resource inputs—the available renewable energy
resources (using monthly or hourly data) and the price and characteristics of fossil fuels,
component inputs—the cost and performance of the
power system components,
Optimization inputs—the allowable size range for each
system component and various constraints on the power system.
Outputs from HOMER
HOMER provides three levels of outputs. The results of a particular system simulation include:
Summary results like capital cost, net present cost,
annual energy production, and fuel usage, as well as hourly data like battery state of charge or power production
Optimization results, which rank or merit all of the
different systems simulated for a particular sensitivity case
According to net present cost.
Sensitivity outputs that show the effects of changes in
sensitivity variables, in tabular or graphic format.
CASE STUDY
An attempt has been made to study the practical application of solar-wind hybrid power system and to understand the fundamental design of the solar-wind hybrid systems with the help of theoretical case study for the internal load of a building located in Delhi.
Step 1: Site Survey
The site proposed is carefully surveyed and the conclusions are made as follows
Ample Sunshine is available as the site is not
surrounded by tall buildings, also it is closer to the canal and hence enough wind is available.
The wind tower is not recommended to be placed on
roof-top considering the vibrations.
Step 2: Load Calculations
The proposed site is a new building hence no load historical data is available. However, the load is estimated based on application and the experience of the project designer. The system has to be designed for the lighting and fan load of the
site. The load scheme is designed as follows in Table 2. Also,
it is recommended to use energy efficient equipments for all the purposes.
Table 2. Load Calculation
Load Rating Nos. Load Working Time Rating Tubes 40 W 50 2 Kw 7 Hrs. 14.00 Kwh Fans 80 W 25 2 Kw 7 Hrs. 14.00 Kwh
Total Consumption per day…... 28.00 Kwh
Step 3: Percentage combination of wind and solar
The meteorological data for wind is obtained for the site. Following parameters are considered:
1) Wind density
2) Wind speed in m/s
The solar data is collected and the parameters are as follows:
1) Net solar radiation
2) Intensity
3) Efficiency of solar PV module used.
Other data required:
a) Average temperature throughout the year.
b) Rainfall
Considering the above parameters for the proposed site, we select the following percentage combination:
Percentage of wind generation 60% Percentage of solar generation 40%
Accordingly,
Total load in Kw - 4 Kw
Wind generation - 2.4 Kw
From the above we select solar PV system as follows: PV panels 75 W ………….22 Nos.
Selection of wind generator
Wind Power Factors: The following factors are to be considered for the selection of wind turbine and its siting. The power available from wind is found from the equation,
P = ½•d•A•V3
Where, P = power,
d = density, A = area, V = wind speed.
Thus, the most important factors for energy production from a wind turbine are the swept area (size) of the rotor, and, especially, the wind speed. If the rotor diameter is doubled the available energy increases by a factor of 8. If wind speed doubles the available energy increases by a factor of 8. For example, a 25% increase in wind speed, say from 10 mph to 12.5 mph, will result in approximately twice the wind power available.
Wind Tower Height
Generally, small wind turbines should be located so that the lowest part of the rotor is a minimum height of 10 m (30 ft) above an obstacle within a 100 to 150 m (300 to 500 ft) radius, in order to reduce wind shear and turbulence, and increase wind speed. A taller tower is always the best investment in a wind energy system. For example, an increase in tower height from 100 to 120 ft may result in a 20 to 25% increase in energy production. Increasing tower height from near ground level, say from 30 ft to 100 ft, will result in a more dramatic energy production increase, possibly as much as 100%.
Energy Production vs. Peak Power:
Power is an instantaneous measurement, in kilowatts (kW). Energy, in kilowatt-hours (kWh), is what does the work and what is purchased from (or sold to) the utility company, and what really matters in a wind energy system. The peak power rating of a wind turbine has little importance compared to its energy production over time. A wind turbine that is “rated” at a high kW power output in high winds may be very poor at producing energy over an entire year, as the high winds at which it is rated do not occur over a long period of time. Thus, the peak power rating of a wind turbine should not be used as selection criteria. If peak power ratings between different wind turbines are compared, it should be done at a standard wind
speed, typically 11 meters per second (m/s), or 25 mph. Power curve and energy production estimates for wind turbines should be used with caution. Turbine manufacturer estimates of energy production are often not based on real world testing and are often overly optimistic. Only power and energy curves based on testing certified by an industry-accepted, qualified, independent, test facility should be trusted.
Turbulence
Turbulence reduces effective wind speed available to the wind turbine, as well as the efficiency and reliability of wind turbine. Locating a wind turbine as recommended in the Tower Height section will minimize turbulence. In addition, it is recommended to separate adjacent wind turbines by a distance of at least 3 times the rotor diameter (or width), and to not align multiple wind turbines in prevailing wind directions.
Lift vs. Drag
Most modern power-producing wind turbines employ the aerodynamic lift effect, utilizing rotors blades with an airfoil shape. Such rotors typically use 2 to 3 blades and operate at a high rpm speed.
Lift-style wind turbines have a theoretical maximum conversion efficiency of wind energy to mechanical energy, called the Betz Limit, of 59%. Practically, the conversion efficiency limit for small lift wind turbines, from wind power to electrical power, is near 30%. Wind turbines that do not use airfoil blades employ the drag effect, i.e. the wind simply pushes the rotor. Wind turbine rotors using the drag effect turn more slowly (lower rpm) than lift rotors, and often have many blades, or a solid rotor surface. The theoretical limit for conversion efficiency from a drag-style wind turbine is 15% (compared to 59% for a lift turbine), with actual conversion efficiencies often much lower. Wind powered water pumpers are one example of drag wind turbines in use. A type of rotor commonly used in VAWT’s is the Savonius design, which is a modified drag-style rotor, with higher efficiency than a simple drag rotor. 30% maximum conversion efficiency is possible with a Savonius rotor in wind tunnel tests. However, in practice, Savonius turbines have conversion efficiencies of less than 15%.
VAWT vs. HAWT
[image:4.595.94.501.379.468.2]HAWT’s are the most widely utilized style of wind turbine currently employed for power production. HAWT designs have the best conversion efficiency in utilizing the lift effect, due to the constant angle of attack of the rotor blades with respect to the wind direction. Because of the relatively constant and centrifugal forces on the rotor, HAWT’s are also
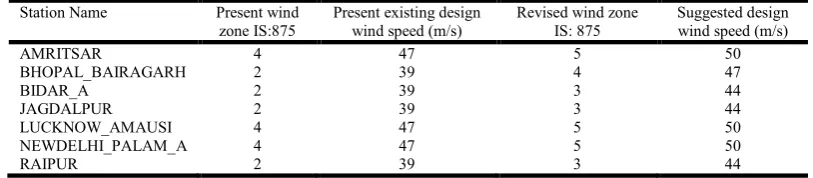
Table 3. Estimated wind speed at various location in INDIA
Station Name Present wind zone IS:875
Present existing design wind speed (m/s)
Revised wind zone IS: 875
Suggested design wind speed (m/s)
AMRITSAR 4 47 5 50
BHOPAL_BAIRAGARH 2 39 4 47
BIDAR_A 2 39 3 44
JAGDALPUR 2 39 3 44
LUCKNOW_AMAUSI 4 47 5 50
NEWDELHI_PALAM_A 4 47 5 50
RAIPUR 2 39 3 44
the most reliable in using a lift rotor. HAWT designs are more complex than VAWT’s, due to the need for the turbine to yaw when the wind direction changes so that the rotor maintains the same relative position with respect to the wind. Also, lift-style HAWT’s must employ a governing mechanism to prevent the rotor from spinning too fast in high winds. Because of the sensitivity to wind direction the performance of lift-style HAWT’s is significantly affected by turbulence. Several, established, recognized small wind manufacturers offer HAWT’s.
VAWT’s can use lift or drag rotors. Their main advantage is that the design can be simpler, as the rotor is omni-directional (no yaw). Because of this VAWT’s are less sensitive to turbulence than HAWT’s. Also, VAWT’s are inherently self-governing (no over speed control required). A VAWT rotor always has one half going downwind and one-half returning upwind, which limits the rotational speed (and efficiency). This same attribute, however, also results in differential stresses applied to the rotor each revolution, which affects rotor reliability. This is especially true for lift-style VAWT’s, which operate at higher speeds and typically have vertical airfoil blades mounted at the end of support struts. The blade support struts often experience failure after extended operation. Also, VAWT’s are typically supported only from the bottom. The rotational force of the rotor combined with the leveraging force of the wind can apply severe stresses to the
generator bearings. There are many wind turbine
manufacturers that offer VAWT’s. None, in our opinion, are as yet recognized, established, and known to offer reliable products.
Turbine Mass
A heavy wind turbine can be an indicator of stout construction and a sufficiently sized alternator (more copper windings are heavy) for good power production. Therefore, on considering the above factors, an appropriate wind turbine of capacity 2.4 KW selected for use. Approximate cost for wind energy is approximately Rs 5 to 6/KWh as per the Central Electricity Regulatory Commission, New Delhi.
Step 4: Battery Bank
Considering the load system is designed for 48V. The load is of constantly fluctuating type hence the battery bank needs a very proper selection. The load calculated requires storage in high generating period as well as it requires backup in situation of high demand and low generation. The battery configuration calculated amounts to be about 1000 Ah. The battery combination of both series and parallel can be changed as per requirement.
Step 5: Dump Load:
Load dump means the disconnection of a powered load. It can cause 2 problems:
Failure of supply to equipment or customers
Large voltage spikes from the inductive generator(s)
The dump load predicted from the calculations is very negligible and inconsistent hence it is not proposed to utilize the dump load for any other application such as space heating.
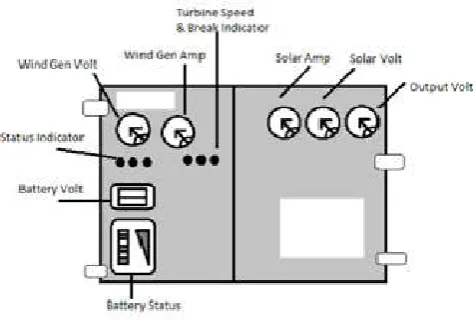
Step 6: Control Room
[image:5.595.313.550.98.258.2]Control room is the house for all the control equipments used for various parameter controls, which in turn are responsible for the smooth and efficient functioning of the system.
Figure 3. Control Parameters be taken into account
The control equipments should have the following features
a) Tracks RPM and applies auto brake.
b) Prevents hunting.
c) Accurate battery level indication.
d) Battery over charge protection.
Thus we select following specifications of the solar-wind hybrid system as follows:
[image:5.595.304.566.449.539.2]System Rating: 1.6 KW (solar) + 2.4 KW (wind) = 4 KW at peak availability of both solar and wind energy.
Table 4. Specifications and details of the components
S.No Name of Equipment Rating with units Number required 1. Solar Array size 1600 Wp @STC 1
2. Wind generator 2400 W @ STC 1
3. System voltage 48 Vnom -
4. Battery bank capacity 2000 Ah 1
5. No. of Solar PV modules - 22
6. Inverter 4000 VA 1
7. Output AC Waveform Sine wave -
8. Output AC Voltage 230 V -
Also, in addition to above mentioned equipments a gen-set of 4 Kw is also installed to back-up power when both solar and wind power are unavailable or partially available.
Step 7: Costing and payback period calculations
The overall cost of the system is estimated to be Rs. 6,00,000/. The cost of electricity that can be saved using this hybrid system is calculated in Table below;
Table 5. Cost calculations
1. Daily consumption 28 Units 2. Cost /unit Rs. 4
3. Cost for 1 day 28*4. = Rs. 112 4. Cost for 30 days 112*30=Rs.3360 5. Cost for 360 days 3360*12=40,320 Note: We have considered approximate consumption.
The cost of electricity is ever increasing. Hence, we see that
we save approximately Rs. 40,320 per year. The payback
Conclusion
Hybrid solar-wind power generation with battery storage form a complementary system: the wind is more dynamic source than solar, it also provides energy during periods of little or no sunshine whereas output of solar cells is dependent on the amount of sunshine on the particular day; battery storage allows for the displacement of the energy by storing at a favorable time and then using the excess energy when necessary. This improves the system reliability and combination of both solar & wind makes the power supply constant, which is the vital requirement of power source for appliances to work properly and more efficiently. If data of the nearest meteorological station is to be used in system designing, the degree of similarity of both sites must the primary resources (wind speed, irradiance) averaged over several years are helped in predicting system performance for a long period of time, the fluctuations in the resources from year to year, however, is a handicap in determination of system component ratings that would satisfy a long term objective. Basing the calculations on the worst months of the year instead may help reduce design uncertainty. The total voltage distortion, the frequency, and voltage level the point of connection to the grid remains at acceptable levels. That is, the connection of the system to the grid is not a source in terms of “power quality”. Further improvements in PV and battery technologies and continuous reduction in prices, moreover the environmental benefits are likely to facilitate the widespread use and recognition of such systems by utility companies in Demand Side Management. These technologies can help the people living in remote areas to have access to the clean and cheap source of energy, from which they are deprived yet. This further will make nation more prosper and developed nation.
REFERENCES
The cost of wind power –the Facts within the fiction: Poul Erik Morthorst, Hugo Chandler
Wind Energy in India, J.F.Manwel, A Rogers, J.C.McGowan 16-18, IEEE Power Engineering, Vol 22, September 2002 HYBRID2- A Hybrid System Simulation Model; Francois
Giraud, Zyaid M, Salame, Theory Manual, Nov2, 1998. Steady state performance analysis of a grid connected rooftop
hybrid wind-photovoltaic power system with the battery storage. IEEE Transactions on energy conservation, VOL.16, No 1, March2001.
Renewable Energy Sources and Conversion Technology; N.K. Bansal, M Kleeman, M.Meliaki, Tata Mc-Graw hill publishing company ltd.
Guidelines for Selecting Wind Turbine Sites Based on a paper presented at NOISE-CON 08, Institute of Noise Control Engineering, Dearborn, MI, July 2008.
Site Selection for Wind Farm Installation G.C.
Biswal,S.P.Shukla Depart -ment of Electrical Engineering, BIT, Durg, India.
Basic wind speed map of India with long-term hourly wind
data N. Lakshmanan, S. Gomathinayagam*, P.
Harikrishna, A. Abraham and S. ChitraGanapathi Non-conventional energy resources; G.D.Rai www.nrel.gov/homer/default.asp
www.windstreampower.com www.mnes.com
www.mahaurja.com www.homepower.com
https://en.wikipedia.org/wiki/Load_dump http://cercind.gov.in/2016/orders/sm_3.pdf
Renewable Energy World, Rakesh Bakshi 126-137 Vol 7, July-August 2004