R E S E A R C H A R T I C L E
Open Access
Brain structural and functional dissociated
patterns in schizophrenia
Chuanjun Zhuo
1,2,3,4*†, Jiajia Zhu
1†, Chunli Wang
2, Hongru Qu
3, Xiaolei Ma
3, Hongjun Tian
2, Mei Liu
2and Wen Qin
1*Abstract
Background:Although previous studies found that aberrations in gray matter volume (GMV) and global functional connectivity density (gFCD) are important characteristics of schizophrenia, to the best of our knowledge no study to date has investigated the associations between the spatial distribution patterns of GMV and gFCD alterations. We investigated pattern changes in gFCD and GMV among patients with schizophrenia and their associated spatial distributions.
Methods:Ninety-five patients with schizophrenia and 93 matched healthy controls underwent structural and resting-state functional MRI scanning to assess gFCD and GMV.
Results: We found that gFCD increased in the subcortical regions (caudate, pallidum, putamen, and thalami) and limbic system (left hippocampus and parahippocampus), and decreased in the posterior parieto-occipito-temporal cortices (postcentral gyri, occipital cortex, temporo-occipital conjunction, and inferior parietal lobule), in patients with schizophrenia. By contrast, we found decreased GMV in brain regions including the frontal, parietal, temporal, occipital, cingulate cortices, and the insular, striatum, thalamus in these patients. Increased gFCD primarily occurred in subcortical regions including the basal ganglia and some regions of the limbic system. Decreased gFCD appeared primarily in the cortical regions. There were no statistically significant correlations between changes in gFCD and GMV, and their spatial distribution patterns, in different regions.
Conclusions:Our findings indicate that gFCD and GMV are both perturbed in multiple brain regions in schizophrenia. gFCD and GMV consistently decreased in the cortical regions, with the exception of the Supplementary Motor Area (SMA). However, in the sub-cortical regions, the alterations of gFCD and GMV showed the opposite pattern, with increased gFCD and decreased GMV simultaneously observed in these regions. Overall, our findings suggest that structural and functional alterations appear to contribute independently to the neurobiology of schizophrenia.
Keywords:Schizophrenia, Functional connectivity, Gray matter volume, Spatial distribution, Structural brain alterations
Background
In the past few decades, numerous MRI studies have re-ported that schizophrenia is associated with widespread brain structural and functional alterations [1–14]. Previ-ous studies have consistently confirmed that patients with schizophrenia have a diffused gray matter volume (GMV) decreases and that this is predominantly located in various cortical and subcortical brain regions. The overwhelming majority of studies have demonstrated that the frontal,
temporal, and parietal lobes, cingulate cortex, hippocam-pus, thalami, and basal ganglia are key regions of GMV decrease in schizophrenia [1–8].
Echoing the alterations in brain structure in schizophre-nia, considerable fMRI evidence suggests that functional alterations characterized by hyper-functional activity in sub-cortical regions (mainly in the basal ganglia and some regions of limbic system) with coexistent hypo-or hyper-functional activity in chypo-ortical regions occur in schizophrenia. The frontal, temporal and parietal lobes, cingulate gyrus, occipital gyrus, hippocampus, and thalami are key regions of functional alteration in schizophrenia [9–20].
* Correspondence:[email protected];[email protected] †Equal contributors
1Department of Radiology and Tianjin Key Laboratory of Functional Imaging,
Tianjin Medical University General Hospital, No. 154, Anshan Road, Heping District, Tianjin 300052, China
Full list of author information is available at the end of the article
ber of functional connections between a given voxel and other voxels in the whole brain, producing a measure of global functional connectivity density (gFCD) [23–26]. gFCD has been developed to measure the number of resting-state functional connections of a given voxel with all other voxels in the entire brain and reflects a one-to-many relationship. While traditional functional connectiv-ity mainly measures the connectivconnectiv-ity (FC) strength be-tween two voxels or regions or networks, which reflects a one-to-one relationship [23–27, 28]. Compared to trad-itional FC, gFCD can reflect the functional activity aber-rant from another perspectives, a recent study have shown that gFCD is also a biomarker for psychiatric disorders [26]. Although previous studies found that aberrations in GMV and gFCD are important characteristics of schizo-phrenia, to the best of our knowledge no study to date has investigated the associations between the spatial distribu-tion patterns of GMV and gFCD alteradistribu-tions.
Therefore, in the present study we aimed to investigate the alterations in GMV and gFCD, and their spatial dis-tribution patterns in patients with schizophrenia, using VBM and FCDM. Several previous studies [17, 29, 30] reported that anatomical and functional brain aberrant are significantly dissociated with schizophrenia, anatom-ical aberrant has been most robust within thalamo-cortical regions, while functional aberrant has been most pronounced in fronto-parietal and default-mode net-works regions. More importantly, the spatial and tem-poral distributions of anatomical and functional alterations are uncorrelated and the aberrant patterns are also inconsistent or even contradictory, demonstrate a“distinct patterns”[17]. Based on these findings, we hy-pothesized that gFCD and GMV would be altered in pa-tients with schizophrenia compared with matched healthy controls. We also hypothesized that gFCD and GMV would both be affected in particular brain regions but that their spatial distributions and aberrant patterns (increased or decreased) are also unrelated, or even more complex [31–33].
Methods Subjects
A total of 200 right-handed subjects participated in the study, including 98 patients with schizophrenia and 102 healthy controls. The patients were recruited from Tianjin Aning Hospital and Tianjn Anding Hospital and the healthy controls were recruited from the hospital staff or
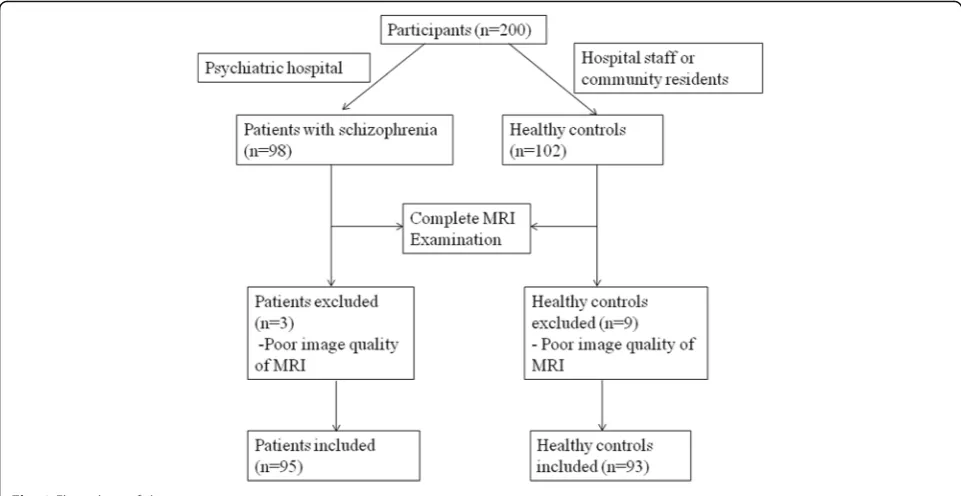
uals with a known history of psychiatric illness in first-degree relatives. Exclusion criteria for all subjects were a history of head trauma with consciousness distur-bances lasting more than 5 min, a history of substance abuse, pregnancy, or any physical illness, such as car-diovascular disease and neurological disorders, as diag-nosed by interview or a review of their medical records. A professional radiologist assessed the MRIs slice-by-slice, and three patients and nine healthy controls were excluded owing to poor image quality. Consequently, the results for 95 patients with schizophrenia and 93 controls were analyzed (Fig. 1). The Positive and Negative Syndrome Scale (PANSS) was used to assess the severity of patients’ psychotic symptoms. The Medical Research Ethics Committee of Tianjin Medical University General Hospital approved this study. Written informed consent was gained from each participant following a complete de-scription of the study.
MRI data acquisition
MRI was performed using a 3.0-Tesla MR system (Discovery MR750, General Electric, Milwaukee, WI, USA). Tight, but comfortable, foam padding was used to minimize head motion, and earplugs were used to reduce scanner noise. Sagittal 3D T1-weighted images were acquired using a brain volume sequence with the following parameters: repetition time (TR) = 8.2 ms; echo time (TE) = 3.2 ms; inversion time (TI) = 450 ms; flip angle (FA) = 12°; field of view (FOV) = 256 mm × 256 mm; matrix = 256 × 256; slice thickness = 1 mm, no gap; and 188 sagittal slices). Resting-state fMRI data were acquired using a gradient-echo single-short Echo planar imaging sequence with the following parameters:
TR/TE = 2000/45 ms; FOV = 220 mm × 220 mm;
matrix = 64 × 64; FA = 90°; slice thickness = 4 mm; gap = 0.5 mm; 32 interleaved transverse slices; and 180 volumes. All subjects were requested to keep their eyes closed, relax, move as little as possible, think of nothing in particular, and not fall asleep during the scanning period.
fMRI data preprocessing
The remaining volumes were corrected for the acquisition time delay between slices. Realignment was then per-formed to correct for motion between time points. All subjects’fMRI data were within defined motion thresholds (i.e., translational or rotational motion parameters less than 2 mm or 2°). We also calculated frame-wise displace-ment, which indexes volume-to-volume changes in head position. Several nuisance covariates (six motion parame-ters, their first time derivations, and average BOLD signals of the ventricular and white matter) were regressed from the data. Recent study have reported that the signal spike caused by head motion significantly contaminates the final resting-state fMRI results even after regressing out the six motion parameters [34]. Therefore, we further regressed out spike volumes when the frame-wise displacement of the specific volume exceeded 0.5. The datasets were then band-pass filtered in a frequency range of 0.01 to 0.08 Hz [35]. In the normalization step, individual structural im-ages were linearly co-registered with the mean functional image, and then linearly co-registered to the Montreal Neurological Institute (MNI) space. Finally, each filtered functional volume was spatially normalized to the MNI space using the co-registration parameters and were resampled into a 3-mm cubic voxel.
GMV calculation
The GMV of each voxel was calculated using SPM8 (http://www.fil.ion.ucl.ac.uk/spm/software/spm8/). Structural MR images were segmented into gray matter (GM), white matter and cerebrospinal fluid using the standard unified segmentation model. After an initial
affine registration of the GM concentration map into the MNI space, GM concentration images were nonlinearly warped using the diffeomorphic anatomical registration through exponentiated lie algebra technique, and the re-sults resampled to a voxel size of 3 mm × 3 mm × 3 mm. The GMV of each voxel was obtained by multiplying the GM concentration map by the non-linear determinants derived from the spatial normalization step. Finally, the GMV images were smoothed using a Gaussian kernel of 6 mm × 6 mm × 6 mm full-width at half maximum. After spatial preprocessing, the smoothed GMV maps were used for statistical analyses.
FCD calculation
The FCD of each voxel was calculated using an in-house Linux script according to the method described by Tomasi and Volkow [23–26]. Pearson’s linear correlation evaluated the strength of the functional connectivity between voxels [36, 37]. According to the most of the pre-vious studies, voxel pairs with a correlation coefficient of
[image:3.595.57.538.88.336.2]significant group differences in gFCD, were extracted for each subject and used for region of interest (ROI)-based group comparisons. To clarify if the regions with altered gFCD also showed structural impairment, we first tested the group differences in GMV for each ROI using two-sample t-tests after controlling for age and sex. The group differences in gFCD were then tested using two-sample t-tests, after further regressing out the GMV in-fluences, to investigate their separate contributions to functional aberrances in schizophrenia. Finally, a partial correlation coefficient was used to test the relationship between gFCD and GMV in each group, and to test the associations between gFCD and clinical variables, includ-ing antipsychotic dose (chlorpromazine equivalents), ill-ness duration, and PANSS scores. Age and sex effects were regressed out and multiple comparisons were cor-rected using the Bonferroni method (P< 0.05).
Results
Subject demographics and clinical characteristics
The demographic and clinical characteristics of the sub-jects are summarized in Table 1. There were no signifi-cant group differences in sex (χ2 = 1.35, P= 0.25) or age (t = 0.48, P= 0.63). Eighty-seven patients received medication during the MRI examinations, with the remaining eight patients being treatment naïve. The mean antipsychotic dose (cholorpromazin equivalents) was 446.5 ± 341.6 mg/d for the patients with schizophrenia.
Our results revealed that the strongest gFCD hubs were consistently located in the precuneus, inferior parietal lobe, superior temporal gyrus, medial prefrontal cortex, and dorsal lateral prefrontal cortex in our two groups. Most of the gFCD hubs are located in the default mode network and sensory cortices (Fig. 2). The distribution of the gFCD hubs did not differ between the two groups and was also consistent with the results of Tomasi et al. [24].
gFCD changes in patients with schizophrenia
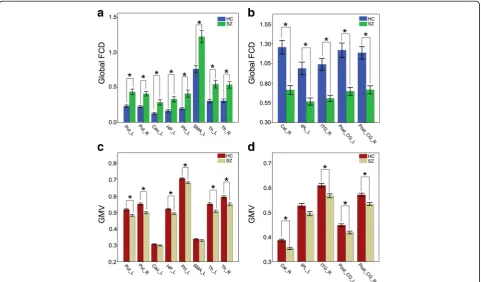
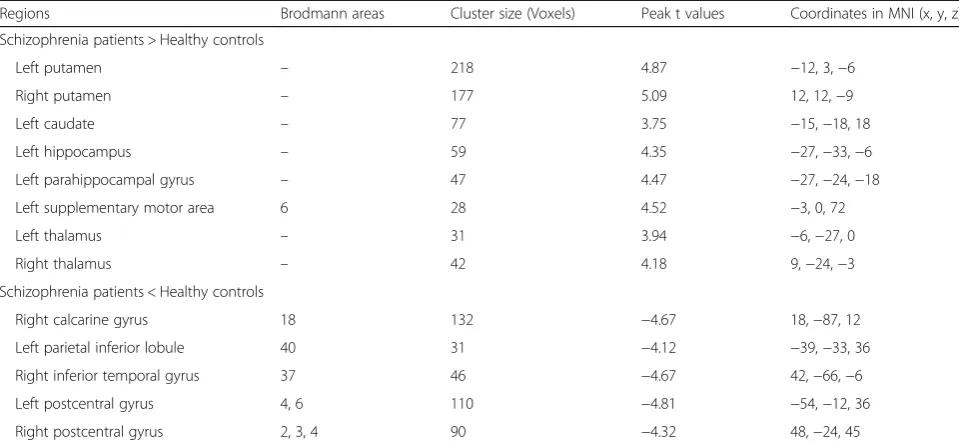
Voxel-wise analysis showed increased gFCD in the sub-cortical and limbic system areas (including the bilateral putamen, caudate, pallidum, and thalami), the hippocampal/ parahippocampal complex, and the supplementary motor area (SMA) (Fig. 3a, Table 2). Decreased gFCD was seen in the posterior cortices, including the bilateral postcentral gyri, precentral gyri, right calcarine sulcus, and the left inferior occipital gyrus lobule in patients with schizophrenia (Fig. 3b, Table 2). ROI-based analyses showed that the differences in gFCD between schizophrenia patients and controls persisted even further regress out the GMV effect, suggesting that gFCD alterations in these ROIs are relatively independent characteristics of schizophrenia.
Gray matter volume changes in patients with schizophrenia
Decreased GMV was seen only in the bilateral frontal, parietal, temporal, occipital lobule, cingulate cortex, in-sular, striatum and thalamus in patients with schizophre-nia (Fig. 3c and d and Table 3).
Associations between the spatial distributions of gFCD and GMV
[image:4.595.56.290.543.714.2]As previously mentioned, increased gFCD were primarily located in subcortical regions, including the basal ganglia and some components of the limbic system and SMA. Decreased gFCD were primarily located in the posterior cortical regions. However, in this study, only decreased GMV was observed. Notably, the aberrant patterns of gFCD and GMV differ between regions. In the caudate, thalami and hippocampus complex (HPC), gFCD in-creased but GMV dein-creased, while in the posterior corti-ces, decreased gFCD accompanied decreased GMV. These findings indicated a complex association between gFCD aberrances and GMV changes in schizophrenia. To further investigate whether gFCD correlates with GMV changes, we also performed correlation. In multiple regions, we
Table 1Demographic and clinical characteristics of the participants
Characteristics Schizophrenia Patients
Healthy Controls
Pvalue
Number of subjects 95 93 NA
Age (years) 33.6 (7.8) 33.0 (10.2) 0.633
Gender (female/male) 41/54 48/45 0.246
Antipsychotic dosage (mg/d) (chlorpromazine equivalents)
446.5 (341.6) – NA
Duration of illness (months) 121.4 (92.8) NA
PANSS – NA
Positive score 17.1 (7.9) –
Negative score 20.3 (9.1) –
General psychopathologyscore 34.1 (10.8) –
Total score 71.5 (23.2) –
found that although gFCD and GMV were both affected, there was no statistical correlation between gFCD and GMV either in patients with schizophrenia patients or controls (Fig. 3).
Association between gFCD/GMV and clinical variables We did not find any statistical correlation between gFCD or GMV and antipsychotic dose, illness duration, or any PANSS scores (negative, positive, general psychopathology, or total scores).
Discussion
In this study, we first used voxel-wise graph theory to investigate the spatial distribution patterns of gFCD and GMV alterations in a relatively large schizophrenic patient data set. We found that gFCD and GMV were both affected in some regions of the basal ganglia, thalami, limbic system, and posterior cortices, which are the key regions contributing to the pathology of schizophrenia as indicated by several lines of evidence.
Fig. 2Spatial distributions of the average rescaled gFCD hubs between patients with schizophrenia and controls. Abbreviations: gFCD, global FCD; HC, healthy controls; SZ, patients with schizophrenia
[image:5.595.58.538.87.182.2] [image:5.595.58.540.369.651.2]More importantly, in our findings, decreased gFCD was found in areas primarily located in the posterior cortical regions, while increased gFCD was observed primarily in areas located in the sub-cortical and limbic system regions. However, only decreased GMV was found in either the cortical or sub-cortical regions in patients with schizophrenia.
In our previous study, we demonstrated for the first time that the gFCD aberrant in schizophrenia, we found increased gFCD in the bilateral striatum and hippocampus and decreased rsFCD in the bilateral sensorimotor cortices and right occipital cortex [27]. Our previous findings added
new evidence for supporting the hypothesis that schizo-phrenia is a connectivity disorder from the perspective of functional connectivity density [27]. And our findings had been confirmed by the subsequent studies [41–43].
As previously mentioned, some cortical regions (e.g., the frontal, temporal, and parietal lobes, cingulate gyrus, cuneus, and others), limbic system (e.g., hippocampus, parahippocampus, and thalami) and basal ganglia are key regions of functional connectivity and GMV aberrances in schizophrenia. In this study, gFCD and GMV were both affected in most of these regions, but the spatial distribu-tion pattern of gFCD and GMV differed between regions. With the exception of the SMA, in the cortical regions, gFCD and GMV consistently decreased. However, in the sub-cortical regions, the alterations in gFCD and GMV contrasted, with increased gFCD and decreased GMV simultaneously observed in these regions.
Our results suggest that the association between ana-tomical changes and functional activity aberrances is com-plex and undefined. Previous studies also demonstrated that structural deficits do not have a straightforward relationship with functional abnormalities [20, 44, 45]. Thus, longitudinal studies aiming to pinpoint the onset of connectivity abnormalities as schizophrenia develops will help clarify the nature of the associations between the structural deficits and functional connectivity alterations in schizophrenia [44].
In this study, we did not found a correlation between aberrant of gFCD/GMV and antipsychotic dose, illness duration, and symptom severity, this finding is con-sistent with previous studies. and suggest that illness duration, symptom severity, and antipsychotic dose
Left parahippocampal gyrus – 47 4.47 −27,−24,−18
Left supplementary motor area 6 28 4.52 −3, 0, 72
Left thalamus – 31 3.94 −6,−27, 0
Right thalamus – 42 4.18 9,−24,−3
Schizophrenia patients < Healthy controls
Right calcarine gyrus 18 132 −4.67 18,−87, 12
Left parietal inferior lobule 40 31 −4.12 −39,−33, 36
Right inferior temporal gyrus 37 46 −4.67 42,−66,−6
Left postcentral gyrus 4, 6 110 −4.81 −54,−12, 36
Right postcentral gyrus 2, 3, 4 90 −4.32 48,−24, 45
[image:6.595.57.537.99.322.2]FCDfunctional connectivity density,MNIMontreal Neurological Institute
Table 3Group differences in GMV between patients with schizophrenia and controls
HC SZ F Sig.
Striatum_L 0.520 ± 0.059 0.482 ± 0.066 17.778 <0.001
Striatum_R 0.552 ± 0.062 0.499 ± 0.064 35.410 <0.001
Cau_L 0.306 ± 0.030 0.299 ± 0.034 2.436 0.120
HP_L 0.522 ± 0.043 0.493 ± 0.048 17.063 <0.001
PH_L 0.709 ± 0.049 0.682 ± 0.055 11.519 0.001
SMA_L 0.338 ± 0.049 0.330 ± 0.056 .726 0.395
Th_L 0.553 ± 0.067 0.508 ± 0.071 17.739 <0.001
Th_R 0.596 ± 0.070 0.551 ± 0.082 13.913 <0.001
Cal_R 0.387 ± 0.045 0.353 ± 0.047 22.458 <0.001
IPL_L 0.528 ± 0.089 0.496 ± 0.082 5.438 0.021
ITG_R 0.611 ± 0.077 0.569 ± 0.078 14.333 <0.001
Post_CG_L 0.448 ± 0.055 0.419 ± 0.056 11.270 0.001
Post_CG_R 0.572 ± 0.067 0.535 ± 0.058 14.566 <0.001
[image:6.595.57.290.528.724.2]are not linearly related to brain functional or structural abrreant [17, 32, 41, 44]. Our findings suggested that aberrant gFCD and GMV maybe an independent trait characteristic of schizophrenia. Our findings also support the hypothesis that BOLD signal alterations may better track the presence of psychosis rather than its severity or duration [20], and is not linearly related to the anti-psychotic dose [46].
Conclusion
This study provides new evidence of aberrant gFCD and decreased GMV in multiple brain regions contributing to the pathology of schizophrenia in a relatively large sample of patients with schizophrenia. More importantly, we re-vealed that gFCD and GMV are jointly affected in multiple regions, but that their spatial distribution patterns in the in-tergroup difference maps were dissociated. These findings suggest that structural and functional alterations probably contribute independently to the neurobiology of schizo-phrenia. However, the nature of the associations between the structural deficits and functional alterations needs clari-fication using longitudinal studies to pinpoint the onset of connectivity abnormalities as schizophrenia develops.
Abbreviations
FCD:Functional connectivity density; gFCD: Global functional connectivity density; GMV: Gray matter volume; PANSS: Positive and negative syndrome scale; SCID: Structural clinical interview for DSM-IV
Acknowledgements
We would gratefully thank for the patients, their families.
Funding
This study was supported by grants from the Natural Science Foundation of China (81425013, 91332113 and 81271551), China Postdoctoral Science Foundation Funded Project (2012 M 520585), the Tianjin Key Technology R&D Program (14ZCZDSY00018) and China Potevio Information Industry Co.
Availability of data and materials
Data will not be made available in order to protect the participants identity.
Authors’contributions
CZ, JZ, and WQ designed the study. CW, HQ, XM, HT and ML acquired and CZ, JZ, and WQ analyzed the data. CZ, JZ, and WQ wrote the article, which all authors reviewed and approved for publication.
Competing interests
The authors declare that they have no competing interests.
Consent for publication
Not applicable.
Ethics approval and consent to participate
The study was approved by the Regional Committee for Medical Research Ethics. All participants gave their written informed consent.
Author details
1Department of Radiology and Tianjin Key Laboratory of Functional Imaging,
Tianjin Medical University General Hospital, No. 154, Anshan Road, Heping District, Tianjin 300052, China.2Department of Psychiatry Functional
Neuroimaging Laboratory, Tianjin Mental Health Center, Tianjin Anding Hospital, Tianjin, China.3Department of Psychiatry, Tianjin Anning Hospital,
Tianjin 300300, China.4Department of Psychiatry, Wenzhou Seventh People’s
Hospital, Wenzhou, Zhejiang Province 325000, China.
Received: 29 August 2016 Accepted: 4 January 2017
References
1. Thompson PM, Vidal C, Giedd JN, Gochman P, Blumenthal J, Nicolson R, Toga AW, Rapoport JL. Mapping adolescent brain change reveals dynamic wave of accelerated gray matter loss in very early-onset schizophrenia. Proc Natl Acad Sci U S A. 2001;98:11650–5.
2. Hulshoff Pol HE, Schnack HG, Mandl RC, van Haren NE, Koning H, Collins DL, Evans AC, Kahn RS. Focal gray matter density changes in schizophrenia. Arch Gen Psychiatry. 2001;58:1118–25.
3. Kawasaki Y, Suzuki M, Kherif F, Takahashi T, Zhou SY, Nakamura K, Matsui M, Sumiyoshi T, Seto H, Kurachi M. Multivariate voxel-based morphometry successfully differentiates schizophrenia patients from healthy controls. Neuroimage. 2007;34:235–42.
4. Tanskanen P, Ridler K, Murray GK, Haapea M, Veijola JM, Jääskeläinen E, Miettunen J, Jones PB, Bullmore ET, Isohanni MK. Morphometric brain abnormalities in schizophrenia in a population-based sample: relationship to duration of illness. Schizophr Bull. 2010;36:766–77.
5. Chakos MH, Lieberman JA, Alvir J, Bilder R, Ashtari M. Caudate nuclei volumes in schizophrenic patients treated with typical antipsychotics or clozapine. Lancet. 1995;345:456–7.
6. Ebdrup BH, Skimminge A, Rasmussen H, Aggernaes B, Oranje B, Lublin H, Baare W, Glenthoj B. Progressive striatal and hippocampal volume loss in initially antipsychotic-naive, first-episode schizophrenia patients treated with quetiapine: relationship to dose and symptoms. Int J
Neuropsychopharmacol. 2011;14:69–82.
7. Lieberman JA, Tollefson GD, Charles C, Zipursky R, Sharma T, Kahn RS, Keefe RS, Green AI, Gur RE, McEvoy J, Perkins D, Hamer RM, Gu H, Tohen M. Antipsychotic drug effects on brain morphology in first-episode psychosis. Arch Gen Psychiatry. 2005;62:361–70.
8. Lang DJ, Kopala LC, Vandorpe RA, Rui Q, Smith GN, Goghari VM, Lapointe JS, Honer WG. Reduced basal ganglia volumes after switching to olanzapine in chronically treated patients with schizophrenia. Am J Psychiatry. 2004;161:1829–36.
9. Pettersson-Yeo W, Allen P, Benetti S, McGuire P, Mechelli A. Dysconnectivity in schizophrenia: where are we now? Neurosci Biobehav Rev.
2011;35:1110–24.
10. Stephan KE, Friston KJ, Frith CD. Dysconnection in schizophrenia: from abnormal synaptic plasticity to failures of self-monitoring. Schizophr Bull. 2009;35:509–27.
11. Friston KJ, Frith CD. Schizophrenia: a disconnection syndrome. Clin Neurosci. 1995;3:89–97.
12. Zhou Y, Liang M, Tian L, Wang K, Hao Y, Liu H, Liu Z, Jiang T. Functional disintegration in paranoid schizophrenia using resting-state fMRI. Schizophr Res. 2007;97:194–205.
13. Whitfield-Gabrieli S, Thermenos HW, Milanovic S, Tsuang MT, Faraone SV, McCarley RW, Shenton ME, Green AI, Nieto-Castanon A, LaViolette P, Wojcik J, Gabrieli JD, Seidman LJ. Hyperactivity and hyperconnectivity of the default network in schizophrenia and in first-degree relatives of persons with schizophrenia. Proc Natl Acad Sci U S A. 2009;106:1279–84. 14. Liu F, Zhuo C, Yu C. Altered cerebral blood flow covariance network in
schizophrenia. Front Neurosci. 2016;10:308.
15. Yu R, Hsieh MH, Wang HL, Liu CM, Liu CC, Hwang TJ, Chien YL, Hwu HG, Tseng WY. Frequency dependent alterations in regional homogeneity of baseline brain activity in schizophrenia. PLoS One. 2013;8:e57516. 16. Turner JA, Damaraju E, van Erp TG, Mathalon DH, Ford JM, Voyvodic J,
Mueller BA, Belger A, Bustillo J, McEwen S, Potkin SG, Fbirn, Calhoun VD. A multi-site resting state fMRI study on the amplitude of low frequency fluctuations in schizophrenia. Front Neurosci. 2013;7:137.
17. Ren W, Lui S, Deng W, Li F, Li M, Huang X, Wang Y, Li T, Sweeney JA, Gong Q. Anatomical and functional brain abnormalities in drug-naive first-episode schizophrenia. Am J Psychiatry. 2013;170:1308–16.
18. He Z, Deng W, Li M, Chen Z, Jiang L, Wang Q, Huang C, Collier DA, Gong Q, Ma X, Zhang N, Li T. Aberrant intrinsic brain activity and cognitive deficit in first-episode treatment-naive patients with schizophrenia. Psychol Med. 2013;43:769–80.
23. Tomasi D, Volkow ND. Functional connectivity density mapping. Proc Natl Acad Sci U S A. 2010;107:9885–90.
24. Tomasi D, Volkow ND. Functional connectivity hubs in the human brain. NeuroImage. 2011;57:908–17.
25. Tomasi D, Volkow ND. Association between functional connectivity hubs and brain networks. Cereb Cortex. 2011;21:2003–13.
26. Tomasi D, Volkow ND. Mapping small-world properties through development in the human brain: disruption in schizophrenia. PLoS One. 2014;9:e96176.
27. Zhuo C, Zhu J, Qin W, Qu H, Ma X, Tian H, Xu Q, Yu C. Functional connectivity density alterations in schizophrenia.Front. Behav Neurosci. 2014;8:404.
28. Liu F, Zhu C, Wang Y, Guo W, Li M, Wang W, Long Z, Meng Y, Cui Q, Zeng L, Gong Q, Zhang W, Chen H. Disrupted cortical hubs in functional brain networks in social anxiety disorder. Clin Neurophysiol. 2015;126:1711–6. 29. Gong Q, Lui S, Sweeney JA. A selective review of cerebral abnormalities in
patients with first-episode schizophrenia before and after treatment. Am J Psychiatry. 2016;173:232–43.
30. Guo W, Liu F, Xiao C, Zhang Z, Yu M, Liu J, Liu G, Zhao J. Dissociation of anatomical and functional alterations of the default-mode network in first-episode, drug-naive schizophrenia. Clin Neurophysiol. 2015;126:2276–81. 31. Jiang T, Zhou Y, Liu B, Liu Y, Song M. Brainnetome-wide association studies in schizophrenia: the advances and future. Neurosci Biobehav Rev. 2013;37:2818–35.
32. Shepherd AM, Laurens KR, Matheson SL, Carr VJ, Green MJ. Systematic meta-review and quality assessment of the structural brain alterations in schizophrenia. Neurosci Biobehav Rev. 2012;36:1342–56.
33. Walterfang M, Wood SJ, Velakoulis D, Pantelis C. Neuropathological, neurogenetic and neuroimaging evidence for white matter pathology in schizophrenia. Neurosci Biobehav Rev. 2006;30:918–48.
34. Power JD, Barnes KA, Snyder AZ, Schlaggar BL, Petersen SE. Spurious but systematic correlations in functional connectivity MRI networks arise from subject motion. Neuroimage. 2012;59:2142–54.
35. Liu F, Guo W, Liu L, Long Z, Ma C, Xue Z, Wang Y, Li J, Hu M, Zhang J, Du H, Zeng L, Liu Z, Wooderson Sarah C, Tan C, Zhao J, Chen H. Abnormal amplitude low-frequency oscillations in medication-naive, first-episode patients with major depressive disorder: A resting-state fMRI study. J Affect Disorders. 2013;146:401–6.
36. Liu F, Guo W, Fouche J-P, Wang Y, Wang W, Ding J, Zeng L, Qiu C, Gong Q, Zhang W, Chen H. Multivariate classification of social anxiety disorder using whole brain functional connectivity. Brain Struct Funct. 2015;220:101–15. 37. Liu Feng, Wang Yifeng, Li Meiling, Wang Wenqin, Li Rong, Zhang Zhiqiang,
Lu Guangming, Chen Huafu. Dynamic Functional Network Connectivity in Idiopathic Generalized Epilepsy with Generalized Tonic–Clonic Seizure. Hum Brain Mapp 2017, in press, doi:10.1002/hbm.23430.
38. Shokri-Kojori E, Tomasi D, Wiers CE, Wang GJ, Volkow ND. Alcohol affects brain functional connectivity and its coupling with behavior: greater effects in male heavy drinkers. Mol Psychiatry. 2016;29 [Epub ahead of print]. 39. Tomasi D, Shokri-Kojori E, Volkow ND. High-resolution functional
connectivity density: hub locations, sensitivity, specificity, reproducibility, and reliability. Cereb Cortex. 2016;26:3249–59.
40. Tomasi D, Shokri-Kojori E, Volkow ND. Temporal changes in local functional connectivity density reflect the temporal variability of the amplitude of low frequency fluctuations in gray matter. PLoS One. 2016;11:e0154407. 41. Chen X, Duan M, Xie Q, Lai Y, Dong L, Cao W, Yao D, Luo C. Functional
disconnection between the visual cortex and the sensorimotor cortex suggests a potential mechanism for self-disorder in schizophrenia. Schizophr Res. 2015;166:151–7.
42. Hansen EC, Battaglia D, Spiegler A, Deco G, Jirsa VK. Functional connectivity dynamics: modeling the switching behavior of the resting state. Neuroimage. 2015;105:525–35.
• We accept pre-submission inquiries
• Our selector tool helps you to find the most relevant journal
• We provide round the clock customer support
• Convenient online submission
• Thorough peer review
• Inclusion in PubMed and all major indexing services
• Maximum visibility for your research
Submit your manuscript at www.biomedcentral.com/submit