2016 International Conference on Electronic Information Technology and Intellectualization (ICEITI 2016) ISBN: 978-1-60595-364-9
A Study on the Targeted Speed for HSR
Based on the Fuzzy Comprehensive
Evaluation Approach
Jiafeng Cao, Yushu Gong and Xiaoping Guang
ABSTRACT
Being the core index for the HSR train operation technology, the targeted High-Speed Railway (HSR) speed value characterizes the very importance for the design parameters of high-speed railway system. Taking such key characteristic factors that affect the targeted speed most as the running security, the operation time and the energy consumption into consideration, an AHP model has been established in this paper, with the targeted speed value as its target layer, and the economic efficiency, the social efficiency and the marketing efficiency as its criterion layer. The appropriate weighing value for each factor are determined hereby as well. Through the careful analysis of many cases, some valuable data for the operation time and the energy consumption of the CRH3 train are obtained by means of the simulation
under different targeted speed value. The final evaluation of the data are processed by using the fuzzy comprehensive evaluation method. As is shown in the analysis results, the most economically reasonable targeted speed value for the high-speed railway should be 300km/hin China at present.
INTRODUCTION
With its superior merits such as high efficiency, safety, comfort, convenience and so on, the High-speed railway has brought much infinite vitality to the old
_______________________
railway system, and has being innovated and upgraded all the way with the development of the times. By the end of 2015, the main framework with “Four Vertical Plus Four Horizontal Lines” had been set up for the high-speed railway basically. The total running mileage of 21000kms[1-3] marked a new era for the high-speed railway in China actually.
As the most important indicator for checking the technology level of the high- speed railway, the targeted high-speed- railway speed value is the prerequisite for the technical design and determining the various parameters[4]. To select the most appropriate targeted speed value, it should not only depend on the core technology itself, but also take the practical application, the economic efficiency and the rationality into consideration. Therefore, we can’t blindly pursue the highest targeted high-speed railway speed value. Instead, we should take the key benefits of economic, social and marketing efficiencies into account. Many famous scholars in our country had been working hard to study this, including Chen Bo, Zeng Jin, Peng Yutuo[5-6], who used the methods of the weighted sum to make decisions for multi-objectives, calculated and normalized each index weight, and made their best choices finally in accordance with the closeness under different targeted speed values. Ma Dawei[7] made his recommendations to the ideal targeted high-speed railway speed value in our country by analyzing and comparing the targeted high-speed train high-speed values in the different ways of wheel-rail and maglev, and then simulating the railway line of Beijing-Shanghai.
The above results of existing research have greatly enriched the theories of high speed railway targeted speed value, and could supply a plenty of references to the actual operation at the same time. Yet, there exist many problems as well. For example, it is quite difficult to quantize the index in weighted sum method; the weight coefficients still depend on the subjective feeling of experts and other issues, and so on. Based on the above understandings, this paper introduces the analytic hierarchy process (AHP) combined with the fuzzy comprehensive evaluation method so as to study the high speed railway targeted speed value, establishes a hierarchical model to determine the weight of each index objectively combined with the fuzzy comprehensive evaluation method, calculates the approximate degrees of the targeted speed value under different schemes, and thus ensures that the selection of the high-speed railway targeted speed value can be most scientific and rational in China.
ESTABLISHMENT OF THE TARGETED SPEED VALUE EVALUATION MODEL
Establishment of A Hierarchical Model
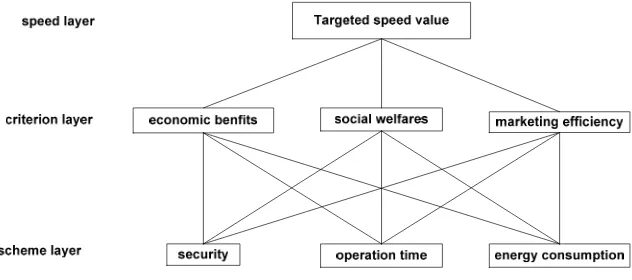
achieve the maximum comprehensive benefits. The different targeted speed values could have the key impacts on the economic benefits, the social welfares and the marketing efficiency definitely. Accordingly, a hierarchical model is established hereby for the targeted value of speed layer, to set the economic, social and market efficiency as the criterion layer; the security, the operation time and the energy consumption as the scheme layer, which is shown in Figure 1.
Figure 1. Hierarchical Model.
Construction of The Pair Wise Comparison Matrix
Firstly, for the three factors of the criteria layer, the economic, the social and the marketing efficiency, the matrix can be obtained by pair wise comparison:
33 32 31
23 22 21
13 12 11 3
3 ) (
a a a
a a a
a a a a
A ij (1)
The Geometric mean of each row vector in A, a row vector after normalizing the weight vector is obtained, the formula is that:
3 , 2 , 1 , ) ( )
(
1
1 1 1
1
i a a
w
n
k
n n
j kj n
n
j ij i
(2)
Then calculate the consistency index 1
n n CI
, refer to random consistency
index RI, finally calculate the consistency ratio RI CI CR1
where B1 is the economic benefits, in pair of importance of the high-speed railway safety, operation time, energy consumption compared with pair wise comparison matrix, similarly obtained matrix B2,B3. Obtained the weight vector of each matrix by using the geometric meanbj(j=1,2,3), then calculate the consistency indexCIj
(j=1,2,3),refer to random consistency index RIj (j=1,2,3), finally calculate the
consistency ratioCRj(j=1,2,3), similarly test each matrix’s consistency.
Calculation of The Combined Weight Vector
Consistently check the total sort value.
3 1 j j jCI w CI ,
3 1 j j jRI w RI, so
the consistency ratio is
3 1 3 1 2 / j j j j
jCI RI
w CR
, when the combination of consistency ratio to beCRCR1CR20.10; assume the hierarchy total sorts with satisfactory consistency. Finally, calculate combination weight vector
) n 1,2..., i | ( ) 3 ( i w
w ( 1 | 1,2,..., ).
n i w b n j j ij
CONSTRUCTION OF THE FUZZY COMPREHENSIVE EVALUATION MODEL
Using Fuzzy method[9] to establish the basic mathematical model, there will be m targets for multi-objective decision making problems
T
{
t
1,
t
2,...
t
m}
; first determine the respective target weight by Analytic Hierarchy Process
} ,... ,
{w1 w2 wn
w ,based on this hypothesis to solve the problem of n schemes
}
,...s
s
,
{s
1 2 n
S
, the decision aims at finding the optimal solutions
i.The matrix which includes Set T and S is called a multi-objective Cartesian product set [10].The elements which combine T and S refer to utility index value f, the matrix F of the utility index value is that:
mn m m n n n m f f f f f f f f f F 2 1 2 22 12 1 21 11
(3)
The membership
r
ij of the utility index is calculated as:ilow itop ij itop ij f f f f r
In the formula,
f
itop andf
ilow respectively represent the maximum and theminimum utility index matrix F decision objectives;
f
ijis the utility index value of each scheme.
Represents the membership matrix:
r r rn
R 1, 2,..., (5) According to the principle of maximum degree of membership, the excellence scheme is that:
TG 1,1,...,1 (6)
To calculate the closeness under different schemes
n
i
ij j i
jG w g f
R N
1
) ( 1
) (
, The scheme which has the maximum closeness is the best.
4 DETERMINATION OF THE AFFECTING FACTORS OF THE TARGETED SPEED VALUE
Security
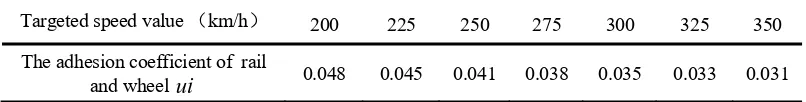
The security issue for the high-speed rail must be the fundamental prerequisite for its further development. All these factors, including the improvement of the high speed railway targeted speed value level, the reduced friction between the rail and the wheel, the decreased adhesion coefficient between rail and wheel, the larger roadbed sinks, and so on, will have great impacts on the safety operation of the high-speed rail. Because of the strong traction force of the high-high-speed train unit, together with its lighter axle load, the adhesion coefficient among the rail and the wheel
ui
could decrease more prominently with the improvement of the train speed. Thus, the safety pressure under different levels of targeted speed value of high-speed railway can be reflected by the rail and wheel adhesion coefficient more accurately. To date, since no exact formula can show the relationship between rail and wheel adhesion coefficient and speed of high-speed train exactly, we make use of the empirical formulas of the Japanese Shinkansen trains to indicate it:) 85 ( / 6 .
13
v
ui (7)
the CRH3 train set as an example to commence the research work. According to the formula (7), calculate the wheel adhesion coefficient under different targeted speed value level of CRH3 train set, values as shown in table I.
TABLE I. THE WHEEL ADHESION COEFFCIENT OF CRH3 TARINSET UNDER
DIFFERENT SPEED TARGET VALUES.
Operation Time
The operation process for the High-speed train covers traction, uniform, inertia and braking processes, affected jointly by the traction force, the braking force and the resistance force. The braking force is generated by all the electrical braking of high-speed train, while the CRH3 train set in straight track resistance characteristic curve is a quadratic function with respect to the speed of v[11].
Take the train traction as an example. Assume that the train runs in straight track, ignore the speed limit, the resultant acceleration for the train is that:
c bv av
dt
dv 2 (8)
Assume the initial speed, final speed of the train, obtain the uptime by integrating:
dv c bv av
v v
t v
vs
s
2 1
) ,
( (9)
When 4 2 0 b ac
q , t
k(v) k(vs)
/aq(10) Among them:2
/4a q
q
(11)
( /2 )/ q
tan)
( 1
a b v v
k (12)
When 4 20 b ac
q ,t
kr(v)kr(vs)
/a (13) Among them:2
/4a q
(14)
Targeted speed value (km/h) 200 225 250 275 300 325 350
The adhesion coefficient of rail
1 )/ b/2 (
: } )/ b/2 {(
coth
1 )/ b/2 (
: } )/ b/2 {(
tanh )
( 1
1
a v
a v
a v
a v
v
kr (15)
When 4 2 0 b ac
q ,t (v vs)/{a(v b/2a)(vsb/2a)}(16) The operation time t1could be obtained by formula (8) to (16) at the train traction condition, from the initial speed to the final speed. In the same way, the operation time 3t and 4t could be obtained at inertia and braking process condition; the operation time 2t is for uniform condition, so T t1t2t3t4.
Energy Consumption
The High-Speed Trains use electric locomotive as the traction power. For the electric locomotives, the energy consumption is based on the consumption of locomotive electric currents. The electric locomotive power consumptionQis generally the sum of two parts: tractionQyand braking operation power consumption
plus the stopping power consumptionQ0[12-15]. The formula ofQyis that:
0 Q Q
Q y (17)
( )6000 ) (
kWh t I
I U
Qy w
p po
(18)
In the formula:Uwrepresents the net pressure at the pantograph, the value is
usually 25000V;
I
prepresents the average active current, the unit is A; specific datacould be isolated by the electric locomotive traction calculated table or graph active current;
I
porepresents the self-power active current, the unit to be A;trepresentsthe time of traction condition, the unit is min. The formula of Q0is that:
) ( 6000
1
0 U I t kWh
Q
m
j j po
w
(19)
In the formula:Uwalso represents the net pressure at the pantograph, the unit is
V;
I
porepresents own power active current, the unit is A; when it is inert, air brake, poI
usually takes 2A; when resistor braking, the more axes lead to the greater value,usually 6-axle locomotive takes 10A, 8-axle locomotive takes 13A;
t
represents thecorresponding time of the condition, the unit is min.
traction of the train at a certain speed; then check the power current and the inert power by means of the above current curves; finally, calculate the overall energy consumption of the high-speed trains by combining the pantograph at the net pressure, traction rate, weight and any other data. Since this method is on the basis of a large number of calculated data, the error possibilities is very big. Therefore, it is common to use the software to simulate the situation while calculating the energy consumption practically.
ANALYSIS OF THE EXAMPLE
Suppose a high-speed railway link 485kms, using CRH3 train set, along with
eight railway stations. There are seven schemes of targeted speed values: 200km/h, 225km/h, 250km/h, 275km/h, 300km/h, 325km/h, 350km/h respectively.
Establish a hierarchical model to determine the index weight; obtain economic, social and market efficiency with pair wise comparison matrix:
1 1 4 1 1 1 3 1 4 3 1
A (20)
Geometric mean of each row vector in A, a row vector after normalizing the weight vector is: w
0.633 0.193 0.174
T , then calculate theconsistency index 3 1 0.005 3
009 . 3
1
n n CI
, refer to random consistency index RI, we know that RI 0.58 ; finally calculate the consistency ratio
1 . 0 0086 . 0 58 . 0 005 . 0
1
RI CI CR
, through the consistent check. Construct the pair wise comparison matrix B1,B2,B3 :
1 2 1 2 1 1 3 1 1 3 1 1 B 1 2 1 2 1 2 1 1 2 1 1 2 B 1 3 1 2 1 3 1 3 2 3 1 1 3
B (21)
In the same way, get three matrix weight vectorb1
0.443 0.169 0.388
T ,
Tb2 0.4 0.4 0.2 ,b3
0.249 0.594 0.157
T,CI1 0.011 ,CI 2 0,CI 30.027 ,calculate these three matrix values, the results are both less than 0.1; so the three matrices all through the consistency check. Finally consistency check the total sort
value 0.633 0.011 0.193 0 0.174 0.027 0.0117
58 . 0
3 1
j j jRI
w RI
, so the consistency ratio is,
0202 . 0 /
3
1
2
RI CI w CR
j
j j
,
the combination of consistency ratio is CR =CR 1+CR 2 =0.0288 < 0.1
, therefore we can say that the overall level of satisfaction with a sort of consistency. Finally calculate combination weight vectorw(3)
0.401 0.288 0.311
T, the security weights w10.401,operation time weightsw20.288, energy consumption weights311 . 0
3
w .
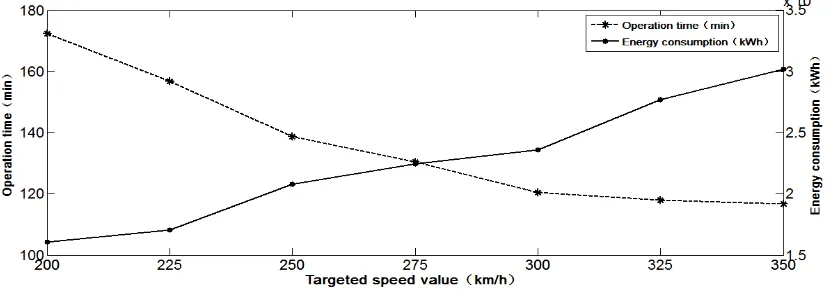
Combine with the actual line type data and CRH3 train set performance, use Mat
[image:9.612.103.519.310.456.2]lab to simulate, obtain at different speed target program trains operation time and energy consumption curve fitting as shown in Figure 2.
Figure 2. Each scheme’s operation time and energy consumption simulation curve fitting.
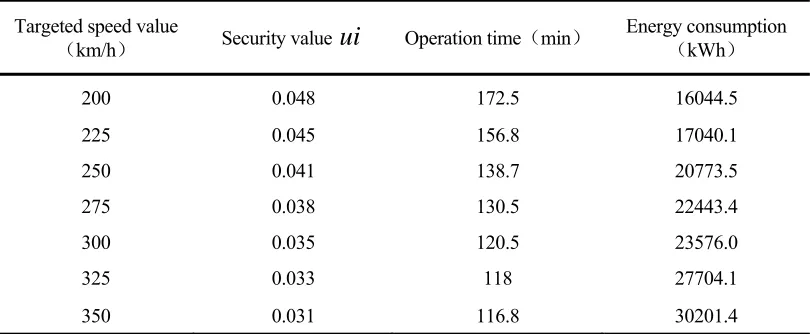
TABLE II. THE SECURITY VALUE
ui
, OPERATION TIME AND ENERGY CONSUMPTION UNDER EACH SCHEME.Targeted speed value
(km/h) Security value
ui
Operation time(min)Energy consumption
(kWh)
200 0.048 172.5 16044.5 225 0.045 156.8 17040.1 250 0.041 138.7 20773.5 275 0.038 130.5 22443.4 300 0.035 120.5 23576.0 325 0.033 118 27704.1 350 0.031 116.8 30201.4
According to the Fuzzy comprehensive evaluation model, firstly calculate the matrix F of the utility index value under seven schemes:
4 . 30201 1 . 27704 0 . 23576 4 . 22443 5 . 20773 1 . 17040 5 . 16044 8 . 116 118 5 . 120 5 . 130 7 . 138 8 . 156 5 . 172 031 . 0 033 . 0 035 . 0 038 . 0 041 . 0 045 . 0 048 . 0
F (22)
Then calculate the membership matrix R:
0 1764 . 0 4680 . 0 5480 . 0 6660 . 0 9297 . 0 1 1 9776 . 0 9408 . 0 7614 . 0 6072 . 0 2807 . 0 0 1 8824 . 0 7647 . 0 5882 . 0 4118 . 0 1765 . 0 0
R (23)
Combining weight of the security weight, operation time weight, energy consumption weight is w(3)
0.401 0.288 0.311
T ; finally we can calculate the closeness under different speed target values schemes:311 . 0 ) ( ) ( ) (
1 1 1 11 2 1 21 3 1 31 1 w g r w g r w g r
N by the same way
4402 . 0
2
N ,N30.5473,N40.6260,N50.7238,N60.6911,N70.689.From the
above calculating results,N 5has the biggest closeness, so the most economical and reasonable speed target value of China high-speed railway is 300km/h.
CONCLUSIONS
study listed above, the high-speed railway targeted speed value could be summarized as follows:
(1) Considering comprehensively the main factors for the high-speed railway ,including the train safety, the operation time and the energy consumption, it is effective to analyze the qualitative indexes and quantitative indexes by using the analytic hierarchy process (AHP), combined with fuzzy comprehensive evaluation method.
(2) By using the simulation test to implement the results of theoretical analysis, it proved that it will be most economic and reasonable to adopt the targeted speed of 300 km/h for the high-speed railway. From the technical and safety point of view, it can speed up to 350km/h or even higher in the future.
(3) The above conclusion is based on a large scale of comprehensive evaluation. The actual selection of the high-speed railway targeted speed value should take a lot more factors into consideration, such as the construction costs, the administration supports, the operation state, the environmental protection and so on, so as to achieve the maximization of comprehensive benefits.
(4) As it is likely to see the continuous development of science and technology in the future, it would be wise to determine the appropriate targeted speed value for the high-speed railway by commencing some precise analysis together with the actual study of the latest technical conditions in the future.
ACKNOWLEDGEMENTS
The authors are grateful to the anonymous referees for their precious comments and appreciate the support of National Social Science Foundation of China [grant numbers 15BJY037]during the research.
REFERENCES
1. Bangcheng Sun. The present technology situation and the research direction of high-speed trainset [R]. Tangshan: Tangshan Railway Vehicles Co., Ltd. 2013. In Chinese.
2. Railway Network Plan[EB/OL].http://baike.baidu.comview3119844.htm.
3. Ming Gong. The trends report of high-speed train vehicle technology and industry development [R]. Qingdao: CRRC Qingdao Sifang Co., Ltd. 2014. In Chinese.
4. Bo Chen. Fuzzy comprehensive evaluation of high-speed railway speed target value. Railway Engineering, 2006, (10). In Chinese.
5. BoChen, JinZeng. The application of fuzzy comprehensive evaluation method in high-speed railway speed target value optimization [J]. Railway Transport and Economy, 2015, (07). In Chinese.
6. YutuoPeng. Railway Transport and Economy, 2012, (02). In Chinese.
7. Dawei Ma. High-speed trains and its targeted Speed [J]. China Railway Science, 2003, (10). In Chinese.
8. Yinzhen Li. Operational Reserch of Management [M]. Beijing: Science Press, 2012. In Chinese. 9. Liyan Han, Peizhuang Wang. Application of fuzzy mathematics [M]. Beijing: Capital University
10. Zhongxiong He. Fuzzy mathematics and its application [M]. Tianjin: Tianjin Science Press, 1983. In Chinese.
11. Jianqiang Liu. Methods for controlling high-speed train energy-saving operation optimization [J]. Journal of the China Railway Society, 2014, (10). In Chinese.
12. Baohua Mao. Transportation performance calculation and design [M]. Beijing: China Communications Press, 2013. In Chinese.
13. Baohua Mao. A general-purposed simulation system on train movement [J]. Journal of the China Railway society, 2009, (10). In Chinese.
14. EC. MEET. Methodology for calculating transport emissions and energy consumption [R]. Luxemburg: European commission,1999.