© 2017, IRJET | Impact Factor value: 5.181 | ISO 9001:2008 Certified Journal | Page 2567
Web Service Recommendation using Collaborative Filtering
Sabanaz S. Peerzade
Department of Computer Science and Engineering
ATS’s SBGI, Miraj India
Shivaji University
---***---Abstract - With the increasing amount of web services on the Internet, web service selection and recommendation are becoming more and more important. This paper finds the list of optimal web service to target user by his history. For finding list of optimal web services we use two methodologies i.e. Pearson Correlation Coefficient based Collaborative Filtering (PCC) and Normal Recovery Collaborative Filtering methodology. PCC and NRCF uses similarity measure algorithm for web service similarity computation. Compared with existing methods, the proposed system has three new features: 1) the new clustering techniques; and 2) In NRCF technique, NRCF prediction uses algorithm of PCC prediction technique.
Key Words: Service recommendation, collaborative filtering, recommender system, QoS, Similarity Measure.
1. INTRODUCTION
Web services are units of software functionalities (e.g., retrieving currency exchange rates) delivered over the Internet for users to create composite Web applications [1]. A recent advance research in cloud computing gives on-demand service delivery and increases the rapid growth of service markets, where more and more Web services are expected to become available. While the large number of Web services meets the various needs of different users, it also presents important challenges in selecting among a large number of similar web services [2]. In this context, Web service recommendation [3], [4], [5], [6] aims to help users quickly find desirable services, a hot research issue in the area of service computing in recent years. Effective web service recommendation is to be fulfilling both functional and non-functional requirements of users. While functional requirements based on what a service does, nonfunctional requirements related to the quality of service (QoS), such as round-trip time (RTT), response time, throughput, and failure probability, etc. QoS gives an important role in Web service recommendation, according to those similar services can be ranked and selected for users.
2. RECOMMENDATION SYSTEM
Web services recommendation is the process of automatically identifying the usefulness of services and proactively discovering and recommending services to end users. Effective service recommendation needs to fulfill both functional and non-functional requirements of users. QoS
plays an important role in Web service recommendation, according to which similar web services can be ranked and selected for users. Service invocations usually depend on the Internet for connectivity and are heavily influenced by the dynamic network conditions. Therefore, users at different locations observe different QoS values for the same Web service.
2.1 Types of Recommendation System
The current generation of recommendation methods can be broadly classified into the following five categories, based on the knowledge sources they use to make recommendations:
2.1.1 Content-based Recommendation
Content-based systems recommended items to the user similar to the ones he or she preferred in the past. Content-based Systems are designed mostly to recommend text-based items.
2.1.2 Collaborative Recommendation
Collaborative filtering is technique used in almost all recommendation system. Collaborative filtering predicates the utilities of item or web services for a particular user, for the same set of web services given by many other users.
2.1.3 Context-Aware Recommendation
Context is a multifaceted concept that has been studied across different research disciplines, including computer science (primarily in artificial intelligence and ubiquitous computing), cognitive science, linguistics, philosophy, psychology, and organizational sciences.
2.1.4 Knowledge-based Recommendation
© 2017, IRJET | Impact Factor value: 5.181 | ISO 9001:2008 Certified Journal | Page 2568 2.1.5 Demographic-based Recommendation
Categorizes the user based on personal attributes and makes recommendations based on demographic classes, e.g. college students, teenagers, women, men, etc. The advantages and disadvantages of this system are similar to those of Knowledge-based Recommendation Systems.
2.1.6 Hybrid Recommendation Systems
All the above mentioned systems have complementary strengths and weaknesses. A Hybrid recommendation system combines two or more recommendation techniques to gain better system optimization and fewer of the weaknesses of any individual ones.
3. COLLABORATIVE FILTERING
The process of identifying similar users and similar web services and recommending what similar users like is called collaborative filtering. The collaborative filtering suggested the web services to the user, on the basis of past web service history. A user can hardly invoked all services, meaning that the QoS (round-trip time i.e. RTT) values of services that the user has not invoked are unknown. Hence, providing accurate Web service QoS prediction is very important for service users.
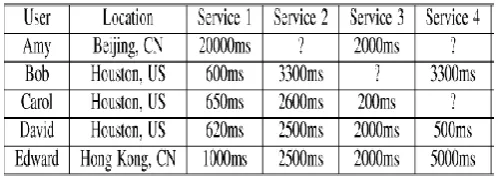
[image:2.595.37.288.512.602.2]Table 1 shows a simple example. The numerical values in the table correspond to the response time for users to invoke the indicated service. Question Mark (i.e.?) means that the user has not invoked this service.
Table 1: User-Item Matrix with Round-trip time (RTT)
3.1 Similarity Measures
There are two types of similarity measures, i.e., the functional similarity measure and the nonfunctional similarity measure. Input/output/operation names are usually employed to measure the functional similarity between two web services. In this paper, instead of the functional similarity, focus is on the nonfunctional similarity (QoS similarity).
Given a data set consisting of M service users and N Web services, the invocation records between users and services can be denoted by an M × N matrix, which is called a user–
service matrix. An entry in this matrix rm,n represents a record of invocation (QoS values, e.g., response time and availability), as shown in Table 1. Similarity mainly divided into two type user-based and Item-based similarity Measures.
3.1.1 PCC
Pearson correlation coefficient [9] was introduced in a number of recommender systems for similarity computation, since it can be easily implemented and can achieve high accuracy.
a. User-based Similarity Measures
In user-based similarity measures, the PCC can be employed to measure the similarity between two user u and v by
where is the set of web services co-invoked by users u and v, ru,i is the QoS value of item i observed by user u. Similarly rv,i is the QoS value of item i observed by user v and denotes the average value of user u on item in I. From the above equation, values of the PCC are in the interval of -1 and 1.
b. Item-based Similarity Measures
The PCC can also be employed to measure the similarity between two web services i and j by
Where is the set of users who invoked both web services i and j, is the QoS value of web service i observed by user u, and denotes the average value of web service i observed by users in U. Similarly is the QoS value of web service j observed by user u, and denotes the average value of web service j observed by users in U. Values of the PCC are in the interval of -1 and 1.
3.1.2 NRCF
© 2017, IRJET | Impact Factor value: 5.181 | ISO 9001:2008 Certified Journal | Page 2569 new similarity measure methodology named normal
recovery (NR) collaborative filtering. NRCF methodology first normalizes the user QoS values to the same range, and then unifies similarity of the scaled user vectors (or item vectors) in different multidimensional vector spaces. NRCF has been introduced for computing similarity between users or items (web services) according to the user-item value shown in Table 1, which is usually called user-item matrix and prediction of unknown QoS value according to the similarity of users and items.
a. User-based Similarity Measure
In user-based similarity measures, the NRCF can be employed to measure the similarity between two user u and v by
Where is the set of web services co-invoked by users u and v, is the number of I, is the value of item i from user u in the original user-item matrix P, and denote the lowest and the highest values from user u in P, respectively, and and denote the lowest and the highest values from user v in P, respectively. In (3), Sim (u, v) ∈ [0, 1], where Sim (u, v) = 0 represents that two users are dissimilar and Sim (u, v) = 1 indicates that two users are the same. While values of the PCC are in the interval of -1 and 1.
b. Item-based Similarity Measures
To calculate the similarity between two web services, similarly, based on normalizing the items’ QoS values, Propose system map the original user-item matrix P into the column-normal user-item matrix , where each column is in the range of [0, 1]. The formula of NRCF to measure the similarity between two items i and j is as follows:
where is the set of users who invoked both items i and j, is the number of U, is the value of item i from user u in the original matrix P, and , , , and denote the lowest value of item i, the highest value of item i, the lowest value of item j, and the highest value of item j in the original matrix P, respectively.
3.2 Clustering Algorithm
Clustering algorithm choose a set of similar item or set of similar users (neighbor) for target users The process of selecting similar item for similar users is crucial for the accuracy of prediction because the prediction of the unknown value depends on the corresponding values of similar users. Propose system uses clustering methodology. Clustering is of two type user-based clustering [7] and item-based clustering.
3.2.1 User-based clustering
User-based clustering is process of finding similar neighbor and makes cluster of it. Each user having its own user cluster and this cluster are used for finding unknown QoS values for that respective user. Proposed System uses the hybrid Top-k Algorithm [9] for used User-based clustering. User-based Clustering algorithm uses user-based similarity values.
The algorithm of user-based clustering is as follows:
Algorithm 1 User-based Clustering Algorithm
Input:
u: Target user T(u): set of other user
I: Similarity threshold K: Number of similar neighbor to be Selected
Output: S (u): Cluster of Items for user u. 1: int Nsim=0
2. for all such that ∈ T(u) do
3. Nsim++ 4. end for
5. if Nsim≥K then
6. S (u) ← Top-K user 7. else if 0< Nsim<K then
8. S(u)← Top Nsim items 9. else if Nsim=0 then
10. S(u)←0 11. end if
3.2.2 Item-based Clustering
© 2017, IRJET | Impact Factor value: 5.181 | ISO 9001:2008 Certified Journal | Page 2570 As shown in Algorithm 2, there are three threshold values
are used. First value is I, which used as item similarity, which is lower limit of the qualified similar item. Second value is user similarity measure threshold, which is lower limit of qualified users. Third threshold is limiting of number of users accessed web service i.
3.3 Prediction Algorithm
The most important step in a propose PCC collaborative filtering system is to generate the output interface in term of prediction. Once similarity is calculated and cluster is created, the next step is to look into target RTT and use a technique to obtain predictions. There are three types of prediction that are user-based prediction, Item-based prediction and hybrid prediction. User-based prediction uses on user-based similarity measures value and user-based cluster information. Item-based prediction uses item-based similarity and Item-cluster information. Finally Hybrid prediction uses both user-based and item-based similarity and clustering information
The proposed system uses both user-based prediction methodology and item-based prediction methodology.
Algorithm 2 Item-based Clustering Algorithm
Input:
u : Target user T(i): set of web services used by target user u T(j): set of other user's web services T(v): set of other users I: Item Similarity threshold U: user similarity threshold UI: Number of users those used web service i threshold K : Number of similar items selected
Output: S (u): Cluster of Items for user u. 1: int Nsim=0
2. for all i such that i∈ T(i) do
3. count users those access service i into C
4: for all j such that j∈ T (j) and sim(i,j) ≥ I and C ≥ UI
do
5. Nsim++ 6. end for
7. end for
8. if Nsim≥K then
9. for all v such that v∈ T (v) and sim(u,v)≥U do
10. S (u) ← Web services of v 11. end for
12. else if 0< Nsim<K then
13. S(u)← Top Nsim items 14. else if Nsim=0 then
15. S(u)←0 16. end if
3.3.1 User-based Prediction
User-based PCC prediction methods use similar users to predict the missing value (QoS values) for the active users by employing the following equation:
Where is the vector of average QoS values different Web services observed by the active user u, and is the vector of average QoS value of different Web services observed by the similar service user .
3.3.2 Item-based-Prediction
PCC Item-based value prediction for finding missing value by employing following equation:
Where denotes the prediction QoS value about the actual user u to service i. and are the vector of average QoS values of the current service i or the similar service k respectively. S(u) denotes the cluster of similar neighbor of services I for user u.
To make use of the information from both similar users and similar items, a parameter λ(0 ≤ λ ≤ 1 )is employed to determine how much does the prediction rely on user-based PCC (4.3) or item-based PCC(4.4). Propose PCC approach makes prediction by employing the following equation:
+(1-λ)*
© 2017, IRJET | Impact Factor value: 5.181 | ISO 9001:2008 Certified Journal | Page 2571 Table 2: MAE Performance Comparison (Smaller Value Mean Better Performance)
λ 0.1 0.2 0.3 0.4 0.5 0.6 0.7 0.8 0.9 1
NRCF 0.3484 0.3473 0.3495 0.3601 0.3699 0.3807 0.3807 0.3936 0.4088 0.4278
PNRCF 0.4014 0.3867 0.3720 0.3572 0.3425 0.3277 0.3130 0.2982 0.2835 0.2688
3.4 Recommendation
The predicted QoS values via propose NRCF methodology can be employed for the web service recommendation and selection. When the target web services are functionally equivalent, the one with the best predicted QoS performance can be recommended to the current user. By this way, web service selection can be achieved without conducting the expensive and time consuming real-world web service invocations. When the target web services have different functionalities, our NRCF approach can help make QoS performance prediction of the unused web services for the current users and recommend the good performing ones to the users. Recommendation is performs on the basis of based similarity measures, based clustering and item-based prediction because dataset used in current system having more web services than user. The predicted QoS values can be employed for the Web service recommendation and selection by the following ways [8]:
1) For functionally equivalent Web services, the one with best predicted QoS performance can be recommended to the active user. 2) Web service recommendation can recommend the top k best performing Web services, which may not have equivalent functionality, to the service users to help them discover the potential Web services
4. EXPERIMENT
This chapter describes the experimental evaluation of our proposed methodologies used in system.
4.1 Web Service QoS Data Set
Several standard datasets are available for experimental purposes. They are Planet Lab, WS-Dream. The propose system uses WS-Dream dataset. This is website which provides different dataset for research purpose.
4.2 Evaluation Metric
To evaluate the QoS value prediction accuracy, we use the well-known mean absolute error (MAE) metric. The MAE is the average absolute deviation of predictions to the ground truth values. The MAE is defined as:
Where denotes the actual RTT of web service i observed by user u, denotes the predicted RTT of web service i for user u, and N denotes the total number of predicted RTTs. Smaller MAE values indicate better prediction accuracy.
4.3 Performance Comparison of Similarity Measures
To show the effectiveness of our NRCF similarity measure (see (3) and (4)), we compare it with other similarity measures, i.e., PCC (see (1) and (2)), which have been introduced in chapter 4. Here NR means NRCF similarity measures. Table 2 shows the prediction accuracy of different similarity measures. From Table 2, we can see the following:
1. Our NR approach outperforms all the competing approaches consistently under different λ values.
2. The best MAE performances of existing NRCF and propose NRCF are 0.3473, and 0.2688, respectively.
Compared with existing NRCF, Propose NRCF approach significantly improves the prediction accuracy.
4.4 Impact of λ
© 2017, IRJET | Impact Factor value: 5.181 | ISO 9001:2008 Certified Journal | Page 2572
Chart -1. Impact of Lambda
5. Conclusion
In this study, Pearson Correlation Coefficient and Normal Recovery Collaborative Filtering methodology is developed for web service recommendation. Proposed NRCF is combination of NRCF similarity measures and PCC clustering and prediction. So that proposed NRCF approach investigates the characteristics of web service QoS values and propose a new similarity measure, which finds similar users (or web services) more accurately and leads to better QoS value prediction accuracy. By systematically fusing the information of similar users and similar web services, proposed NRCF approach can achieve better prediction accuracy. Experiments are conducted on real-world web service QoS data set. The experimental results show that our method significantly improves the QoS value prediction accuracy compared with PCC approach.
REFERENCES
[1] L.-J. Zhang, J. Zhang, and H. Cai, Services Computing: Core Enabling Technology of the Modern Services Industry.Tsinghua University Press, 2007.
[2] Klein, F. Ishikawa, and S. Honiden, “Towards network-aware service composition in the cloud,” in Proc. of the 21st ACM World Wide Web Conference (WWW), 2012, pp. 959–968.
[3] Z. Zheng, H. Ma, M. R. Lyu, and I. King, “Wsrec: A collaborative filtering based web service recommender system,” in Proc. of the IEEE International Conference on Web Services (ICWS), 2009, pp. 437–444.
[4] W. Zhang, H. Sun, X. Liu, and X. Guo, “Temporal qos-aware web service recommendation via non-negative tensor factorization,” in Proc. of the 23rd International World Wide Web Conference (WWW), 2014, pp. 585–596.] X. Chen, Z.
[5] Zheng, Q. Yu, and M. R. Lyu, “Web service recommendation via exploiting location and qos information,” IEEE Trans. Parallel Distrib. Syst., vol. 25, no. 7, pp. 1913–1924, 2014.
[6] R.M. Sreenath and M.P. Singh, “Agent-Based Service Selection,” J. Web Semantics, vol. 1, no. 3, pp. 261-279, 2003.
[7] Jian Wu, Member, IEEE, Liang Chen, Student Member, IEEE,” Predicting Quality of Service for Selection by Neighborhood-Based Collaborative Filtering”, IEEE Transactions On Systems, Man, And Cybernetics: Systems, Vol. 43, No. 2, March 2013