© 2018, IRJET | Impact Factor value: 6.171 | ISO 9001:2008 Certified Journal | Page 2081
EVALUATION OF WIND-PV GENERATION SYSTEM USING FUZZY
C-MEANS ALGORITHAM
Adavipalli Chandana
1, Chandini Mutta
2, B Srinivasa Rao
31,2 Assistant Professor, Dept. of EEE, SVCET,Srikakulam, Andhra Pradesh, India-532410
3PG Scholar, Dept. of EEE, SVCET,Srikakulam, Andhra Pradesh, India-532410
---***---Abstract -
Commitment of sustainable power sources in power frameworks is expanding because of nonstop development of wind and sunlight based generators. In light of irregularity and instability of these assets, customary unwavering quality assessment strategies are not material and diverse systems have been produced to display these generators. Be that as it may, the majority of these techniques are tedious or will be unable to keep time reliance and relationships between's inexhaustible assets and load. In this manner, this paper means to enhance the current techniques and proposes a quick and straightforward approach. In this approach, wind power, photovoltaic (PV) era, and power request have been demonstrated as time-ward groups, which can catch their time subordinate traits, as well as can keep the connections between's these informational collections. The created strategy is approved by contrasting outcomes and successive Monte Carlo system..Key Words: Wind Energy System, PV System, Monte Carlo Technique, Fuzzy C-Means and MPPT
1. INTRODUCTION
Increased penetration of renewable energy into power grid gave birth to several challenges those are experienced in integrating such sources amongst themselves as well as with the grid. Though the energy obtained from such sources is environment friendly, the power and voltage obtained from such sources varies randomly with the variation of weather. Furthermore, non-linear power converters, used for conditioning the outputs from such sources, distorts the waveform and hence degrades the quality of dispatched power thereby affecting sensitive loads connected to the grid. Exhaustion of fossil fuels, their hazardous effect on environment and an increasing power demand results in an increasing the penetration of renewable energy sources into the utility grid. Li-ion batteries though costly have higher power density and can withstand higher charging/discharging cycles than lead-acid batteries while NiMH batteries are costlier and have carcinogenic effects on the atmosphere in spite of having higher power density than Li-ion batteries.
LCPV collectors used in this work have a degree of concentration of 2.2 X which does not require any extra tracking mechanism and cooling arrangements for their cells. The use of such cells can improve solar power extraction efficiency to 20%-25% than flat plate collectors,
with the use of simple mirror reflection with good optical efficiency. Maximum power extraction is essential from both the LCPV and WECS for increasing system efficiency. Negative load multistate generator, and probabilistic distribution area unit a number of the planned models. Negative load models need written account techniques like consecutive Monte Carlo for dependability assessment. These techniques area unit effective in modeling wind and keeping correlation between wind and demand.
However, in depth analysis time is that the main disadvantage of this technique, particularly within the composite system studies wherever the transmission insufficiency ought to be thought-about within the dependability analysis additionally. Not like successive ways, multistate and probabilistic models area unit quick and time-efficient, however might not be ready to capture the written account nature and also the correlation between alternative energy, alternative energy, and demand knowledge. Though some studies given techniques to stay the connection between wind farms and cargo or perhaps wind, PV, and cargo knowledge, these ways can face difficulties in modeling and should become sophisticated once the quantity of wind farms or star generators will increase.
As an example, in wind farms and cargo knowledge area unit being sculptural as three-dimensional clusters to stay the correlations between them. However, this technique is effective for systems with little range of wind farms and by increasing them, the dimensions of the matrix can grow and calculation can become sophisticated. What is more, non-iterative techniques area unit quicker than written account techniques, however they need some drawbacks additionally.
2. PHOTOVOLTAIC ARRAY MODELING:
© 2018, IRJET | Impact Factor value: 6.171 | ISO 9001:2008 Certified Journal | Page 2082 represented in figure 1, whereas the often seen existence of
most electrical outlet on each yield is shown in power diagram 2.
I = Iph – ID -Ish (1)
[image:2.595.310.559.125.454.2]I=Iph –Io [exp (q V D / nKT)] – (vD/RS) (2)
Figure 1: PV Electrical Equivalent circuit
Solar cell output power is given as the product of V and I
Figure2: Response of output characteristics of PV Array
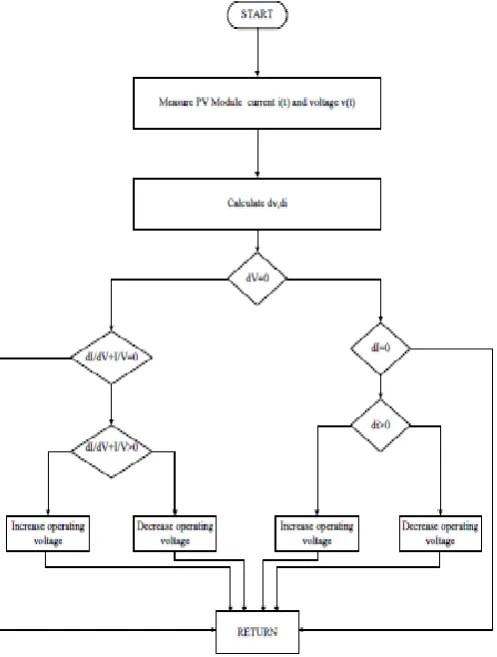
3. INC MPPT TECHNIQUE:
[image:2.595.65.265.129.280.2]In this technique the change of PV voltage can be obtained with respect to MPP voltage peak power. Figure 3 shows the PV power curve for incremental conductance method.
Figure 3. Characterestics of PV Power Vs Voltage under INC method
The relation for conductance in incremental and instantaneous can be expressed in three cases:
Figure 4: INC MPPT flow chart
The power expression,
P = V ∗ I
Differentiate the power equation with PV terminal voltage,
v
VI
v
p
(
)
At MPP,
0
v
p
The modified equation expressed as:
V
I
V
I
[image:2.595.62.264.579.733.2]© 2018, IRJET | Impact Factor value: 6.171 | ISO 9001:2008 Certified Journal | Page 2083 Wind Turbine
[image:3.595.40.294.180.301.2]Wind turbines square measure classified into two types: Horizontal and Vertical axis. A vertical axis machine has its blades rotating on AN axis perpendicular to the bottom. There square measure variety of obtainable styles for each and every kind has bound benefits and downsides.
Figure 5: Basic diagram of wind turbine
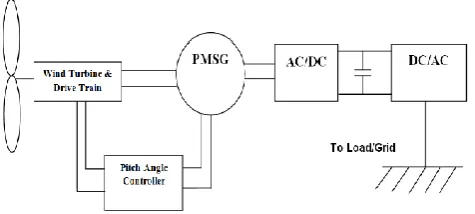
4. ARCHITECTURE OF PMSG
A synchronous machine is generally a rotating machine whose steady state speed is proportional to frequency of the armature current. The basic structure of the permanent magnet synchronous machine for wind system is shown in figure 6. Generally, PMSG 6 machines are two types such as cylindrical and salient rotor types. The operational modes of PMSM is decided by the sign of electro-mechanical torque (such as +Ve sign for motoring operation and –Ve sign represents generating condition). For modelling PMSM machine the electrical and mechanical parts are indicated in the form of state space analysis 7. In case of PMSM machine
[image:3.595.45.283.538.645.2]the stator flux produced by the permanent magnet is always sinusoidal.
Figure 6: Structure of Permanent Magnet Synchronous Machine in Wind Turbine
The control strategy for the PMSG machine is shown in figure 7. This control structure is designed by the help of d-q transformation technique 8-9. A general PI controller is used
in this paper for controlling unbalanced voltages.
Vdc*
Vdc
PI/Fuzzy/
Ann PI
igd
2r/3 s PWM
GSC
C1 Pulses
PI igq*
igq
L1
Grid Egq
2s/3s 2r/3s Udq Idq
PLL theta Egd abc
Figure7: PMSG Control Diagram
Monte Carlo Distribution:
Monte Carlo ways area unit a broad category of process algorithms that accept perennial sampling to get numerical results. Their essential plan is victimization randomness to unravel issues which may be settled in essence. Typically utilized in physical and mathematical issues and are most helpful once it's tough or not possible to use different approaches. Monte Carlo ways area unit in the main utilized in 3 distinct drawback classes: optimization, numerical integration, and generating attracts from a likelihood distribution.
Monte Carlo methods vary, but tend to follow a particular pattern:
1. Define a domain of possible inputs.
2. Generate inputs randomly from a probability distribution over the domain.
3. Perform a deterministic computation on the inputs. 4. Aggregate the results.
Binomial Distribution:
In applied math and statistics, the statistical distribution with parameters n and p is that the distinct likelihood distribution of the quantity of successes in a very sequence of n freelance experiments, every asking a yes–no question, and every with its own boolean-valued outcome: a stochastic variable containing single little bit of information:
success/yes/true/one (with probabilityp) or failure/no/false/zero (with probability q = 1 − p)
© 2018, IRJET | Impact Factor value: 6.171 | ISO 9001:2008 Certified Journal | Page 2084 Probability mass function
In general, if the random variable X follows the binomial distribution with parameters n∈ℕ and p∈ [0,1],
we write X ~ B(n, p). The probability of getting exactly k successes in n trials is given by the probability mass function:
for k = 0, 1, 2, ..., n, where
Fuzzy C-Means Clustering:
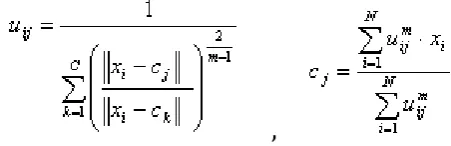
Fuzzy c-means (FCM) may be a methodology of cluster that permits one piece of knowledge to belong to 2 or additional clusters. This methodology is usually employed in pattern recognition. it's supported decrease of the subsequent objective function:
,
where m is any real number greater than 1, uij is the degree
of membership of xi in the cluster j, xi is the ith of
d-dimensional measured data, cj is the d-dimension center of
the cluster, and ||*|| is any norm expressing the similarity between any measured data and the center.
Fuzzy partitioning is carried out through an iterative optimization of the objective function shown above, with the update of membership uij and the cluster centers cj by:
,
Data area unit absolute to every cluster by suggests that of a Membership perform, that represents the fuzzy behavior of this formula. To do that, we tend to merely need to build Associate in degree acceptable matrix named U whose factors area unit numbers between zero and one, and represent the degree of membership between information and centers of clusters.
Simulation Study:
[image:4.595.313.558.382.510.2]The developed framework has been implemented in two power systems in order to validate and show its efficiency. After implementing the developed method on solar, wind power, and load data, their time-dependent clustered models are created. Then, by applying the sampling technique and implementing these models in the state sampling Monte Carlo and fuzzy c-means, the hourly and total reliability indices of the proposed system levels are calculated.
[image:4.595.46.272.571.644.2]Figure 9: Simulation Result for Wind Power Generation
Figure 10: Simulation Result for Solae Power Generation
In order to investigate the impact of wind regime and penetration levels of wind, the developed method has been applied for different wind profiles and various levels of wind farms. Also, reliability contribution of PV systems has been estimated using the time-dependent technique to validate its effectiveness to model solar energy. Results of this clustering technique and sequential Monte Carlo are given in Table I. It should be mentioned that all of the clustered models of wind and PV are generated by using different historical hourly data sets.
Capacity
Value Monte Carlo Time Dependent Cluster Error Wind-20KW
& PV-6KW 31.2 26.3 5.1 Wind 50KW
© 2018, IRJET | Impact Factor value: 6.171 | ISO 9001:2008 Certified Journal | Page 2085 5. CONCLUSION:
In this paper, a replacement approach has been conferred to gauge the dependableness contribution of wind and star generators. This methodology isn't solely a lot of quicker than the consecutive technique however is also able to capture the time-dependent characteristics of those clean resources and therefore the correlation between them. Results show that the new approach will estimate the ELCC of wind and PV with an appropriate accuracy. It’s additionally ended that this methodology is utilized for various penetration levels of wind and PV, and can offer precise results despite the wind profile and therefore the size of renewable generators. Also, this approach is capable of capturing seasonal behavior of installation and renewable resources.
REFERENCES:
[1] A. Keane et al., “Capacity value of wind power,” IEEE Trans. Power Syst., vol. 26, no. 2, pp. 564–572, May 2011.
[2] B. Hasche, A. Keane, and M. O’Malley, “Capacity value of wind power, calculation, and data requirements: The Irish power system case,” IEEE Trans. Power Syst., vol. 26, no. 1, pp. 420–430, Feb. 2011.
[3] R. Billinton and Y. Gao, “Multistate wind energy conversion system models for adequacy assessment of generating systems incorporating wind energy,” IEEE Trans. Energy Convers., vol. 23, no. 1, pp. 163–170, Mar. 2008.
[4] R. Karki, P. Hu, and R. Billinton, “A simplified wind power generation model for reliability evaluation,” IEEE Trans. Energy Convers., vol. 21, no. 2, pp. 533–540, Jun. 2006.
[5] A. Ghaedi, A. Abbaspour, M. Fotuhi-Firuzabad, and M. Moeini-Aghtaie, “Toward a comprehensive model of large-scale DFIG-based wind farms in adequacy assessment of power systems,” IEEE Trans. Sustain. Energy, vol. 5, no. 1, pp. 55–63, Jan. 2014.
[6] M. Ghofrani, A. Arabali, M. Etezadi-Amoli, andM. Fadali, “Energy storage application for performance enhancement of wind integration,” IEEE Trans. Power Syst., vol. 28, no. 4, pp. 4803–4811, Nov. 2013.
[7] A. P. Leite, C. L. T. Borges, and D. M. Falcão, “Probabilistic wind farms generation model for reliability studies applied to Brazilian sites,” IEEE Trans. Power Syst., vol. 21, no. 4, pp. 1493–1501, Nov. 2006.
[8] R. M. Moharil and P. S. Kulkarni, “Reliability analysis of solar photovoltaic system using hourly mean solar radiation data,” Solar Energy, vol. 84, no. 4, pp. 691–702, Apr. 2010.
[9] G. Zini, C. Mangeant, and J. Merten, “Reliability of large-scale grid-connected photovoltaic systems,” Renew. Energy, vol. 36, no. 9, pp. 2334– 2340, Sep. 2011.
[10] Z. Qin, W. Li, and X. Xiong, “Incorporating multiple correlations amongwind speeds, photovoltaic powers and bus loads in composite systemreliability evaluation,” Appl. Energy, vol. 110, pp. 285–294, Oct. 2013.