De, R., Verma, S. S., Holzinger, E., Hall, M., Burt, A., Carrell, D. S., ...
Gilbert-Diamond, D. (2017). Identifying gene-gene interactions that are
highly associated with four quantitative lipid traits across multiple cohorts.
Human Genetics, 136(2), 165-178.
https://doi.org/10.1007/s00439-016-1738-7
Peer reviewed version
Link to published version (if available): 10.1007/s00439-016-1738-7
Link to publication record in Explore Bristol Research PDF-document
This is the author accepted manuscript (AAM). The final published version (version of record) is available online via Springer at http://link.springer.com/article/10.1007%2Fs00439-016-1738-7#SupplementaryMaterial. Please refer to any applicable terms of use of the publisher.
University of Bristol - Explore Bristol Research
General rights
This document is made available in accordance with publisher policies. Please cite only the published version using the reference above. Full terms of use are available:
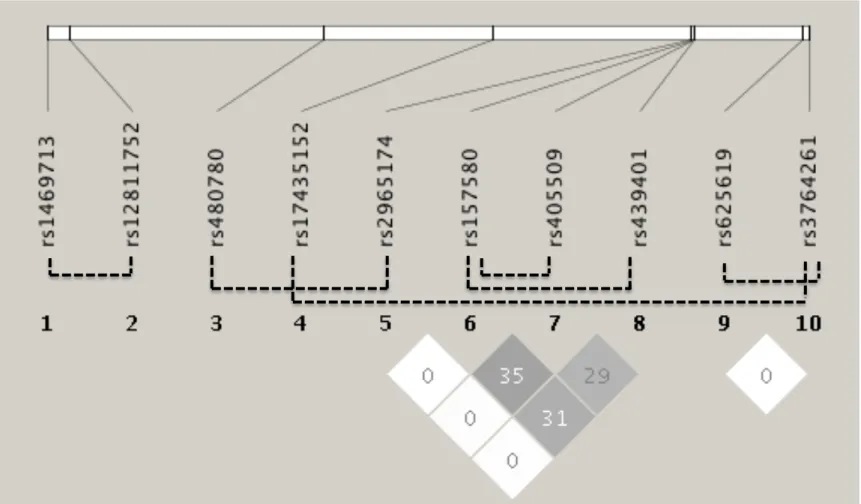
Fig. S1 Main effect filter analysis - underlying linkage disequilibrium (LD) structure of SNPs within pairwise interactions (P-value < 0.05) associated with LDL cholesterol level. LD diagram was generated using Haploview!
!
!!
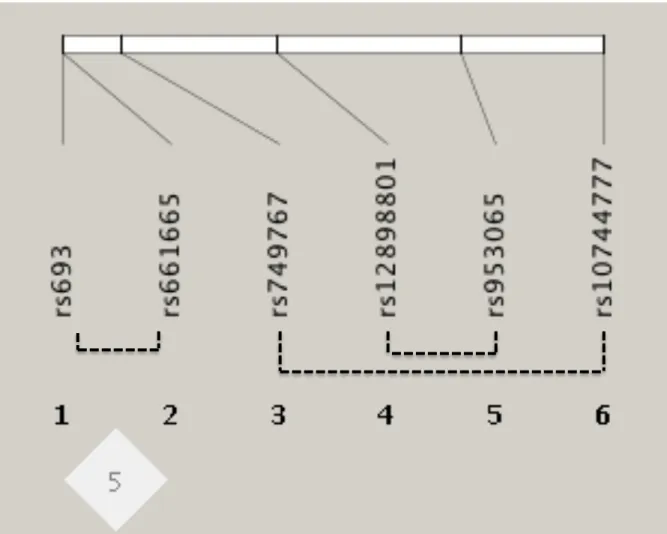
Fig. S2 Main effect filter analysis - underlying linkage disequilibrium (LD) structure of SNPs within pairwise interactions (P-value < 0.05) associated with total cholesterol level. LD diagram was generated using Haploview
!!
!!
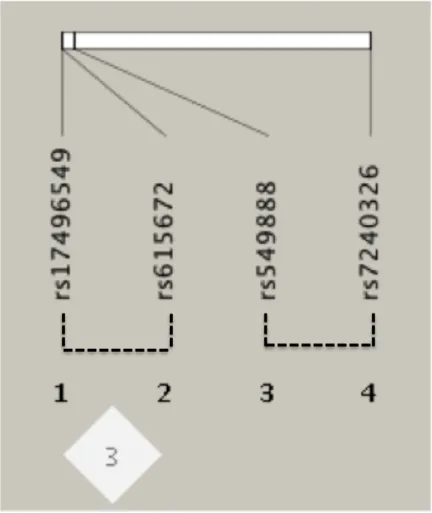
Fig. S3 Main effect filter analysis - underlying linkage disequilibrium (LD) structure of SNPs within pairwise interactions (P-value < 0.05) associated with triglyceride level. LD diagram was generated using Haploview
!!
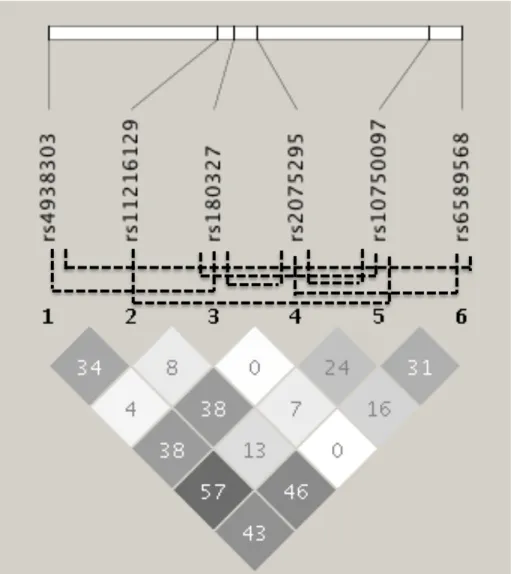
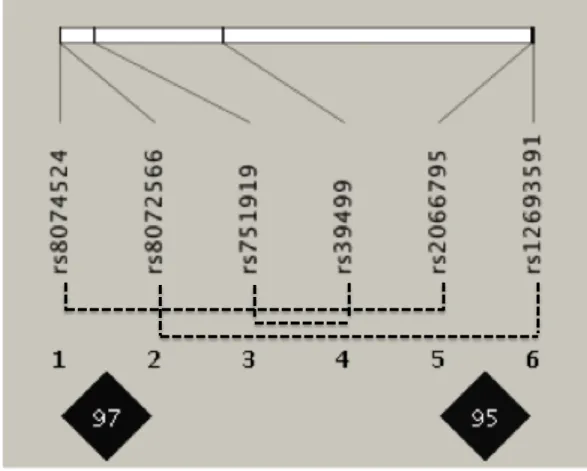
Fig. S5 Biofilter analysis - underlying linkage disequilibrium (LD) structure of SNPs within pairwise interactions (P-value < 0.05) associated with LDL cholesterol level. LD diagram showing r2 values was generated using Haploview
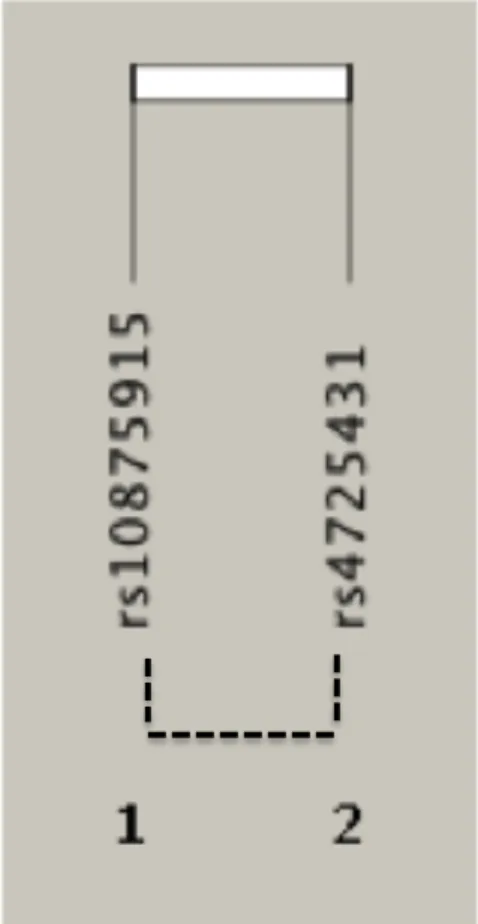
Fig. S6 Biofilter analysis - underlying linkage disequilibrium (LD) structure of SNPs within pairwise interactions (P-value < 0.05) associated with total cholesterol level. LD diagram showing r2 values was generated using Haploview!
! ! !
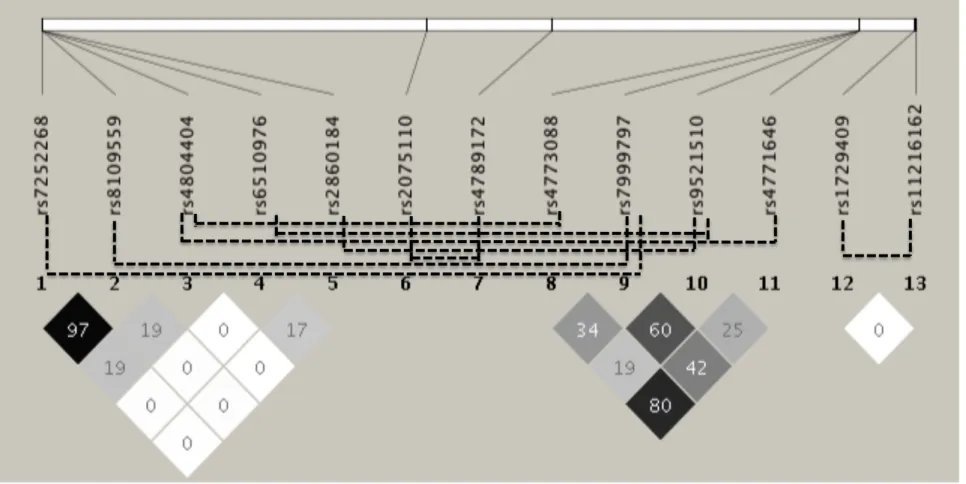
Fig. S7 Biofilter analysis - underlying linkage disequilibrium (LD) structure of SNPs within pairwise interactions (P-value < 0.05) associated with triglyceride level. LD diagram showing r2 values was generated using Haploview!
!
! !
!
Table S1 Known biological roles of genes identified within SNP-SNP interactions associated with each lipid trait. Gene information found using GeneCards database (www.genecards.org, Accessed March 28, 2015)
Gene Biological Role
Main effect filter: HDL-C
CETP Involved in the transfer of cholesteryl ester from HDL to other lipoproteins.
PDE4B
Belongs to the cyclic phosphodiesterase faily. Hydrolyzes cAMP, which is a key regulator of various physiological processes.
NFKB1 Encodes for the DNA binding subunit of the NFKB complex. NFKB activates multiple immune response genes.
COX6B2
Encodes for subunit 6B2 of cytochrome C oxidase, an enzyme that is a part of mitochondrial respiration.
LPL Mutations in LPL can cause type 1 hyperlipoproteinemia and other lipoprotein metabolism disorders. PSRC1 Involved in microtubule dynamics and mitotuc spindle organization.
DAG1 It is a part of the dystrophin-glycoprotein complex which provides a linkage between the cytoskeleton and extracellular matrix.
STAB1
Encodes for a transmembrane scavenger receptor protein that endocytoses low density lipoprotein.
MBL2 Encodes for mannose-binding lectin that is a part of the innate immune system.
FANCB Associated with the recessive disorder Fanconi Anemia. IDS Mutations in this gene cause a lysosomal storage disease called Hunter syndrome.
Main effect filter: LDL-C
TOMM40
Encodes for a membrane protein required for transport into the mitochondria. Has been
associated with increased risk of Alzheimer's disease and shown to affect LDL-C levels.
C7orf10 Mutations in this gene are associated with glutaric aciduria type III.
PDE3A
Encodes for a cGMP inhibited phosphodiesterase, involved in platelet aggregation, cardiac
contracility, hormone secretion, etc.
KL
Encodes for a transmembrane protein which has decreased expression in patients with chronic
kidney disease
APOE
Encodes for apolipoprotein E which binds the LDL receptor and is involved in lipoprotein
formation, sterol transport and cholesterol homeostasis. CETP Involved in the transfer of cholesteryl ester from HDL to other lipoproteins.
GATAD2A Encodes for a zinc finger domain containing protein that acts as a transcriptional repressor.
BCL3
A candidate proto-oncogene, that is associated with the regulation of transcriptional activation of
NFκB target genes.
PCSK9 Encodes for an enzyme that is an attractive drug target for hypercholesterolemia.
Main effect filter: TC
APOB Mutations within this gene can cause an inherited form of hypercholesterolemia.
LIPC Encodes for hepatic lipase which is involved in lipoprotein metabolism.
ALDH2
Encodes for aldehyde dehydrogenase that is involved in alchohol metabolism. Has been found to interact with genes involved in maintaining mitochondrial cholesterol levels. A polymorphism within this gene has been shown to be associated with HDL-C.
ACAN Forms a part of the extracellular matrix in cartilagenous tissues.
Main effect filter: TG
BUD13
Originally discovered as a splicing factor in yeast, that is involved in nuclear pre-mRNA
retention.
GALNT2
Encodes for a member of the GalNAc-transferase family, that catalyzes the initial reaction in
O-linked oligosaccharide biosynthesis.
FADS3
Member of the fatty acid desaturase gene family. Encodes for enzymes that regulate the
unsaturation of fatty acids.
APOA5 Encodes for an apolipoprotein that maintains plasma triglyceride levels.
LIPA
Encodes for a cholesterol ester hydrolase involved in the hydrolysis of triglycerides within
lysosomes.
KIAA0999 Encodes for a serine-threonine protein kinase that is a part of the SIK family.
ZNF259
Encodes for a zinc finger protein. Variants on this gene have been found to be associated with
total choelsterol and triglycerides in the past.
Biofilter: HDL-C
HLA-DRA
Encodes for a member of the HLA-DR class of molecules that are a part of the major
histocompatibility complex.
GGNBP1 Pseudogene of unknown function.
HLA-DRB1
Encodes for a member of the HLA-DR class of molecules that are a part of the major
histocompatibility complex.
BCL2
A proto-oncogene that suppresses apoptosis. Altering cholesterol levels in the plasma membrane have been shown to affect BCL2 gene expression.
Biofilter: LDL-C
STAT1
Encodes for a transcription factor that belongs to the signal transducer and transcription activator family. It is also involved in the IL-6 signaling pathways involved in inflammation, immune regulation and oncogenesis. Oxidized LDL has been shown to activate STAT1.
CYLD Encodes for a cytoplasmic protein involved in ubiquitination.
STAT3
Encodes for a transcription factor that belongs to the signal transducer and transcription activator family. It is also involved in the IL-6 signaling pathways involved in inflammation, immune regulation and oncogenesis. Oxidized LDL has been shown to activate STAT1.
Biofilter: TC
PRKAG2 PRKAG2 encodes for the regulatory γ2 subunit of an AMP-activated protein kinase. MLL2 Encodes for a mixed-lineage leukemia histone methylase.
Biofilter: TG
IRS2 Encodes for the insulin receptor substrate 2 molecule that mediates the effects of insulin.
EGFR Encodes for the epidermal growth factor receptor. Cholesterol levels in the plasma membrane have been shown to regulate EGFR activity. APOA5 Encodes for an apolipoprotein that maintains plasma triglyceride levels.
INSR Encodes for the insulin receptor molecule.
GRB2 Encodes for the growth factor receptor binding protein. KIAA0999 Encodes for a serine-threonine protein kinase that is a part of the SIK family
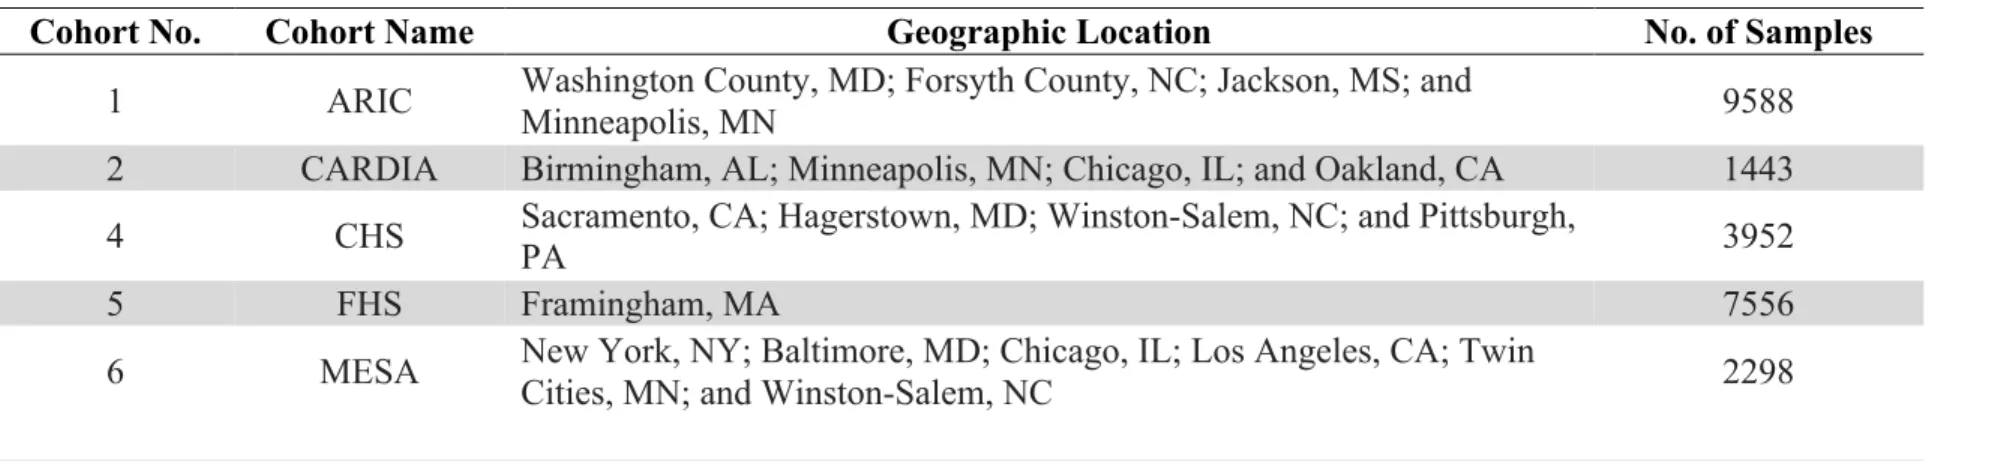
Table S2 Information for cohorts providing individual level data
Cohort No. Cohort Name Geographic Location No. of Samples
1 ARIC Washington County, MD; Forsyth County, NC; Jackson, MS; and Minneapolis, MN 9588
2 CARDIA Birmingham, AL; Minneapolis, MN; Chicago, IL; and Oakland, CA 1443
4 CHS Sacramento, CA; Hagerstown, MD; Winston-Salem, NC; and Pittsburgh,
PA 3952
5 FHS Framingham, MA 7556
6 MESA New York, NY; Baltimore, MD; Chicago, IL; Los Angeles, CA; Twin Cities, MN; and Winston-Salem, NC 2298
Total Samples 24837
Table S3 Information of eMERGE cohorts providing individual level data for replication analyses
Site Name Geographic Location No. in Sample
HDL-C
Group Health Cooperative Seattle, WA 1861 Vanderbilt University Nashville, TN 552
Marshfield Clinic Stevens Point, WI 2100 Mayo Clinic Rochester, MN 1447 Northwestern University Evanston, IL 624
Total Sample Size 6584
LDL-C
Group Health Cooperative Seattle, WA 959 Vanderbilt University Nashville, TN 578 Marshfield Clinic Stevens Point, WI 1929
Mayo Clinic Rochester, MN 1477 Northwestern University Evanston, IL 553
TC
Group Health Cooperative Seattle, WA 1886 Vanderbilt University Nashville, TN 583
Marshfield Clinic Stevens Point, WI 2832 Mayo Clinic Rochester, MN 1489 Northwestern University Evanston, IL 632
Total Sample Size 7422
TG
Group Health Cooperative Seattle, WA 1127 Vanderbilt University Nashville, TN 586
Marshfield Clinic Stevens Point, WI 2184 Mayo Clinic Rochester, MN 1495 Northwestern University Evanston, IL 625
Total Sample Size 6017
Table S4 Number of original (non-proxy) and LD-expanded (proxy) SNP-SNP models tested for replication in eMERGE dataset. Numbers are shown for each lipid trait after using both filtering methods
No. of original SNP-SNP models tested
No. of LD-expanded models tested
Main effect filter: HDL-C 4 114
Main effect filter: LDL-C 2 23
Main effect filter: TC 0 24
Main effect filter: TG 2 15
Biofilter: HDL-C 0 3
Biofilter: LDL-C 0 305
Biofilter: TC 0 8
Biofilter: TG 8 56
Table S5 Number of LD-expanded (proxy) SNP-SNP models generated for each original discovered SNP-SNP model. Also shown are the number of SNP-SNP models tested for replication in eMERGE dataset per signal. Numbers are shown for each lipid trait after using both main effect and Biofilter filtering methods
Original discovered model No. of additional LD expanded models generated
No. of LD-expanded models tested for replication in eMERGE
Main effect filter: HDL-C
rs4783961,rs1800775 9 7
rs12720918,rs158477 1 0
rs4783961,rs1864163 0 1
rs12720918,rs4783961 2 0
rs1864163,rs4784744 4 3
rs12708967,rs820299 1 0
rs12447924,rs9939224 39 0
rs4783961,rs158477 0 0
rs1864163,rs158477 0 0
rs1864163,rs820299 0 0
rs4783961,rs9939224 7 1
rs1800775,rs820299 9 0
rs12744291,rs1010554 97 4
rs230541,rs4935047 159 80
rs12976922,rs2952101 7 0
rs9939224,rs4784744 39 3
rs599839,rs2952101 8 0
rs12708967,rs158477 1 0
rs3870336,rs6641322 1 0
Main effect filter: LDL-C
rs157580,rs439401 0 1
rs17435152,rs3764261 29 0
rs157580,rs405509 1 1
rs12811752,rs1469713 215 0
rs480780,rs2965174 35 21
rs625619,rs3764261 9 0
Main effect filter: TC
rs693,rs661665 31 0
rs12898801,rs953065 4 0
rs10744777,rs749767 131 24
Main effect filter: TG
rs2075295,rs6589568 0 0
rs4938303,rs180327 5 0
rs180327,rs2075295 1 2
rs180327,rs10750097 1 0
rs11216129,rs10750097 7 0
rs609526,rs12257915 20 0
rs4938303,rs6589568 2 0
rs174455,rs689243 63 11
rs180327,rs618923 3 2
Biofilter: HDL-C
rs17496549,rs615672 51 0
rs549888,rs7240326 41 3
Biofilter: LDL-C
rs39499,rs751919 1539 261
rs12693591,rs8072566 83 11
rs2066795,rs8074524 83 11
Biofilter: TC
rs4725431,rs10875915 11 8
Biofilter: TG
rs9521510,rs2860184 20 0
rs9521510,rs6510976 41 22
rs2075110,rs4789172 11 6
rs4773088,rs4804404 19 6
rs7999797,rs8109559 11 7
rs4771646,rs4804404 69 15
rs1729409,rs11216162 15 0
rs7999797,rs7252268 11 7
Additional Acknowledgements:!