A Rate Control Model of MPEG-4 Encoder for
Video Transmission over Wireless Sensor Network
Farizah Yunus
1, Nor-Syahidatul N. Ismail
2, Sharifah H. S. Ariffin
3and S. K. Syed-Yusof
31School of Informatics and Applied Mathematics, Universiti Malaysia Terengganu, Malaysia 2Faculty of Computer Systems and Software Engineering, Universiti Malaysia Pahang, Malaysia 3School of Electrical Engineering, Faculty of Engineering, Universiti Teknologi Malaysia, Malaysia
Abstract: Recently, multimedia application has a lot of attention in the research community, especially when transmitting video over IEEE 802.15.4 standard. This is due to the capability of providing low complexity with low cost, but still maintaining the quality of video in term of packet received. However, transmitting video over Wireless Sensor Network (WSN) posed a new research challenges with high bandwidth demand and energy constrained of sensor nodes. MPEG-4 video codec is one of the compression techniques that used to decrease the amount of bandwidth required to meet WSN environment. Therefore, video encoding is a useful tool for rate control to control the video bit rate and maintaining the video quality especially in real-time communication applications. Video bit rate is affected by quantization scale, frame rate, and Group of Picture (GOP) size. A rate control model called enhanced Video Motion Classification based (e-ViMoC) model is proposed in this paper to produce the desired bit rate that complies to the IEEE 802.15.4 standard, while at the same time preserving the video quality. The analysis has shown that, the video transmission using e-ViMoC rate control achieves enhancement in delivery ratio, energy consumption and video quality (PSNR) when compared to video transmission using uncompressed video.
Keywords: IEEE 802.15.4 standard, Wireless Sensor Network (WSN), MPEG-4, Rate control, Video encoding, Quantization scale, Frame rate and Group of Picture (GOP).
1.
Introduction
Recently, multimedia applications over WSNs are emerging rapidly. This is due to the advancement of wireless multimedia services and technologies such as wireless video services which are becoming ubiquitous in our daily life [1]. With the existing WSNs platform for multimedia applications, many potential applications can be provided such as multimedia surveillance sensor network, traffic control system to avoid traffic congestion, law enforcement report, environmental monitoring for habitat monitoring, industrial process control to detect defective products automatically and advanced health care delivery [2].
Enabling multimedia application requires additional feature and had open many research challenges due to the nature of multimedia data itself such as high bandwidth demand, complex multimedia coding technique, high power consumption, application-specified Quality of Service(QoS) requirement, tolerable end-to-end delay and proper jitter [2]. However, these requirements contradict with the existing characteristic of multimedia transmission in standard WSNs which are limited storage, limited processing ability and bandwidth limitations of sensor nodes. These factors are important as a guideline to design communication protocols for efficient multimedia transmission in WSNs which comply with the IEEE 802.15.4 WSN standards.
Therefore, reliable data transmission in WSNs had becomes very crucial for multimedia application with different application requirements. Multimedia application requires reliability of data where the huge video data that generated during encoding process will degrade the reliability of the video transmission. Thus, the encoding process is very important in video transmission because it give significant effect on the results at the end of video transmission which is quality of the video.
The video encoding process is crucial in reducing the traffic volume for transmission as well as maintaining the quality of video. The video encoding is a useful tool for rate control. Rate control model is one ways to reduce the size of bandwidth requirement by controlling the bit rate of video transmission over a channel of limited bandwidth such as sensor networks. This technique must be employed during the video compression process in order to adjust the encoding parameter settings. The encoding parameter settings are important to ensure the video bit rate meets the low transmission rate up to 250kbps [3] with small Maximum Transmission Unit (MTU) size of 127 kbytes [4] supported by IEEE 802.1.5.4.
The video bit rate and the quality of a video after encoded depend on several encoding parameters such as quantization scale, frame rate and Group of Picture (GOP) size. In particular, choosing a high quantization scale will reduces the video bit rate, but at the same time reduces the quality of encoded video. The goal of rate control is to keep the video bit rate within the bandwidth limit while achieving acceptable video quality. This goal can be achieved by choosing optimal and accurate combination of encoder parameter settings determination. This is because different combination of parameter setting produces a different video bit rate and video quality.
Then, a simulation study for MPEG-4 video encoding and testing model was carried out to determine optimal threshold for the three encoder parameters in order to implement video transmission in WSN environment as discussed in [5]. Based on simulation data, an enhanced Video Motion Classification based (eViMoC) is proposed to control the bit rate at the video encoder as well as to provide an optimal combination of those three encoder parameters.
2.
Related Works
This section provides the related works for existing rate control model for video encoding process. The challenge of video encoding process is to determine the optimal combination of encoder parameters setting to achieve the target bit rate based on standard wireless medium itself. Since the compatibility with the target bandwidth is desired, the video must be encoded many times with different encoder parameter settings. Different effects are obtained on the video bit rate with variation of encoder parameter setting for all cases when one, two or three encoder parameters setting are varied.
There are two important parameters in video coding which are the video bit rate and the video quality [6]. The rate control is also crucial to prevent buffer overflow and underflow for limited buffer capacity in order to avoid frame skipping. From the literature, there are many approaches and algorithm that have been proposed and implemented. The choice of rate control algorithm depends on the characteristic of the video application. Improper combination of parameter settings will degrade the video quality.
Additionally, there are three categories of approaches in developing the rate control algorithm according to the way for calculating the target bit budget [7]. The first category is buffer-based approaches which compute the target bit budget on a macroblock based on buffer state, the previous bit count or both. The second category is the analytical approaches which calculate a set of rate-quantization and rate-distortion function derived from the overall statistical properties of the data source. The third category is the operational Rate Distortion (R-D) modeling approach where the operation is performed only after the statistical properties of the signal in future frames or model parameters estimated from the past data are processed.
The approach for the first category is used in both real time and low complexity applications that emphasizes on fast computation such as Test Model version 5 (TM5) [8] for MPEG-2 and Test Model Near-term version 8 (TMN8) [9] for H.263. These approaches will determine a target bit budget based on the current available information such as local scene activity, buffer fullness and bit count of the previous frame. A major drawback of these approaches is the lack of accuracy when the scene activity changes rapidly. It is hard to avoid quality degradation at a scene change because the information from the coded data is no longer valid. The R-D estimation technique [10] is proposed to improve the accuracy and to improve buffer-based approach.
The second approach uses an analytical model based on the statistical information. For example, the author in [11] introduced a rate quantization curve model which is modeled by a logarithmic formula with several control parameters. The model is shown as equation (1):
; where R is a rate quantization model, q is quantization parameter, and are parameters model with the condition of . These parameter models are estimated from coding statistics generated during encoding of input video. This model only considered one parameter setting which selects the quantization parameters based on the given target bit rate.
The drawback of the model is less accuracy of the model for P or B frame in low activity video sequences. This is because the model assumes that the video content is stationary across scenes and frames. Thus, this model needs to be improved to achieve high video quality. In order to improve the accuracy of the model, it has to be designed into more control points which can be used for data fitting such as polynomial [12], [13] and exponential [14].
Then, for third category approach, Rate-Distortion (R-D) model is used to achieve optimal bit allocation in order to maximize the video quality for a given bit budget such as presented in [15]. The video sequence can be encoded with all possible quantization values and then the corresponding encoded video bit rate and distortion are recorded to measure R-D characteristics. The operational R-D characteristic is accurate, but the computational complexity is high and it is rarely adopted in practical applications especially real-time video coding.
Since this work focuses on MPEG-4 video coder, this section will describe the rate control mechanisms for MPEG-4 coder. In [16], Chiang and Zhang have developed a rate control model with a quadratic form. Based on the R-D function, a quadratic rate control model was proposed as shown in equation (2):
; where B is the total number of bits used for encoding the current frame, q denotes the quantization parameter used for the current frame and ‘a’ and ‘b’ are model parameters that
are updated by linear regression method from post encoded information. Then, this rate control model was improved for MPEG-4 applications by Lee in [17]. The algorithm introduced a scalable rate control scheme and achieves an accurate bit allocation with low latency and a limited buffer size. This model is used to evaluate the target bit rate before performing the actual encoding process.
Z. He in [18] proposed -model as shows in equation (3): (3) The denotes the percentage of zero among the quantized DCT coefficient with a given quantization parameter is a constant value that is related to the image content. In this work, the author considered both bit rate and quantization parameter as the function of . The bit rate is observed to have a linear relationship with and shown to have high accuracy of rate prediction. However, the model does not provide explicit relationship between quantization parameter and in order to understand the impact of quantization parameter on the rate.
3.
Proposed Rate Control Model
This section briefly describes the parameters setting for video encoding that influences the video transmission and proposed rate control model.
3.1 Encoding Parameters that Influences Video Transmission
quality. Besides, the video size is also proportional to the bit rate and the video duration. Higher bit rate allows more amount of information to be transmitted and results in better video quality. However, the bit rate of uncompressed video is infeasible for practical application. Thus, compression technique is used to reduce the video bit rate. The video bit rate is affected by the selection of the value in encoder parameters such as quantization scale (q), frame rate (r), and GOP size (l).
Quantization scale (q) is the parameter responsible for the “lossiness” in the MPEG-4 encoding scheme. It basically determines the output for Discrete Cosine Transform (DCT) in video compression. By having lower value of q , the compression ratio would be low and the video quality would remain close to the original video. However, low value of q
would not aid in video size reduction. Contrary, increasing the q on the other hand would decrease the compressed video size or frame size but degrade the video quality. A highly compressed video would produce an artifact1 because of the
missing information during the encoding process. The tradeoff between video quality and compressed video size must be compromised to achieve an acceptable video quality with an acceptable size for video transmission over the network such as WSN. Conversely, increasing the q will decrease the video bit rate [19], and it is important to ensure that the bit rate is not more than 250kbps. The scale for quantization process can be controlled between 1 and 31 [20]. However, the video output for scale 1 and 2 are similar, thus the q typically starts with scale 2.
The next parameter is frame rate (r), which is also known as temporal sampling. Typically, r is described in terms of frame per second (fps) or Hertz (cycles per second, abbreviated as Hz) [21]. Frame rate is important because it contributes to the smoothness of the image transitions in the video scene [22] and is used to determine the quality of a video. Frame rate below than 10 fps is used reduces the amount of data, but the resultant motion is clearly jerky and unnatural. The video sequences for frame rate between 10 and 20 fps are smooth, but in case of fast moving part sequences, convulsive and unnatural motion may occur. Furthermore, frame rate at 25 and 30 fps are the standards for television pictures for Phase Alternating Line (PAL) and National Television Standard Committee (NTSC), respectively. However, the video bit rate increases as the value of frame rates increases, but the changes in the number of frame rate does not give any effect to the video quality that is represented by the PSNR value.
Video flow consists of a repeated pattern of I, P and B frames which is defined as Group of Picture (GOP). The choice of GOP structure is important because it will give effect on frame size and file size. Additionally, it also gives impact to the MPEG video streaming in terms of network bitrate and video quality [23]. The smallest GOP length is a single I frame. There is no limitation of the GOP length, but a typical length for transmission purpose is about 12 or 15 frames as employed in [24].
3.2 Video Encoding Process
Real time encoding for multimedia content using conventional encoding techniques requires high processing and transmission power over error resilient wireless network
1 Artifact is a distortion in a compressed image or video.
[25]. In rate control mechanism, the video encoder will estimate the video bit rate and adjust the encoding parameters to achieve targeted bit rate based on the available network bandwidth [26]. The video bit rate and video quality can be changed during encoding process by adjustment of several values in encoding parameters.
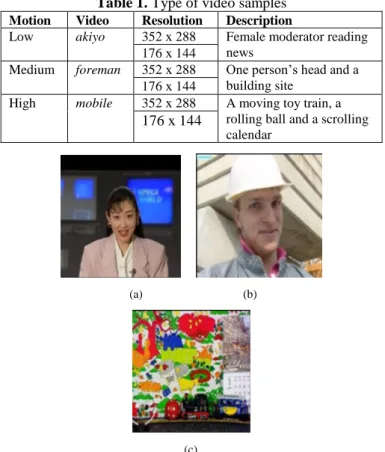
The most apparent encoding parameters that can be varied is quantization scale (q), followed by frame rate (r) and Group of Picture (GOP) size (l). There are three different video sequences with 4:2:0 sub-sampling for both Common Intermediate Format (CIF) with resolution 352x288 pixel and Quarter CIF (QCIF) video format with resolution 176x144 pixel are used in this research. Error! Reference source not found. summarizes the description for all video samples. Figure 1(a) illustrates the motion video sequence for low video motion called akiyo video samples, Figure 1(b) for medium video motion frame sequence called foreman video samples and Figure 1(c) for high video motion called mobile
video sample.
Table 1. Type of video samples
Motion Video Resolution Description
Low akiyo 352 x 288 Female moderator reading news
176 x 144
Medium foreman 352 x 288 One person’s head and a building site
176 x 144
High mobile 352 x 288 A moving toy train, a rolling ball and a scrolling calendar
176 x 144
(a) (b)
(c)
Figure 1. Motion video sequences for (a) akiyo ; (b) foreman
and (c) mobile
This process is done in Cygwin2 platform. The original video
source which is raw yuv video (*.yuv file) is encoded using
ffmpeg tool to produce m4v video format (*.m4v file). At this step, the parameter of q, r and l are set and varied until find the optimal value of parameter setting with the encoded video bit rate less than 250kbps. Then, graph is plotted based on value of q, r and l which are obtained from the encoding process. Finally, the equation for the rate control model is computed using Matlab simulation tool. The overall process is shown in Figure 2.
Start
MPEG-4 video is encoded with optimal parameter setting using Evalvid simulation tool
Plot the graph based on value of q, r and l towards
encoded video bit rate
Compute the equation of rate control using Matlab simulation tool
Finish
Figure 2. Process to compute the equation of rate control model
3.3 Proposed Rate Control of Enhanced Video Motion Classification based (e-ViMoC)
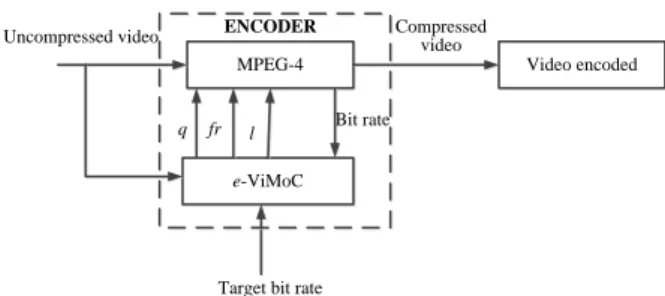
This section describes the rate control model which is proposed to predict and control the encoded video bit rate at the encoder part. The proposed rate control of enhanced Video Motion Classification based (e-ViMoC) model is involved with three parameters setting that consists of quantization scale (q), frame rate (r) and GOP size (l). The e-ViMoC model is derived from the simulated data which is based on the analysis of the effect of q, r and l parameter setting variation towards video bit rate as shown in Figure 3 and simulated using Evalvid simulation tool .
Target bit rate Uncompressed video
MPEG-4
Compressed video
Bit rate
e-ViMoC
q fr l
Video encoded ENCODER
Figure 3. Proposed rate control model for e-ViMoC
The model is computed as in Equation (4).
Where is the maximum bit rate
with the combination of minimum quantization scale, , maximum frame rate, and maximum GOP size.
Firstly, quantization scale, q is varied with fixed frame rate, r
and secondly, r is varied with fixed q value. Both of these conditions used maximum GOP size, l, which is equal to 30 frames. Then, l is varied with the given value of q and r. Fig. 4 shows the graph pattern of bit rate for the akiyo_qcif
video sample with variation of q, with the given r and fixed l. Based on the graph, the bit rate reduces exponentially when the q increases. is the normalized bit rate versus quantization scale, q for the maximum frame rate, and maximum GOP size, as given in Equation (5).
The function describes how the bit rate decreases when the quantization scale, q increases under the condition of maximum frame rate, and maximum GOP size, .
Since the effect of q, r and l on bit rate is independent of one another, therefore, the function of can be represented by the factor of q only which is denoted by
as presented in Equation (6).
Based on the simulated data of bit rate shown in Figure 4, inverse power function is chosen to compute the equation of . This is because, inverse power function will produce values very close to the simulated data points where exponential decrement is observed. The value of will be equal to 1 when , and reduces to 0 when q goes to infinity. Parameter “a” describes how fast the bit rate reduces as the quantization scale, q increases. The value for parameter “a” is approximately between the range of 0 and 2.
Figure 5 describes how the bit rate increases when the frame rate increases under a given quantization scale, q value and maximum GOP size, . Function is the normalized bit rate versus frame rate, r for a given quantization scale, q and maximum GOP size, is shown in Equation (7).
function can also be represented the variable r
only as presented in the Equation (8), becomes :
Based on the equation, is equal to 1 when and reduces to 0 when . Different from function, power function is chosen to compute the equation based on the observation from the graph shown in Figure 5. The power function is chosen because it will produce values close to the simulated data points.
Parameter “b” from the equation characterizes how fast the bit rate increases when the frame rate increases. From the computed power function, the value of “b” is between the range of 0 and 2.
is the normalized bit rate versus GOP size, l for the given quantization scale, q and frame rate, r presented in Equation (9).
The function describes how the bit rate decreases when the GOP size, l increases under the given quantization scale, q
and frame rate, r. The function can also be represented by the factor of l only and denoted as . The equation can be written as in Equation (10).
Parameter c in the equation is also obtained from the graph in Figure 6 to obtain inverse power function and characterizes how fast the bit rate decreases when the GOP size, l increases with the given quantization scale, q and frame rate, r. From the computed power function, the range of c is between the values of 0 and 1.
Thus, to compute the equation that characterizes all of the three parameters of quantization scale, q, frame rate, r and GOP size, l, Equations (5) - (10) are substituted into Equation (4). Then, Equation (11) is obtained.
For a given target data rate for WSN where it must not exceed 250kbps, the determination of parameters for quantization scale, q, frame rate, r and Group of Picture (GOP) size, l are subjected to the parameters range of
, and . The e-ViMoC
optimization model for the three parameters setting of MPEG-4 video over WSN is shown below:
subject to:
4.
Performance Analysis and Discussion
This section presents the results and analysis of video transmission over WSN between rate control of e-ViMoC
(video is encoded using optimal parameter settings) and non-optimized encoded video (video is encoded without the optimal value of parameter settings) to generate video trace file as an input to the simulator. In the non-optimized method, the parameter values are selected randomly. The random selection method used as the benchmark of the proposed work is adopted from the work [27], [28].
Network Simulator-2 (NS-2) is used to simulate the video transmission over WSN using Real-Time Load Distribution (RTLD) routing protocol [29]. The simulation parameters used are 802.15.4 MAC and the physical layer parameter is set with the default power transmission (1mW).
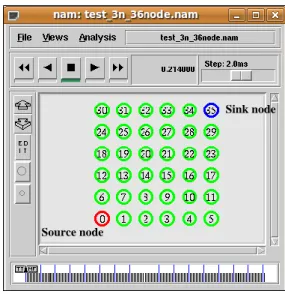
A typical setup of one traffic configuration which considers a video traffic between one source node and a sink node in WSN application is used. The video traffic is generated
based on e-ViMoC rate control model. In this simulation, 4, 9, 16, 25 and 36 nodes are located distributed in a region with the grid topology as shown in Figure 7. The payload used in the traffic is the video data with user datagram protocol (UDP) as the transport protocol.
Source node
Sink node
Figure 7. Network grid topology
Figure 8 shows the delivery ratio performance which is packets received at the sink node to the total packets sent from the source node in the network. The proposed e-ViMoC
rate control model has successfully achieved average delivery ratio enhancement of 8.32%, 3.47% and 3.63% for akiyo,
foreman and mobile video sequences respectively compared to non-optimized method. The delivery ratio for akiyo video sequences in Figure 8(a) which is categorized as low motion with small video size is higher than foreman and mobile
video sequences shown in Figure 8(b) and Figure 8(c). A small size of video sequences consists of a small number of packet transmissions. Hence, the receiver tends to receive a high number of packets sent from the sender. Based on the results, the delivery ratio of video transmission over WSN is decreased when the number of nodes in the network is increased from low network density (4 nodes) to medium network density (49 nodes). This is because a large number of nodes lead to more congestion, channel contention and interference between the nodes in the network.
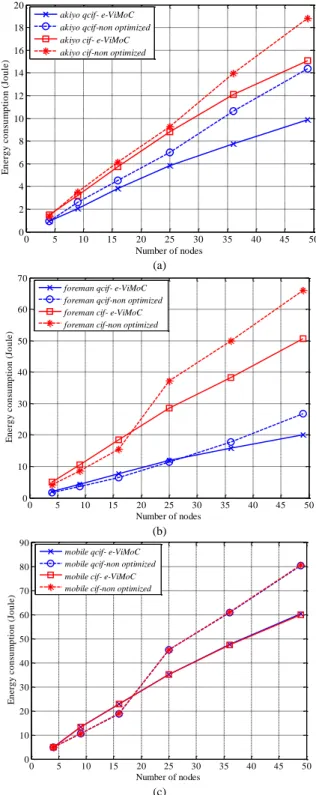
Figure 9 demonstrates the performance comparison of video transmission for e-ViMoC and non-optimized video encoding in term of energy consumption for all video samples. Energy consumption is defined as the energy consumed at each sensor node during the simulation task. The e-ViMoC video encoding consumes less energy where the average reduction 17.69% for akiyo, 14.53% for foreman and 16.9% for mobile
0 5 10 15 20 25 30 35 40 45 50 0 10 20 30 40 50 60 70 80 90 100
Number of nodes
D e li v e ry r a ti o ( % )
akiyo qcif- e-ViMoC akiyo qcif-non optimized akiyo cif- e-ViMoC akiyo cif-non optimized
(a)
0 5 10 15 20 25 30 35 40 45 50
0 5 10 15 20 25 30 35
Number of nodes
D e li v e ry r a ti o ( % )
foreman qcif- e-ViMoC foreman qcif-non optimized foreman cif- e-ViMoC foreman cif-non optimized
(b)
0 5 10 15 20 25 30 35 40 45 50
0 2 4 6 8 10 12 14
Number of nodes
D e li v e ry r a ti o ( % )
mobile qcif- e-ViMoC mobile qcif-non optimized mobile cif- e-ViMoC mobile cif-non optimized
(c)
Figure 8. Performance comparison of video transmission in term of the delivery ratio for (a) akiyo; (b) foreman and (c)
mobile video sequences
0 5 10 15 20 25 30 35 40 45 50
0 2 4 6 8 10 12 14 16 18 20
Number of nodes
E n e rg y c o n su m p ti o n ( Jo u le )
akiyo qcif- e-ViMoC akiyo qcif-non optimized akiyo cif- e-ViMoC akiyo cif-non optimized
(a)
0 5 10 15 20 25 30 35 40 45 50
0 10 20 30 40 50 60 70
Number of nodes
E n e rg y c o n su m p ti o n ( Jo u le )
foreman qcif- e-ViMoC foreman qcif-non optimized foreman cif- e-ViMoC foreman cif-non optimized
(b)
0 5 10 15 20 25 30 35 40 45 50
0 10 20 30 40 50 60 70 80 90
Number of nodes
E n e rg y c o n su m p ti o n ( Jo u le )
mobile qcif- e-ViMoC mobile qcif-non optimized mobile cif- e-ViMoC mobile cif-non optimized
(c)
Figure 9. Performance comparison of video transmission in term of energy consumption for (a) akiyo; (b) foreman and
(c) mobile video sequences
Figure 10 shows the quality of video encoded by using e-ViMoC and non-optimized after transmission over WSN. Video quality is measured in term of Peak Signal to Noise Ratio (PSNR) where the original video signal will be compared with the reconstructed video signal. The average PSNR for e-ViMoC encoded video is higher by 7% for akiyo
0 5 10 15 20 25 30 35 40 45 50 10 15 20 25 30 35 40 45
Number of nodes
P S N R ( d B )
akiyo qcif- e-ViMoC akiyo qcif-non optimized akiyo cif- e-ViMoC akiyo cif-non optimized
(a)
0 5 10 15 20 25 30 35 40 45 50
10 12 14 16 18 20 22 24 26 28
Number of nodes
P S N R ( d B )
foreman qcif- e-ViMoC foreman qcif-non optimized foreman cif- e-ViMoC foreman cif-non optimized
(b)
0 5 10 15 20 25 30 35 40 45 50
6 8 10 12 14 16 18 20 22 24
Number of nodes
P S N R ( d B )
mobile qcif- e-ViMoC mobile qcif-non optimized mobile cif- e-ViMoC mobile cif-non optimized
(c)
Figure 10. Performance comparison of video transmission in term of Peak Signal to Noise Ratio (PSNR) for (a) akiyo; (b)
foreman and (c) mobile video sequences
5.
Conclusions
In this paper, an optimized variable rate control model is developed to control the bit rate at the video encoder as well as to determine the optimal combination of parameter setting during the encoding process. The time of the search processes to choose the optimal parameters setting is high for the exhaustive search method. To further speed up the best decision of the optimal parameters setting, the rate control model is proposed to control the encoded video bit rate at the video encoder using optimal combination of quantization q, frame rate r, and GOP size, l. The rate control serves an important technique to control the bit rate of video transmission over a channel of limited bandwidth.
The proposed rate control model is enhanced Video Motion Classification based (e-ViMoC) model that considered three encoder parameter settings which are quantization scale (q), frame rate (r) and GOP size, (l).
Since this research focuses on designing reliable data transmission that is highly subjected to minimize the number of packet loss for video transmission, thus the reliability is measured in term of packet delivery ratio. From the simulation result, the delivery ratio for transmission of e-ViMoC encoded video for low video motion (akiyo video sequences) has an average improvement of about 8.32%, compared to transmission of non-optimized encoded video. The low video motion has better performance compared to medium (foreman video sequences) and high video motion (mobile video sequences) because the video size of low video motion is smaller than others. Small video size produces less packet transmission and achieves reliable data transmission over WSN with high packet delivery ratio.
Since reliable data transmission in wireless network is very crucial for multimedia application, thus to improve the reliability of video transmission, communication protocols stack which is the transport protocol will be considered. Transport protocol works at transport layer that responsible to ensure end-to-end reliability, which is the probability of packets being received at the destination and to provide congestion control mechanism to reduce or alleviate any congestion happen. Hence, for future direction of this research, the enhanced transport protocol to provide lightweight protocol will be proposed. here
6.
Acknowledgement
The authors would like to express their deepest gratitude to Research Management and Innovation Center (RMIC), Universiti Malaysia Terengganu (UMT) for the sponsorhip and financial support.
References
[1] N. Abbas, F. Yu , and Y. Fan, “Intelligent Video Surveillance Platform for Wireless Multimedia Sensor Networks,” Applied Sciences, Vol. 8, No. 348, pp. 1-14, 2018.
[2] H. Shen and G. Bai, “Routing in wireless multimedia sensor networks: A survey and challenges ahead”, Journal of Network and Computer Application, Vol. 71, No. 2016, pp. 30-49, 2016.
[3] N. Ahmed, H. Rahman, Md.I. Hussain, “A comparison of 802.11ah and 802.15.4 for IoT,” The Korean Institute of Communications Information Sciences, Elsevier B.V., August 2016.
[4] F. Farokhmanesh, “Analyzing And Evaluating Network Protocols In IoT,” Master In Computer Architecture, Networks And Systems thesis, Universitat Politecnica De Catalunya, Barcelona, Spain, Dec. 2014.
[5] F. Yunus, S. H. S. Ariffin, S. K. Syed-Yusof, Nor-Syahidatul N. Ismail, A. H. F. Abdul Hamid, N. Fisal, “Optimum Parameters for MPEG-4 Data over Wireless Sensor Network,” International Journal of Engineering and Technology, Vol. 5, No. 5, pp. 4501-4513, 2013.
[6] M. Angelides, and H. Agius, The Handbook of MPEG Applications : Standards in Practice. 1st. ed. United Kingdom: John Wiley & Sons. 2011.
[8] Z. Zhu, Y. Bai, Z. Duan, and F. Liang, “Novel Rate-Control Algorithm Based on TM5 Framework”. Wireless Sensor Network, Vol. 1, No. 3, pp. 182–188, 2009.
[9] J. Ribas-corbera, S. Lei, and S. Member, “Rate Control in DCT Video Coding for Low-Delay Communications,” IEEE Transactions on Circuits and Systems for Video Technology, Vol. 9, No. 1, pp. 172–185, 1999.
[10] S. Hong, S. Yoo, S. Lee, H. Kang, and S. Y. Hong, “Rate Control of MPEG Video for Consistent Picture Quality,” IEEE Transactions on Broadcasting, Vol. 49, No.1, pp. 1–13, 2003.
[11] W. Ding, and B. Liu, “Rate Control of MPEG Video Coding and Recording by Rate-Quantization Modeling,” IEEE Transactions on Circuits and Systems for Video Technology. Vo. 6, No. 1, pp. 12–20, 1996.
[12] J. I. Ronda, M. Eckert, F. Jaureguizar, and N. Garcia, “Rate Control and Bit Allocation for MPEG-4,” IEEE Transactions on Circuits and Systems for Video Technology. Vol. 9, No. 8, pp. 1243–1258, 1999.
[13] L. Lin, and A. Ortega, “Bit-Rate Control Using Piecewise Approximated Rate – Distortion Characteristics,” IEEE Transactions on Circuits and Systems for Video Technology, Vo. 8, No. 4, pp. 446–459, 1998.
[14] J. Bai, Q. Liao, X. Lin, and X. Zhuang, “Rate Distortion Model Based Rate Control for Real-time VBR Video Coding and Low-Delay Communications,” Signal Processing: Image Communication. Vol. 17, No. 2002, pp. 187–199, 2002. [15] G. M. Schusteg, and A. K. Katsaggelos, “Optimal Bit
Allocation Among Dependent Quantizers for the Minimum Maximum Distortion Criterion,” Proceeding of the IEEE International Conference on Acoustics, Speech and Signal Processing (ICASSP), Munich, Germany: IEEE, pp. 3105– 3108, 1997.
[16] T. Chiang, and Y. Zhang, “A New Rate Control Scheme Using Quadratic Rate Distortion Model” IEEE Transactions on Circuits and Systems for Video Technology. Vol. 7, No. 1, pp. 246–250, 1997.
[17] H-J. Lee, T. Chiang, and Y. Zhang, “Scalable Rate Control for MPEG-4 Video,” IEEE Transactions on Circuits and Systems for Video Technology, Vol. 10, N0. 6, pp. 878–894, 2000.
[18] Y. K. Kim, Z. He, and S. K. Matra, “A Novel Linear Source Model and a Unified Rate Control Algorithm for H.263 / Mpeg-2 / Mpeg-4,” Proceeding of the IEEE International Conference on Acoustics, Speech, and Signal Processing (ICASSP ’01), Salt Lake City, UT: IEEE, pp. 1777–1780, 2001.
[19] P. Sarisaray-Boluk1 and K. Akkaya, “Performance Comparison of Data Reduction Techniques for Wireless Multimedia Sensor Network Applications,” International Journal of Distributed Sensor Networks, Vol. 15, No. 0, pp. 1-15, 2015.
[20] IndigoVision Ltd. “Understanding MPEG-4 Video,” IC-COD-REP012-1.2, 2008.
[21] B. Waggoner, “Uncompressed Video and Audio: Sampling and Quantization,” In Waggoner, B. ed. Compression for Great Video and Audio: Master Tips and Common Sense. UK: Focal Press, pp. 15–34, 2009.
[22] I. E. G. Richardson, “H.264 and MPEG-4 Video Compression: Video Coding for Next-generation Multimedia,” England: John Wiley & Sons Ltd, 2003. [23] A. Huszák, and S. Imre, “Analysing GOP Structure and
Packet Loss Effects on Error Propagation in MPEG–4 Video Streams,” Proceeding of the 4th International Symposium on Communications, Control and Signal Processing, ISCCSP 2010, Limassol, Cyprus: IEEE, pp. 3–5, 2010.
[24] C. A. G. da Silva, G. F. de S. Miguel, J. G. Sauer and C. M. Pedroso, “Evaluation of Impairment Caused by MPEG Video Frame Loss,” Scientific Research Publishing, Vol. 9, pp. 493-503, 2017.
[25] S. Pudlewski, and T. Melodia, “Compressive Video Streaming : Design and Rate-Energy-Distortion Analysis,” IEEE Transactions on Multimedia. Vol. 15, No. 8, pp. 2072– 2086, 2013.
[26] Z, Wu, S. Xie, K. Zhang, and R. Wu, “Rate Control in Video Coding,” In Lorente, J. D. S. Recent Advances on Video Coding, InTech, 2011.
[27] A. Hayter. “Probability and Statistics for Engineers and Scientists,” 4th ed. USA: Richard Stratton, 2012
[28] S. Songkhao, and W. Teerapabkajorndet, “Network Bandwidth Enhancement on Multi-Hop Communications for Multiple Flows of Video over Multi-Channel IEEE 802.15.4 Networks,” Journal of Convergence Information Technology, Vol. 8, No. 11, pp. 239–247, 2013.
[29] A. Ahmed, and N. Fisal, “Secure Real-time Routing Protocol with Load Distribution in Wireless Sensor Networks,” Security and Communication Networks. Vol. 4, No. 8, pp. 839–859, 2010.
Figure 4. The changes of video bit rate with different value of quantization scale