Open Access
Research
Eosinophil and T cell markers predict functional decline in COPD
patients
Jeanine M D'Armiento
1, Steven M Scharf
2, Michael D Roth
3,
John E Connett
4, Andrew Ghio
5, David Sternberg
1, Jonathan G Goldin
3,
Thomas A Louis
6, Jenny T Mao
3, George T O'Connor
7, Joe W Ramsdell
8,
Andrew L Ries
8, Neil W Schluger
1, Frank C Sciurba
9, Melissa A Skeans
3,
Helen Voelker
3, Robert E Walter
6, Christine H Wendt
3, Gail G Weinmann
10,
Robert A Wise
5and Robert F Foronjy*
1Address: 1Departments of Medicine and Surgery, Columbia University, New York, USA, 2Department of Medicine, University of Maryland,
Baltimore, USA, 3Departments of Medicine and Radiology, University of California, Los Angeles, USA, 4Departments of Medicine and Biostatistics/
CCBR, University of Minnesota, Twin Cities, USA, 5National Health and Environmental Effects Research Laboratory, Environmental Protection
Agency, Research Triangle Park, USA, 6Department of Medicine, Johns Hopkins University, Baltimore, USA, 7Department of Medicine, Boston
University, Boston, USA, 8Department of Medicine, University of California, San Diego, San Diego, USA, 9Department of Medicine, University of
Pittsburgh, Pittsburgh, USA and 10National Institutes of Health, Bethesda, MD, USA
Email: Jeanine M D'Armiento - [email protected]; Steven M Scharf - [email protected];
Michael D Roth - [email protected]; John E Connett - [email protected]; Andrew Ghio - [email protected]; David Sternberg - [email protected]; Jonathan G Goldin - [email protected]; Thomas A Louis - [email protected]; Jenny T Mao - [email protected]; George T O'Connor - [email protected]; Joe W Ramsdell - [email protected]; Andrew L Ries - [email protected]; Neil W Schluger - [email protected]; Frank C Sciurba - [email protected]; Melissa A Skeans - [email protected]; Helen Voelker - [email protected]; Robert E Walter - [email protected];
Christine H Wendt - [email protected]; Gail G Weinmann - [email protected]; Robert A Wise - [email protected]; Robert F Foronjy* - [email protected]
* Corresponding author
Abstract
Background: The major marker utilized to monitor COPD patients is forced expiratory volume in one second (FEV1). However, asingle measurement of FEV1 cannot reliably predict subsequent decline. Recent studies indicate that T lymphocytes and eosinophils are important determinants of disease stability in COPD. We therefore measured cytokine levels in the lung lavage fluid and plasma of COPD patients in order to determine if the levels of T cell or eosinophil related cytokines were predictive of the future course of the disease.
Methods: Baseline lung lavage and plasma samples were collected from COPD subjects with moderately severe airway obstruction and emphysematous changes on chest CT. The study participants were former smokers who had not had a disease exacerbation within the past six months or used steroids within the past two months. Those subjects who demonstrated stable disease over the following six months (ΔFEV1 % predicted = 4.7 ± 7.2; N = 34) were retrospectively compared with study participants who experienced a rapid decline in lung function Published: 19 November 2009
Respiratory Research 2009, 10:113 doi:10.1186/1465-9921-10-113
Received: 27 July 2009 Accepted: 19 November 2009
This article is available from: http://respiratory-research.com/content/10/1/113
© 2009 D'Armiento et al; licensee BioMed Central Ltd.
Page 2 of 13 (ΔFEV1 % predicted = -16.0 ± 6.0; N = 16) during the same time period and with normal controls
(N = 11). Plasma and lung lavage cytokines were measured from clinical samples using the Luminex multiplex kit which enabled the simultaneous measurement of several T cell and eosinophil related cytokines.
Results and Discussion: Stable COPD participants had significantly higher plasma IL-2 levels compared to participants with rapidly progressive COPD (p = 0.04). In contrast, plasma eotaxin-1 levels were significantly lower in stable COPD subjects compared to normal controls (p < 0.03). In addition, lung lavage eotaxin-1 levels were significantly higher in rapidly progressive COPD participants compared to both normal controls (p < 0.02) and stable COPD participants (p < 0.05).
Conclusion: These findings indicate that IL-2 and eotaxin-1 levels may be important markers of disease stability in advanced emphysema patients. Prospective studies will need to confirm whether measuring IL-2 or eotaxin-1 can identify patients at risk for rapid disease progression.
Background
Research has indicated that eosinophils[1] and T lym-phocytes[2,3] are important determinants of disease sta-bility in COPD patients. Given these studies, we sought to determine if eosinophil or T cell related cytokine levels measured from the lung lavage and plasma of advanced COPD patients could predict the future clinical course of their disease. Our analyses in this study were primarily focused on the role of IL-2, IL-2R, RANTES and Eotaxin-1 as these cytokines are critical regulators of T cell and eosi-nophil proliferation and migration[4,5]. Currently, there are no tests that can reliably identify which patients are more likely to deteriorate over time. Forced expiratory vol-ume in one second (FEV1) is used to diagnose the stage of chronic obstructive pulmonary disease (COPD) and to predict COPD mortality [6,7]. However, FEV1 is a physio-logic parameter that changes relatively slowly over time in COPD patients[8] and a given value of FEV1 does not accurately predict the short or long-term course of a patient's disease. The discovery of new markers that would correlate with disease severity and foretell progression would not only enable clinicians to identify susceptible patients but would also allow researchers, by monitoring marker levels, to more readily identify therapies that may have a beneficial effect on the outcome of this disease.
In this study, we retrospectively analyzed cytokine levels in the lung lavage and plasma of participants that were enrolled in the NIH-sponsored FORTE trial (Feasibility of Retinoids for the Treatment of Emphysema). The study participants were stable but advanced emphysema patients who had not smoked or had a respiratory exacer-bation for at least six months prior to study entry. At base-line and before study drug treatment, lung lavage and plasma samples were obtained from the study partici-pants who subsequently underwent extensive lung testing over a nine-month time period. To determine if eosi-nophil or T cell cytokine levels were associated with the
rate of decline of lung function, we analyzed a subset of participants who experienced a significant decline in lung function (>10% decrease in % predicted FEV1 post-bron-chodilator; n = 16) during the first six months of the study. The results obtained from this group were com-pared with study participants with stable disease (no decrease in % predicted FEV1 post-bronchodilator; n = 34), age-matched controls (plasma samples; n = 11) and non-age matched controls (lung lavage; n = 8).
Materials and methods
Selection Criteria for Study Participants
Emphysema subjects were FORTE study participants [9]. Entry criteria included age > 45 years, FEV1 25 to 80% of predicted, diffusing capacity of the lung for carbon mon-oxide (DLco) ≤ 80% of predicted, visual evidence of emphysema occupying ≥ 10% of the lung on CT scan, and willingness to undergo bronchoscopy. Participants were excluded for a Karnofsky score < 70%; excessive airway hyperreactivity; resting oxygen saturation < 90% or Pco2 >
Outline of Study Methodology
Figure 1
Outline of Study Methodology. Recruitment of non-smoking emphysema
patients
Do subjects satisfy the inclusion and exclusion
criteria Subject
excluded No
Yes Baseline bronchoscopy, plasma, pulmonary function tests, Chest CT and quality of life assessment (n=148) Randomization
LD-ATRA (26%) HD-ATRA (26%) 13-cisRA (48%) Time=0 This study used samples from this time
point
Time=6 months Repeat plasma, pulmonary
45 mm Hg; use of systemic corticosteroids within 2 months or tobacco within 6 months; hyperlipidemia; a history of clinical depression; concurrent use of medica-tions that alter the metabolism of retinoids; or other sig-nificant illnesses including cancer, liver disease, or heart failure. Women of child-bearing potential were required to use two forms of contraception or abstinence. After enrollment, baseline bronchoscopy, blood tests, Chest CT, pulmonary function tests and quality of life assess-ments were performed and then participants were rand-omized to low dose all trans-retinoic acid (LD-ATRA; 1 mg/kg), high dose ATRA (HD-ATRA; 2 mg/kg), 13-cis retinoic acid (13-cRA; 1 mg/kg) or placebo for six months (Figure 1). This study utilized the baseline plasma analy-ses that were obtained prior to study drug administration. Importantly, drug treatment had no effect on ΔFEV1, CT density score or health related quality of life in this study[9]. Figure 2 demonstrates the distribution of rate of decline of % predicted FEV1 over the first six months of the study. Of the 148 study participants, nineteen experi-enced an absolute decline of at least 10% in their pre-dicted FEV1 over the first six months of the trial. Of these nineteen participants, 16 had stored plasma samples available for further analyses with the Luminex system (ΔFEV1 % predicted = -16.0 ± 6.0). Since this study aimed to compare eosinophil and T cell cytokine patterns between subjects with progressive disease vs. stable COPD subjects, we compared this group to a subset of FORTE
subjects who demonstrated disease stability during this same time period (Δ % predicted FEV1 = 4.7 ± 7.2). Like-wise, lavage samples from the rapid decliners (n = 8 for lung lavage) were compared with lavage samples from eleven randomly selected study participants with no decline in % predicted FEV1 over the first six months. Normal controls values for plasma (n = 11) and lung lav-age (n = 8) were obtained from non-smoking volunteers that had no significant respiratory disease. Of note, at the nine month follow up time point, the rapid decliners con-tinued to demonstrate a decreased % predicted FEV1 (-7.8 ± 4.8) compared to the stable COPD participants (2.3 ± 5.1). Demographic data on all the study participants is provided in Table 1, Table 2, Table 3 and Table 4. Written consent was obtained from all study participants and the institutional review boards of all of the participating cent-ers approved the trial.
Distribution of Δ % Predicted FEV1 at the 6 Month Time Point
Figure 2
Distribution of Δ % Predicted FEV1 at the 6 Month Time Point. The bar graph represents the frequency of dis-tribution of Δ % predicted FEV1 at the six month time point. Most participants (approximately 63%) demonstrated stable disease with the % predicted FEV1 varying less than 5% from baseline. Less than 20% of participants had an absolute decline in % predicted FEV1 of 10% or greater.
Table 1: Demographics of Entire Cohort of FORTE Study Participants
FORTE Subjects
Mean Std
N 148
Age at Randomization, years 65.8 7.4
Gender, % male 58.1
Smoking HX, pack-years 57.8 29
BL Chronic cough, % subjects 24.5
BL StGeo Total Score 39.3 13.1
BL Post-BD %Pred FEV1 42.5 13.7
BL Post-BD %Pred FVC 80.1 15.7
Bronchodilator response, % changed 12.7 10.4
BL %Pred TLC 118.1 16.2
BL %Pred RV (meth A) 180.8 48.1
BL %Pred DLCO 37.1 12.0
DLCO/VA, %Pred 46.3 16.1
BL CT Score, %emph 38.5 12.8
Data is expressed as mean ± standard deviation
Page 4 of 13 Bronchoscope Procedure
Fiberoptic bronchoscopy was performed on an outpatient basis in the endoscopy units of the participating centers of this trial as per standard protocol. All participants, received albuterol 2.5 mg and atrovent 1.0 mg by hand held nebulizer prior to their bronchoscopy. During the procedure, participants had continuous monitoring of pulse oximetry, vital signs and received oxygen via nasal cannula as required. Local anesthesia was provided by administering viscous lidocaine to the nasopharynx and 2% lidocaine instilled via the bronchoscope to the vocal cords and tracheobronchial tree. Participants were sedated by use of 2-5 mg of midazolam IV at the discretion of the bronchoscopist. The bronchoscope was inserted nasally when possible, and the oral route was used as a second choice. BAL was performed by instilling 180-240 ml of saline solution into the medial or lateral segment of the right middle lobe, with a dwell time of up to 30 seconds, followed by aspiration. A target goal was to obtain a
return of at least 60 ml of lavage fluid. Following bron-choscopy, participants were observed with regular moni-toring of oximetry and vital signs. Participants were discharged after a minimum of 2 hours of observation, once safe swallowing had returned and observations were satisfactory. All were given an emergency contact number and followed up within 2 weeks. Severe adverse events were documented at the time of bronchoscopy and reported promptly to the data safety monitoring board for the trial.
Processing of Lung Lavage and Plasma Samples
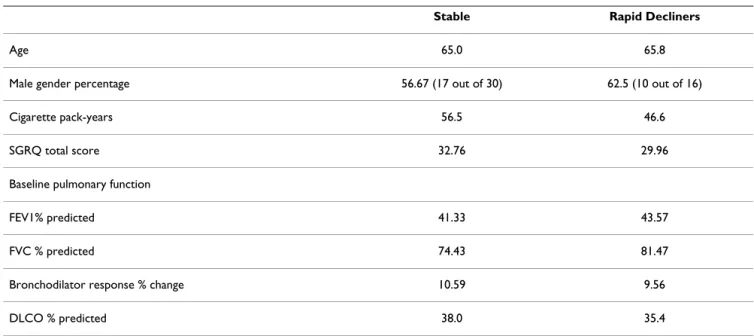
The lung lavage fluid was filtered through a sterile 100-micron nylon mesh (Falcon) to remove mucus and debris. The fluid was then centrifuged at 200 × g for 15 Table 2: Demographics of Stable and Rapidly Progressive COPD Subjects.
Stable Rapid Decliners
Age 65.0 65.8
Male gender percentage 56.67 (17 out of 30) 62.5 (10 out of 16)
Cigarette pack-years 56.5 46.6
SGRQ total score 32.76 29.96
Baseline pulmonary function
FEV1% predicted 41.33 43.57
FVC % predicted 74.43 81.47
Bronchodilator response % change 10.59 9.56
DLCO % predicted 38.0 35.4
Table 3: Demographics of Normal Controls for Plasma.
Normal Controls for Lavage
N 8
Age 24.6 ± 4.0
Sex 62.5% Male
White 87.5%
African American 12.5%
Age is represented as mean ± standard error of measurement
Table 4: Demographics of Normal Controls for Lavage.
Normal Controls for Plasma
N 11
Age 53.8 ± 13.5
Sex 63.6% Male
Smoking history 36.4%
White 63.6%
African American 18.2%
Hispanic 18.2%
minutes at 4°C. The cellular pellet was processed for RNA extraction and the lavage supernatant was aliquoted and immediately frozen at -70°C to -80°C and stored on-site. When ready for analysis, aliquots were shipped frozen to testing sites for biomarker determination. Baseline plasma samples were obtained from the study partici-pants. Approximately 30 ml of blood was obtained via venipuncture into three 10 ml heparinized tubes. These tubes were then centrifuged at 200 × g for 8 minutes at 4°C. The plasma was transferred into labeled 1.5 ml tubes and stored at -70°C to -80°C and stored on-site until they were ready to be shipped as described above.
Pulmonary Function Testing
Pre- and post-bronchodilator pulmonary function testing (PFT) was performed at the screening visit, at baseline, 3 month, 6 month and 9 month visits on all patients. Spirometry was performed pre- and post-bronchodilator at each visit while diffusing capacity (DLCO) was per-formed post BD at each visit. Pre-BD testing was done at least four hours after the use of short acting bronchodila-tors (albuterol, fenoterol) and at least 12 hours after the use of long-acting bronchodilators (theophylline or salm-eterol). Post-BD testing took place at least 15 minutes and no longer than 1 hour after 2 inhalations of albuterol. Testing was completed within sixty minutes of bronchodi-lator administration. Bronchodibronchodi-lators were administered via a metered dose inhaler under the supervision of a trained pulmonary function technologist. Spirometry was performed in adherence to ATS recommendations[10,11]. Predicted values for FEV1 were based on the prediction equations of Hankinson et al[11]. Single breath diffusing capacity (DLCO) was performed following standard tech-niques[12]. Normal reference values were derived from those of Crapo and colleagues[13]. The mean of three acceptable maneuvers is reported as the data point.
Cytokine Measurements
Plasma and lung lavage cytokines were measured using the Luminex human cytokine multiplex-25 bead array assay kit (Biosource, Camarillo, CA). This kit is able to simultaneously measure human IL-1β, IL-1Ra, IL-2, IL-2R, 4, 5, 6, 7, 8, 10, 12p40/p70, 13, IL-15, IL-17, TNF-α, IFN-α, IFN-γ, GM-CSF, MIP-1α, MIP-1β, IP-10, MIG, Eotaxin-1, RANTES, and MCP-1. The 25 mul-tiplex array was chosen since it would measure several Th1/Th2 and eosinophil related cytokines. Standard curves for each cytokine were generated by using the refer-ence cytokine concentrations supplied in this kit. Incuba-tion buffer (50 μL) and 1:2 diluted plasma or lung lavage fluid samples or standards (50 μL) were pipetted into the wells and incubated for 2 hours with the beads. All sam-ples and standards were performed in duplicate. The wells were then washed using a vacuum manifold and
bioti-nylated detector antibody was subsequently added. After 1 hour, the beads were washed again and then incubated for 30 minutes with streptavidin conjugated to the fluo-rescent protein, R-phycoerythrin (Streptavidin-RPE). After washing to remove the unbound Streptavidin-RPE, the beads (minimum of 50 beads per cytokine) were analyzed using a Luminex 100 instrument (Upstate, Temecula, CA), which monitored the spectral properties of the beads while simultaneously measuring the amount of fluores-cence associated with R-phycoerythrin. Raw data (mean fluorescence intensity, MFI) were analyzed using Master-Plex software (Upstate, Temecula, CA). Luminex analyses focused specifically on plasma IL-2 and eotaxin-1 were conducted on an additional twenty-three COPD subjects and eight normal controls. These controls were repeat samples from our first analyses that were utilized to dem-onstrate reproducibility of our results. All luminex analy-ses were conducted by Ocean Ridge Biosciences (ORB, Jupiter, Florida).
Statistical Analysis
The results are presented as the mean ± standard error for all variables that were examined. Analyses demonstrated that variances were equal for measurements of IL-2 and eotaxin-1. Comparisons between groups were done using ANOVA for non-repeated measures and significance and the null hypothesis was tested at the 5% level.
Results
Plasma Cytokine Levels in COPD Participants and Normal Controls
In our initial analyses, we examined twenty-five plasma cytokine levels (IL-1β, IL1Ra, IL2, IL2R, IL4, 5, 6, 7, -8, -10, -12p40/p70, -13, -15, -17, TNF-α, IFN-α, IFN-γ, GM-CSF, MIP-1α, MIP-1β, IP-10, MIG, Eotaxin-1, RANTES, MCP-1) and found that nineteen of these were elevated in the COPD participants (n = 11) relative to age-matched normal controls (n = 11) (Table 5). However, this elevation was statistically significant (p < 0.05) when compared to normals for only nine of these cytokines (IL-4, -5, -7, -8, IFN-α, GM-CSF, MIP-1α, MIP-1β and IP-10). IL-10 was the only cytokine that trended lower in the COPD groups although this again did not reach statistical significance.
spe-Page 6 of 13 Table 5: Comparisons between Plasma Cytokine Levels in COPD.
NORMALS (N = 11) EMPHYSEMA (N = 27) p value
IL-1β 151(55) 329(58) NS
IL-1Ra 1665(589) 2933(575) NS
IL-2* 27(11) 49(8) NS
IL-2R* 511(162) 631(95) NS
IL-4 21(9) 62(11) <0.04
IL-5 9(4) 26(5) <0.05
IL-6 47(17) 74(10) NS
IL-7 37(16) 97(13) <0.02
IL-8 10(2) 18(2) <0.04
IL-10 78(52) 47(10) NS
IL-12p40/p70 503(53) 590(60) NS
IL-13 17(9) 33(9) NS
IL-15 101(48) 171(26) NS
IL-17 46(24) 107(20) NS
TNF-α 69(22) 75(15) NS
IFN-α 70(41) 264(43) <0.02
IFN-γ 73(32) 158(26) NS
GM-CSF 192(71) 423(59) <0.04
MIP-1α 119(19) 192(20) <0.05
MIP-1β 831(235) 1771(230) <0.03
IP-10 60(12) 95(8) <0.04
MIG 505(247) 819(120) NS
EOTAXIN* 1043(237) 659(77) =0.06
RANTES 30969(4420) 33527(3411) NS
MCP-1 1931(158) 1776(98) NS
Plasma levels of 25 human cytokines were measured in COPD participants (n = 27) and age-matched normal controls (n = 11) using the Luminex 25-plex assay. Additional analyses for plasma IL-2, IL-2R and Eotaxin-1 were conducted on 6 rapid decliners and 17 stable COPD subjects. Significant changes in cytokine levels were found in nine of the examined cytokines (indicated in bold, p < 0.05). Parentheses indicate standard error of measurement.
cifically examining plasma IL-2, IL-2R and eotaxin-1 were conducted on an additional 17 stable and 6 rapidly pro-gressive COPD subjects. Individuals with stable COPD had IL-2 plasma levels (Figure 3) that were nearly three-fold increased compared to those with rapidly progressive COPD (p = 0.04) and normal controls (p = 0.11). The lev-els of IL-2 in the rapidly progressive COPD group were comparable to the levels seen in the normal controls. In contrast, there were no significant differences in IL-2R lev-els between any of the study groups (Figure 4). However, every COPD subject with a plasma 2 >100 pg/ml or IL-2R >1500 pg/ml demonstrated a stable disease course. Eotaxin-1 levels, on the other hand, were significantly lower in the stable COPD group (Figure 5) compared to normal controls (p < 0.03) and trended lower in stable COPD subjects compared to those with rapidly progres-sive disease (p = 0.11). Indeed, a plasma eotaxin-1 of >1300 pg/ml was predictive of a more rapid disease pro-gression.
Lung Lavage Cytokine Levels in COPD Patients and Controls
Of the twenty-five cytokines tested only eight (1Ra, IL-2, -6, -8, IP-10, RANTES, MCP-1 and eotaxin-1) had detectable levels within the lung lavage. Eotaxin-1, how-ever, was the only cytokine that differed significantly amongst the groups tested (see Table 7). Eotaxin-1 levels (Figure 6) were significantly higher in the rapidly progres-sive cohort compared to the stable COPD group (p = 0.04) and to normal controls (p < 0.02). In addition, the COPD participants as a group had significantly higher lev-els of eotaxin-1 than normal controls (p < 0.01). Of note,
every COPD subject with a lavage eotaxin-1 level >50 pg/ ml demonstrated rapid disease progression. Elevations in RANTES levels (Figure 7) were noted in both the stable and rapid COPD groups; however, these differences were not statistically significant.
Discussion
This study demonstrates that markers of T cell and eosi-nophilic inflammation are predictive of disease progres-sion of COPD. Individuals with stable disease have higher plasma levels of IL-2 than those with rapidly progressive COPD and lower plasma eotaxin-1 levels compared to normal controls. In addition, those COPD subjects who experienced a subsequent physiologic deterioration of their disease had markedly higher lung lavage eotaxin-1 levels compared to subjects who demonstrated disease stability over the same time interval. Together, these results suggest that measuring IL-2 and eotaxin-1 levels could enable physicians to identify those COPD patients that require more intensive monitoring and treatment in the future. Moreover, these findings indicate that cell-mediated immune responses have an important effect on the clinical status of this disease.
IL-2 is a Th1 derived cytokine that induces the prolifera-tion and activaprolifera-tion of both CD4+ and CD8+ lymphocytes. While several recent studies, have implicated T lym-phocytes in the pathogenesis[3,14] and functional decline[15,16] of COPD, the exact role they play in this disease remains ambiguous. In fact, activation of periph-eral CD4+ cells correlates positively with lung function in smokers[17]. Moreover, smokers with preserved lung function have a prominent up-regulation of T regulatory cells in the lung compared to never smokers and patients
IL-2 Levels are Increased in Stable COPD Participants
Figure 3
IL-2 Levels are Increased in Stable COPD Partici-pants. Plasma levels of IL-2 were significantly increased in stable COPD participants (black squares, n = 34) compared to subjects with rapidly progressive COPD (black triangles, n = 1) (p = 0.04) and trended higher in stable COPD subjects compared to age-matched normal controls (black circles, n = 11) (p = 0.11).
0 50 100 150 200 250
IL-2
p
g
/m
l
Normal Stable Rapid
IL-2R Levels in Stable and Rapidly Progressive Cohorts
Figure 4
IL-2R Levels in Stable and Rapidly Progressive Cohorts. Plasma levels of IL-2R were not significantly altered in any of the groups we examined though the highest IL-2R levels were measured from subjects with stable COPD (black squares).
0 1000 2000 3000 4000
Normal Stable Rapid
IL-2
R
pg/
m
Page 8 of 13 with COPD[18]. In this study we found that the Th1
cytokine IL-2 was significantly elevated in the plasma of COPD patients who demonstrated disease stability over a six-month time period. Together, these data suggest that T cell mediated immune responses can alter the physiologic progression of this disease.
IL-2 may prevent disease progression by promoting virus-specific CD4+ and CD8+ T-cell responses which deter virus replication and thereby limit the damaging effects of chronic viral infection in the lung[19]. CD8+ cells are increased in the lungs of guinea pigs with latent adenovi-ral infection[20] and this increase may act to reduce lung inflammation by suppressing active viral infection[21]. Respiratory syncytial virus (RSV) diminishes the effector activity of CD8+ cells and the development of CD8+ T cell memory[22]. This effect, however, can be reversed by IL-2[23] thus preventing recurrent infection with this com-mon pathogen in patients with COPD[24,25]. In addition to viruses, cytotoxic lymphocyte responses, which are coordinated by CD4+ cells, exert an important role in defending against H. influenza infections in the lung[26]. In fact, studies in mice demonstrate that cigarette smoke alters T cell function which can render the animal more susceptible to infection [27]. Thus, we postulate that enhanced T cell responses in our stable COPD cohort may
have acted to prevent disease progression by limiting the pathogenicity of bacterial and viral infections within the lung.
Another means by which IL-2 may influence disease pro-gression is by regulating the survival of T cells[28]. In cul-ture, IL-2 promotes T cell survival in part by inducing the expression of Bcl-2, a protein that protects from passive apoptotic cell death (PCD)[29,30]. T lymphocyte apopto-sis is increased both in the peripheral blood[31] and lung lavage[32] of COPD patients. The loss of these T cells can render the lung susceptible to infections[33,34] thereby increasing the likelihood of disease exacerbations, an important factor in the progression of the disease[35]. In addition, the uncleared apoptotic cells can injure the lung by releasing proteases and other harmful intracellular contents[36]. These damaging effects are accentuated by the fact that pulmonary macrophages from COPD patients have a defect in their ability to phagocytose apop-totic cells in the lung[37]. Conversely, it is conceivable that IL-2 protects the lung by actually stimulating the apoptosis of auto-reactive T lymphocytes. IL-2 has been shown to program mouse lymphocytes for apoptosis and mice deficient in IL-2Rα are resistant to Fas-mediated acti-vation induced cell death (AICD)[38]. Actiacti-vation induced cell death is a critical process for maintaining self-toler-ance[39]. IL-2 by activating AICD can eliminate autoreac-tive T cells and prevent the development of inflammatory responses to self antigens which are capable of generating emphysematous changes in the lung[40].
In contrast to IL-2, increases in eotaxin-1 were associated with disease progression in COPD. We found significant increases in lung lavage eotaxin-1 levels in COPD patients compared to normal controls. More importantly, those patients whose lung function subsequently declined over the ensuing six months had significantly higher lavage eotaxin-1 levels than those subjects with stable lung func-tion over the same time period. In addifunc-tion, disease stabil-ity was associated with decreased plasma eotaxin-1 levels. Eotaxin-1 is a CC chemokine (CCL11) that binds to the CC chemokine receptor 3 (CCR3) on the surface of eosi-nophils thereby inducing eosinophil activation[41] and migration[42]. Lung eosinophilia has been linked with bronchial hyperreactivity in COPD patients[1]. Moreover, the expression of both eotaxin-1 and CCR3 is up regulated during exacerbations of chronic bronchitis[43] and eotaxin-1 levels are associated with bronchodilator response and the extent of emphysema on CT scans[44]. Coupled with these previous findings, our data indicate that eotaxin-1-mediated lung eosinophilia may be a criti-cal factor in the progression of this disease.
Eotaxin-1 Levels are Decreased in Subjects with Stable COPD
Figure 5
Eotaxin-1 Levels are Decreased in Subjects with Sta-ble COPD. Plasma levels of eotaxin-1 were significantly lower in stable COPD participants (black squares, n = 34) compared to age-matched normal controls (black circles, n = 11) (p < 0.04). In addition, subjects with rapidly progressive COPD (black triangles, n = 16) tended to have higher levels compared to those with stable disease though this difference did not reach statistical significance (p = 0.11).
0 1000 2000 3000
Normal Stable Rapid
P
la
s
m
a
E
o
ta
x
in
pg
/m
Table 6: Comparison of Plasma Cytokine Levels between Rapid Decliners Stable COPD Participants and Normal Controls.
NORMALS (N = 11) STABLE (N = 17) DECLINERS (N = 10) p value Stable vs. Rapid
p value Stable vs. Normals
IL-1β 151(55) 414(104) 184(61) <0.06 <0.03
IL-1Ra 1665(589) 3514(1078) 1945(598) NS NS
IL-2* 28(12) 62(11) 25(7) <0.04 =0.10
IL-2R* 511(162) 700(128) 495(97) NS NS
IL-4 21(9) 70(22) 48(11) NS <0.04
IL-5 9(4) 32(9) 16(4) NS <0.03
IL-6 47(17) 85(20) 56(10) NS NS
IL-7 37(16) 101(25) 97(13) NS <0.03
IL-8 10(2) 20(4) 15(2) NS <0.03
IL-10 78(52) 51(17) 40(16) NS NS
IL-12p40/p70 503(53) 592(117) 586(58) NS NS
IL-13 17(9) 42(16) 19(8) NS NS
IL-15 101(48) 203(51) 117(20) NS NS
IL-17 46(24) 123(38) 80(18) NS NS
TNF-α 69(22) 88(28) 53(12) NS NS
IFN-α 70(41) 308(83) 188(48) NS <0.02
IFN-γ 73(32) 187(50) 109(22) NS <0.05
GM-CSF 192(71) 463(120) 356(63) NS <0.05
MIP-1α 119(19) 206(36) 168(30) NS <0.04
MIP-1β 831(235) 1976(431) 1422(243) NS <0.03
IP-10 60(12) 88(11) 106(18) NS <0.05
MIG 505(247) 941(235) 610(87) NS NS
EOTAXIN* 1043(237) 572(128) 834(164) =0.11 <0.04
RANTES 30969(4420) 30066(4135) 39411(7420) NS NS
MCP-1 1931(158) 1771(181) 1785(129) NS NS
*N = 34 stable COPD subjects, 16 rapid COPD subjects and 11 normal controls Data is reported as mean ± standard error of measurement
The standard error of measurement is in parentheses
Page 10 of 13 It is important to note that all the study participants at baseline were former smokers who were clinically stable and had no signs of exacerbation or recent infection. In fact, the presence of an exacerbation was an exclusion cri-terion for the trial. Thus, we cannot ascribe the subse-quent decline in FEV1 in the rapid decliners to the presence of disease exacerbation or inherent differences with the stable COPD cohort. Indeed, both the rapid decliners and stable COPD subjects selected for these studies had GOLD IIB disease with visual evidence of emphysema occupying ≤ 10% of the lung on CT scan. The subjects did not use steroids for at least two months prior to study entry and did not have excessive airway hyperre-activity during bronchodilator testing. Similarly, our study findings cannot be attributed to the study drug-retinoic acid. Plasma and lavage measurements were taken at baseline prior to initiation of retinoic acid and retinoic acid itself had no impact on any of the physio-logic, radiographic or quality of life measures at the six or nine-month time point[9].
Given the multiple analyses that were conducted it is con-ceivable that the changes in IL-2 may have occurred by chance. However, further plasma IL-2 analyses on an additional 6 rapid decliners and 17 stable COPD subjects confirmed the differences between these two groups. However, prospective analyses will be needed to validate these results and determine if these findings can be extrap-olated to a more heterogeneous population of COPD sub-jects. A strength of this study is that it contains both plasma and lung lavage analyses on a well-characterized cohort of previously stable advanced emphysema sub-jects. The literature regarding the impact of T cell and eosi-nophil related cytokines in advanced emphysema is limited-particularly for lung lavage. In fact, this is one of the only studies to examine the relationship between a lung lavage biomarker and subsequent rate of decline of lung function in COPD[45]. Thus, our findings provide important novel evidence that these cell types are involved in the progression of the disease.
Conclusion
In summary, in this study we have identified distinct dif-ferences in cytokines levels in advanced emphysema patients whose disease progressed rapidly over a six-month time period. The changes in IL-2 and eotaxin-1 suggest that alterations in T lymphocyte and eosinophil trafficking in the lung could be important factors affecting the stability of this disease. If confirmed in a larger pro-spective trial, these results could lead to the development of useful clinical biomarkers that could accurately predict the future course of the disease. This would not only
per-Lung Lavage RANTES Levels in COPD Subjects, Asthmatics and Normal Controls
Figure 7
Lung Lavage RANTES Levels in COPD Subjects, Asthmatics and Normal Controls. Lung lavage RANTES levels were measured in stable COPD participants (black squares, n = 11), rapidly progressive COPD participants (black triangles, n = 9) and normal controls (black circles, n = 8) using the Luminex 25-plex assay. Increases were seen in both cohorts of COPD; however, these differences did not reach statistical significance.
Norm al Stab le Rapi d -50 0 50 100 150 La v a ge R a nt e s pg/ m l
Lung Lavage Eotaxin-1 Levels in COPD Subjects, Asthmatics and Normal Controls
Figure 6
Lung Lavage Eotaxin-1 Levels in COPD Subjects, Asthmatics and Normal Controls. Lung lavage Eotaxin-1 levels measured using the Luminex 25-plex assay were signif-icantly higher in rapidly progressive COPD participants (black triangles, n = 9) compared to normal controls (black circles, n = 8) (p < 0.03). In addition, levels in participants with rapidly progressive COPD had higher levels than partic-ipants with stable COPD (black squares, n = 11) (p < 0.05).
mit clinicians to ascertain which patients require closer observation but would also provide researchers with a sur-rogate endpoint to detect clinically important responses to therapies.
List of Abbreviations
CT: Computed Tomography; BAL: bronchoscopic alveolar lavage; FEV1: Forced expiratory volume in one second; COPD: chronic obstructive pulmonary disease; MMPs: matrix metalloproteinases; PFT's: pulmonary function tests; HRCT: high resolution computed tomography; RANTES: Regulated upon activation, normal T cell expressed and secreted; AICD: Activation Induced Cell Death; PCD: Passive Cell Death.
Competing interests
The authors declare that they have no competing interests.
Authors' contributions
JD contributed to the study design and the acquisition and interpretation of data.
SS contributed significantly to the study design and execu-tion and aided in the preparaexecu-tion of the manuscript and the statistical analysis of the data.
MR contributed to the study design and analysis of data.
JC helped to design the study and analyze the data. AG was instrumental in collecting clinical samples for the study.
DS was instrumental in collecting clinical samples for the study.
JG contributed significantly to the study design and execu-tion.
TL contributed significantly to the study design and execu-tion.
JM contributed significantly to the study design and exe-cution.
GO contributed significantly to the study design and exe-cution and preparation of the manuscript.
HV contributed to the statistical analysis of the data.
JR contributed significantly to the study design and execu-tion and aided in the preparaexecu-tion of the manuscript.
AR contributed significantly to the study design and exe-cution and aided in the preparation of the manuscript.
NS contributed significantly to the study design and exe-cution. FS contributed significantly to the study design and execution. MS contributed significantly to the study design and execution. RW contributed significantly to the study design and execution. CW contributed significantly to the study design and execution. GW contributed signif-icantly to the study design and execution. RAW contrib-uted significantly to the study design and execution and aided in the preparation of the manuscript.
RF contributed significantly to the study design and execu-tion. In addition, he prepared the manuscript and the sta-tistical analysis of the data.
Acknowledgements
Support for the FORTE Study was provided by the National Heart, Lung, and Blood Institute (NHLBI), contracts NO1-HR-96140 (PI: Dr. Connett); NO1-HR-96141-001 (PI: Dr. O'Connor); NO1-HR-96144 (PI: Dr. Ram-sdell); NO1-HR-96143 (PI: Dr. Roth); NO1-HR-96145 (PI: Dr. Schluger); and NO1-HR-96142 (PI: Dr. Sciurba). Further support was provided by NHLBI R01HL086936-03 (PI: Dr. D'Armiento); The Flight Attendant Med-ical Research Institute (PI: Dr. Foronjy) and the Jo-Ann F. LeBuhn Center for Chest Disease.
Table 7: Lung Lavage Cytokine Levels
IL-1Ra IL-2 IL-6 IL-8 IP-10 RANTES MCP-1 Eotaxin
Rapid COPD 30.1(36.7) 27.4(43.2) 31.7(38.0) 32.7(23.9) 24.8(17.7) 28.0(28.1) 25.3(37.6) 30.6(34.3)
Stable COPD 9.0(22.3) 13.6(37.0) 20.6(38.2) 18.0(25.4) 15.8(17.6) 22.6(38.0) 8.3(23.4) 5.9(13.2)
Normal Controls 16.4(39.0) 27.5(51.3) 16.6(47.0) 38.2(36.3) 39.3(29.3) 6.6(18.6) 9.3(26.2) 0(0)
n = 9 for rapid decliners, n = 11 for stable COPD subjects, n = 8 for normal controls Data is reported as mean ± standard error of measurement
The standard error of measurement is in parentheses
Page 12 of 13
References
1. Perng DW, Huang HY, Chen HM, Lee YC, Perng RP: Characteris-tics of airway inflammation and bronchodilator reversibility in COPD: a potential guide to treatment. Chest 2004,
126(2):375-381.
2. Sullivan AK, Simonian PL, Falta MT, Mitchell JD, Cosgrove GP, Brown KK, Kotzin BL, Voelkel NF, Fontenot AP: Oligoclonal CD4+ T cells in the lungs of patients with severe emphysema. Am J Respir Crit Care Med 2005, 172(5):590-596.
3. Tzanakis N, Chrysofakis G, Tsoumakidou M, Kyriakou D, Tsiligianni J, Bouros D, Siafakas NM: Induced sputum CD8+ T-lymphocyte subpopulations in chronic obstructive pulmonary disease.
Respir Med 2004, 98(1):57-65.
4. Wei S, Kryczek I, Zou W: Regulatory T-cell compartmentaliza-tion and trafficking. Blood 2006, 108(2):426-431.
5. Lintomen L, Franchi G, Nowill A, Condino-Neto A, de Nucci G, Zanesco A, Antunes E: Human eosinophil adhesion and degran-ulation stimulated with eotaxin-1 and RANTES in vitro: lack of interaction with nitric oxide. BMC Pulm Med 2008, 8:13. 6. Decramer M, Rutten-van Molken M, Dekhuijzen PN, Troosters T, van
Herwaarden C, Pellegrino R, van Schayck CP, Olivieri D, Del Donno M, De Backer W, et al.: Effects of N-acetylcysteine on outcomes in chronic obstructive pulmonary disease (Bronchitis Rand-omized on NAC Cost-Utility Study, BRONCUS): a ran-domised placebo-controlled trial. Lancet 2005,
365(9470):1552-1560.
7. Anthonisen NR, Connett JE, Murray RP: Smoking and lung func-tion of Lung Health Study participants after 11 years. Am J Respir Crit Care Med 2002, 166(5):675-679.
8. Fletcher C, Peto R: The natural history of chronic airflow obstruction. Br Med J 1977, 1(6077):1645-1648.
9. Roth MD, Connett JE, D'Armiento JM, Foronjy RF, Friedman PJ, Gol-din JG, Louis TA, Mao JT, Muindi JR, O'Connor GT, et al.: Feasibility of retinoids for the treatment of emphysema study. Chest
2006, 130(5):1334-1345.
10. Society AT: Lung Function Testing: Selection of Reference Values From a Sample of the General US Population. Amer-can Review of Respiratory Diseases 1991, 1444:1202-1206.
11. Hankinson JL, Odencrantz JR, Fedan KB: Spirometric reference values from a sample of the general U.S. population. Am J Respir Crit Care Med 1999, 159(1):179-187.
12. Standards for the diagnosis and care of patients with chronic obstructive pulmonary disease. American Thoracic Society.
Am J Respir Crit Care Med 1995, 152(5 Pt 2):S77-121.
13. Crapo RO, Morris AH: Standardized single breath normal val-ues for carbon monoxide diffusing capacity. Am Rev Respir Dis
1981, 123(2):185-189.
14. Saetta M, Baraldo S, Corbino L, Turato G, Braccioni F, Rea F, Caval-lesco G, Tropeano G, Mapp CE, Maestrelli P, et al.: CD8+ve cells in the lungs of smokers with chronic obstructive pulmonary disease. Am J Respir Crit Care Med 1999, 160(2):711-717.
15. O'Shaughnessy TC, Ansari TW, Barnes NC, Jeffery PK: Inflamma-tion in bronchial biopsies of subjects with chronic bronchitis: inverse relationship of CD8+ T lymphocytes with FEV1. Am J Respir Crit Care Med 1997, 155(3):852-857.
16. Saetta M, Di Stefano A, Turato G, Facchini FM, Corbino L, Mapp CE, Maestrelli P, Ciaccia A, Fabbri LM: CD8+ T-lymphocytes in peripheral airways of smokers with chronic obstructive pul-monary disease. Am J Respir Crit Care Med 1998, 157(3 Pt 1):822-826.
17. Glader P, von Wachenfeldt K, Lofdahl CG: Systemic CD4+ T-cell activation is correlated with FEV1 in smokers. Respir Med
2006, 100(6):1088-1093.
18. Barcelo B, Pons J, Ferrer JM, Sauleda J, Fuster A, Agusti AG: Pheno-typic characterisation of T-lymphocytes in COPD: abnormal CD4+CD25+ regulatory T-lymphocyte response to tobacco smoking. Eur Respir J 2008, 31(3):555-562.
19. Doherty PC, Topham DJ, Tripp RA, Cardin RD, Brooks JW, Steven-son PG: Effector CD4+ and CD8+ T-cell mechanisms in the control of respiratory virus infections. Immunol Rev 1997,
159:105-117.
20. Meshi B, Vitalis TZ, Ionescu D, Elliott WM, Liu C, Wang XD, Hayashi S, Hogg JC: Emphysematous lung destruction by cigarette smoke. The effects of latent adenoviral infection on the lung
inflammatory response. Am J Respir Cell Mol Biol 2002,
26(1):52-57.
21. Chakrabarti S, Mautner V, Osman H, Collingham KE, Fegan CD, Klap-per PE, Moss PA, Milligan DW: Adenovirus infections following allogeneic stem cell transplantation: incidence and outcome in relation to graft manipulation, immunosuppression, and immune recovery. Blood 2002, 100(5):1619-1627.
22. Chang J, Braciale TJ: Respiratory syncytial virus infection sup-presses lung CD8+ T-cell effector activity and peripheral CD8+ T-cell memory in the respiratory tract. Nat Med 2002,
8(1):54-60.
23. Chang J, Choi SY, Jin HT, Sung YC, Braciale TJ: Improved effector activity and memory CD8 T cell development by IL-2 expression during experimental respiratory syncytial virus infection. J Immunol 2004, 172(1):503-508.
24. Rohde G, Wiethege A, Borg I, Kauth M, Bauer TT, Gillissen A, Bufe A, Schultze-Werninghaus G: Respiratory viruses in exacerba-tions of chronic obstructive pulmonary disease requiring hospitalisation: a case-control study. Thorax 2003, 58(1):37-42. 25. Seemungal T, Harper-Owen R, Bhowmik A, Moric I, Sanderson G, Message S, Maccallum P, Meade TW, Jeffries DJ, Johnston SL, et al.:
Respiratory viruses, symptoms, and inflammatory markers in acute exacerbations and stable chronic obstructive pul-monary disease. Am J Respir Crit Care Med 2001,
164(9):1618-1623.
26. King PT, Ngui J, Farmer MW, Hutchinson P, Holmes PW, Holdsworth SR: Cytotoxic T lymphocyte and natural killer cell responses to non-typeable Haemophilus influenzae. Clin Exp Immunol
2008, 152(3):542-551.
27. Robbins CS, Franco F, Mouded M, Cernadas M, Shapiro SD: Ciga-rette smoke exposure impairs dendritic cell maturation and T cell proliferation in thoracic lymph nodes of mice. J Immunol
2008, 180(10):6623-6628.
28. Nelson BH, Willerford DM: Biology of the interleukin-2 recep-tor. Adv Immunol 1998, 70:1-81.
29. Mor F, Cohen IR: IL-2 rescues antigen-specific T cells from radiation or dexamethasone-induced apoptosis. Correlation with induction of Bcl-2. J Immunol 1996, 156(2):515-522. 30. Mueller DL, Seiffert S, Fang W, Behrens TW: Differential
regula-tion of bcl-2 and bcl-x by CD3, CD28, and the IL-2 receptor in cloned CD4+ helper T cells. A model for the long-term survival of memory cells. J Immunol 1996, 156(5):1764-1771. 31. Hodge S, Hodge G, Holmes M, Reynolds PN: Increased peripheral
blood T-cell apoptosis and decreased Bcl-2 in chronic obstructive pulmonary disease. Immunol Cell Biol 2005,
83(2):160-166.
32. Hodge S, Hodge G, Holmes M, Reynolds PN: Increased airway epi-thelial and T-cell apoptosis in COPD remains despite smok-ing cessation. Eur Respir J 2005, 25(3):447-454.
33. de Bree GJ, Heidema J, van Leeuwen EM, van Bleek GM, Jonkers RE, Jansen HM, van Lier RA, Out TA: Respiratory syncytial virus-spe-cific CD8+ memory T cell responses in elderly persons. J Infect Dis 2005, 191(10):1710-1718.
34. Robbins CS, Dawe DE, Goncharova SI, Pouladi MA, Drannik AG, Swirski FK, Cox G, Stampfli MR: Cigarette smoke decreases pul-monary dendritic cells and impacts antiviral immune responsiveness. Am J Respir Cell Mol Biol 2004, 30(2):202-211. 35. Papi A, Bellettato CM, Braccioni F, Romagnoli M, Casolari P,
Cara-mori G, Fabbri LM, Johnston SL: Infections and airway inflamma-tion in chronic obstructive pulmonary disease severe exacerbations. Am J Respir Crit Care Med 2006, 173(10):1114-1121. 36. Vandivier RW, Henson PM, Douglas IS: Burying the dead: the impact of failed apoptotic cell removal (efferocytosis) on chronic inflammatory lung disease. Chest 2006,
129(6):1673-1682.
37. Hodge S, Hodge G, Scicchitano R, Reynolds PN, Holmes M: Alveolar macrophages from subjects with chronic obstructive pulmo-nary disease are deficient in their ability to phagocytose apoptotic airway epithelial cells. Immunol Cell Biol 2003,
81(4):289-296.
Publish with BioMed Central and every scientist can read your work free of charge
"BioMed Central will be the most significant development for disseminating the results of biomedical researc h in our lifetime."
Sir Paul Nurse, Cancer Research UK
Your research papers will be:
available free of charge to the entire biomedical community
peer reviewed and published immediately upon acceptance
cited in PubMed and archived on PubMed Central
yours — you keep the copyright
Submit your manuscript here: BioMedcentral 39. Van Parijs L, Abbas AK: Homeostasis and self-tolerance in the
immune system: turning lymphocytes off. Science 1998,
280(5361):243-248.
40. Taraseviciene-Stewart L, Scerbavicius R, Choe KH, Moore M, Sullivan A, Nicolls MR, Fontenot AP, Tuder RM, Voelkel NF: An animal model of autoimmune emphysema. Am J Respir Crit Care Med
2005, 171(7):734-742.
41. Ponath PD, Qin S, Post TW, Wang J, Wu L, Gerard NP, Newman W, Gerard C, Mackay CR: Molecular cloning and characterization of a human eotaxin-1 receptor expressed selectively on eosi-nophils. J Exp Med 1996, 183(6):2437-2448.
42. Ponath PD, Qin S, Ringler DJ, Clark-Lewis I, Wang J, Kassam N, Smith H, Shi X, Gonzalo JA, Newman W, et al.: Cloning of the human eosinophil chemoattractant, eotaxin-1. Expression, receptor binding, and functional properties suggest a mechanism for the selective recruitment of eosinophils. J Clin Invest 1996,
97(3):604-612.
43. Bocchino V, Bertorelli G, Bertrand CP, Ponath PD, Newman W, Franco C, Marruchella A, Merlini S, Del Donno M, Zhuo X, et al.:
Eotaxin-1 and CCR3 are up-regulated in exacerbations of chronic bronchitis. Allergy 2002, 57(1):17-22.
44. Miller M, Ramsdell J, Friedman PJ, Cho JY, Renvall M, Broide DH:
Computed tomographic scan-diagnosed chronic obstructive pulmonary disease-emphysema: eotaxin-1 is associated with bronchodilator response and extent of emphysema. J Allergy Clin Immunol 2007, 120(5):1118-1125.
45. Barnes PJ, Chowdhury B, Kharitonov SA, Magnussen H, Page CP, Postma D, Saetta M: Pulmonary biomarkers in chronic obstruc-tive pulmonary disease. Am J Respir Crit Care Med 2006,