The influence of using different reconstruction algorithms on sensitivity
of quantitative
18F-FDG-PET volumetric measures to background
activity variation
Ali Ketabi
1,2, Pardis Ghafarian
3,4, Mohammad Amin Mosleh-Shirazi
5,
Seyed Rabi Mahdavi
6, Mohammad Reza Ay
1,21
Department of Medical Physics and Biomedical Engineering, Tehran University of Medical Sciences, Tehran, Iran
2Research Center for Molecular and Cellular Imaging, Tehran University of Medical Sciences, Tehran, Iran 3Chronic Respiratory Diseases Research Center, National Research Institute of Tuberculosis and Lung Diseases,
Shahid Beheshti University of Medical Sciences, Tehran, Iran
4PET/CT and Cyclotron Center, Masih Daneshvari Hospital, Shahid Beheshti University of Medical Sciences,
Tehran, Iran
5
Medical Imaging Research Center and Physics Unit, Department of Radiotherapy and Oncology, Namazi Hospital, Shiraz University of Medical Sciences, Shiraz, Iran
6
Department of Medical Physics, Faculty of Medicine, Iran University of Medical Sciences, Tehran, Iran
(Received 7 October 2017, Revised 9 February 2018, Accepted 12 February 2018)
ABSTRACT
Introduction: This study aims to investigate the influence of background activity variation on image quantification in differently reconstructed PET/CT images.
Methods: Measurements were performed on a Discovery-690 PET/CT scanner using a custom-built NEMA-like phantom. A background activity level of 5.3 and 2.6 kBq/ml 18F-FDG were applied. Images were reconstructed employing four different reconstruction algorithms: HD (OSEM with no PSF or TOF), PSF only, TOF only, and TOFPSF, with Gaussian filters of 3 and 6.4 mm in FWHM. SUVmax and SUVpeak were obtained and used as cut-off thresholding; Metabolic Tumor Volume (MTV) and Total Lesion Glycolysis (TLG) were measured. The volume recovery coefficients (VRCs), the relative percent error (ΔMTV), and Dice similarity coefficient were assessed with respect to true values.
Results: SUVmax and SUVpeak decreased and MTV increased as function of increasing the background dose. The most differences occur in smaller volumes with 3-mm filter; Non-TOF and Non-PSF reconstruction methods were more sensitive to increasing the background activity in the smaller and larger volumes, respectively. The TLG values were affected in the small lesions (decrease up to 12%). In a range of target volumes, differences between the mean ΔMTV in the high and low background dose varied from -11.8% to 7.2% using SUVmax and from 2.1% to 7.6% using SUVpeak inter reconstruction methods.
Conclusion: The effect of the background activity variation on SUV-based quantification in small lesion was more noticeable than large lesion. The HD and TOFPSF algorithms had the lowest and the highest sensitivity to background activity, respectively.
Key words:18F-FDG-PET/CT; Background activity; Image reconstruction; MTV; TLG
Iran J Nucl Med 2018;26(2):87-97
Published: July, 2018 http://irjnm.tums.ac.ir
Corresponding author: Dr Mohammad Reza Ay, Department of Medical Physics and Biomedical Engineering, Tehran University of Medical Sciences, Tehran, Iran. E-mail: [email protected]
O
ri
g
inal
A
rti
cl
Ir
an
J
N
u
cl
Me
d
20
1
8
,
V
ol
26,
No
2
(
S
er
ial
N
o
51
)
h
tt
p:
//
ir
jn
m
.tu
m
s.a
c.ir
Ju
ly
,
20
18
88
INTRODUCTION
Positron emission tomography (PET) based molecular imaging, as a tool with the potential to improve diagnosis of cancer, determining tumor volume and localization, treatment planning and/or treatment response assessment, plays an increasingly valuable role in radiation oncology [1-3]. During the past two
decades, the glucose analogue 18
F-Fluorodeoxyglucose (FDG) as an appropriate radiotracer was applied.
In the most studies, the maximum standardized uptake value (SUVmax) is the most widely used index for tissue accumulation of 18F-FDG to quantification of normal and tumor tissues [1]. Peak SUV (SUVpeak) has been suggested as a more robust alternative to SUVmax in cancer studies reports, as well [1]. The use of SUVs is easy, but these rely on a single (or few) voxels and do not reflect the metabolic information of the whole tumor volume. Unlike SUVs, Metabolic tumor volume (MTV) depicts the tumor biological target volume [4]. MTV is a SUV-based parameter which defined as the volume of tumor tissues consists of the total number of voxels that have uptake above a predetermined SUV threshold. Recently, studies have consistently reported MTV can provide valuable prognostic information, and may better reflect the overall tumor burden for various neoplasms from surrounding normal tissues compared with SUVs and conventional anatomic approaches [1, 5-8]. MTV does not indicate the clonogenic cells density within the tumor volume; Total Lesion Glycolysis (TLG) is another quantitative volumetric metrics that combines the volumetric and metabolic information defined as MTV multiplied with the average SUV (SUVmean, which is an index of the clonogenic cells density) [9, 10].
Recently, it has been demonstrated that combined PET/computed tomography (CT) imaging is feasible and useful for PET/CT-guided radiation therapy planning [2, 3, 11]. Advanced treatment techniques such as PET-based intensity-modulated radiation therapy, allow additional dose escalation (i.e. dose-painting by intensity-modulated radiation therapy) to improve tumor control probability without increasing organ at risks toxicity but rely on reliable tumor volume delineation based on accurate molecular imaging [3, 12-14]. PET/CT imaging-based dose painting is a concept to prescription and delivery of non-uniform radiation dose which radiation dose is shaped according to the PET uptake [15, 16]. Also, the extraction and characterization of various volumetric textural features (Radiomics) with analysis of PET/CT images was suggested for tumor response assessment [17, 18]. Therefore, such applications relied on an accurate segmentation and reliable delineation of the tumor volume and treatment response assessment [19-22].
At present, the use of fixed thresholding-based methods of the SUVs (especially SUVmax) is more common in clinical FDG-PET/CT imaging and hold a significant role in biological target delineation and assessing patient response to cancer therapy [23, 24]. PET-CT based biological target delineation remains highly variable and it is still subject to debate [25, 26]. It is known that PET/CT segmentation and reconstruction algorithms can lead to significant differences in measuring MTV and accurate tumor delineation [25, 27]. One that can affect the extracted biological target volume from both segmentation and reconstruction algorithms is the additional background FDG uptake by the tumor surrounding tissues, which can affect SUV-based parameter and lead to significant noise, contrast loss and some uncertainties in tumor burden detection and accurate tumor delineation [28-30].
The impact of several factors such as the tumor size, the image reconstruction methods used for image generation or the tumor to background ratio has been evaluated in a number of studies on oncological patients [25, 31-33]. Background or surrounding normal tissues activity uptake in patients is unavoidable and can vary greatly between organs [29], and it should be taken into account during PET/CT based target volume delineation [34]. In particular there are limited publications about the impact of background activity of the surrounding normal tissues on volumetric parameters when using different reconstruction methods, moreover, typical evaluation approaches in the assessment of volumetric accuracy or overlap measures (such as volume recovery coefficient, dice similarity coefficient, and etc.) were proposed [35].
In the current work, we used the 18F-FDG-PET images of a custom-built NEMA-like phantom to determine the influence of background activity variation on quantification of SUV and variability of SUV-based volumetric parameters (including MTV and TLG) in the PET images reconstructed using different reconstruction parameters. Both SUVmax and SUVpeak are applied as image indices for thresholding.
METHODS
Data acquisition and image reconstruction
Ir
an
J
N
u
cl
Me
d
20
1
8
,
V
ol
26,
No
2
(
S
er
ial
N
o
51
)
h
tt
p:
//
ir
jn
m
.tu
m
s.a
c.ir
Ju
ly
,
20
18
89 The standard 3D iterative HD algorithm with
post-smoothing Gaussian filter 3 and 6.4 mm in the full width at half maximum (FWHM) was applied (HD3 and HD6.4, respectively). In addition, PSF, TOF, and TOFPSF which incorporates the PSF and/or TOF within the standard HD algorithm were used with post-smoothing Gaussian filter 3 and 6.4mm FWHM
(PSF3, PSF6.4; TOF3, TOF6.4; TOFPSF3,
TOFPSF6.4, respectively). In total, 8 different PET/CT reconstructions methods with the same raw data were available. HD6.4 was applied as the default reconstruction method with 3 iterations and 18 subsets. For all datasets, TOF reconstructions were performed with 2 iterations and 18 subsets and non-TOF reconstructions were performed with 3 iterations and 18 subsets. 10 min for each bed position was used in all reconstruction methods. The coincidence time window was 4.1 ns, and the TOF time resolution was 555 ps. The image matrix was 256 ×256; in-plane voxel size was always 2.73 × 2.73 mm (with slice thickness 3.27 mm).The CT data with 120 kV and 100 mA were acquired for attenuation correction.
Phantom studies
Imaging protocol: A custom-made phantom,
resembling the National Electrical Manufacturers Association (NEMA) image quality phantom with six fillable cylinders was used for all measurements. The cylinders with 25 mm height and diameter of 10, 13, 17, 22, 28 and 37 mm were initially filled with a solution of 18F-FDG with the background activity level of 5.3 kBq / ml and a tumor-to-background ratio of 4:1. To determine the impact of low-dose background activity, the activity decay time was subsequently calculated to reach the background activity level of 2.6 kBq / ml. Laser markers were used for the phantom positioning in the center of the PET/CT scanner field of view. Measurements were performed over two bed positions in 3-dimensional list mode with 10 min per a bed scan.
Data analysis: The SUV normalized to body mass
were calculated for all reconstruction methods. Later, The SUVmax and the SUVpeak were calculated: The SUVmax was a voxel with the highest intensity in each target volume; SUVpeak was calculated using a 3-dimensional 1.0 ml spherical VOI which was positioned on a high-uptake region within the tumor such that the average value is maximized [36].
MTV was calculated by thresholding-based image segmentation methods with the 50% cutoff thresholding value for all reconstruction at two background activity level. This cutoff thresholding value was chosen as the threshold ratio to achieve MTV closest to the actual volume [36]. MTV was extracted from the voxels inscribed with the VOI on the condition SUV ≥ 50% × SUVmax.
The size of the VOI was considered the same as the physical shape of cylinders in the phantom.
The actual cylinders volumes were measured and with respect to the true volume, volumetric accuracy in each specific tumor size was calculated using the volume recovery coefficient (VRC), defined as the following equation:
VRC = MTV𝑟𝑒𝑐𝑜𝑛.𝑖 True Volume𝑗
Eq. 1
Here, MTVrecon.i refers to the MTV corresponding to the ith reconstruction method; True Volume
j refers to the actual size of jth cylinder volume. The actual volumes for each cylinder correspond to its known physical volume were 2, 3.5, 5.5, 10.5, 16, and 28.5 cm3 for volume with the diameter of 10, 13, 17, 22, 28 and 37 mm, respectively.
The relative percent error in volume (called ΔMTV) with respect to true volume was calculated as follows:
ΔMTV = MTV𝑟𝑒𝑐𝑜𝑛.𝑖− True Volume𝑗 True Volume𝑗
× 10 Eq. 2
In addition, the overlap between reconstructions and real target volumes were calculated by Dice’s similarity coefficient (DSC) [37]:
DSC =2(MTVMTV𝑟𝑒𝑐𝑜𝑛.𝑖∩ True Volume𝑗)
𝑟𝑒𝑐𝑜𝑛.𝑖+True Volume𝑗 × 100 Eq. 3
Target size-dependent comparison: In order to
compare the inter-method variability at two background activity level with considering the tumor sizes, MTV and subsequently VRC, ΔMTV, and Dice’s similarity coefficient were calculated. Later, the quantitative value of TLG was obtained to assess the impact of background activity variation on clonogenic cells density calculation. TLG was defined as the MTV multiplied with the average SUV (SUVmean) in the MTV.
Target size-independent comparison: To assess the
Ir
an
J
N
u
cl
Me
d
20
1
8
,
V
ol
26,
No
2
(
S
er
ial
N
o
51
)
h
tt
p:
//
ir
jn
m
.tu
m
s.a
c.ir
Ju
ly
,
20
18
90
RESULTS
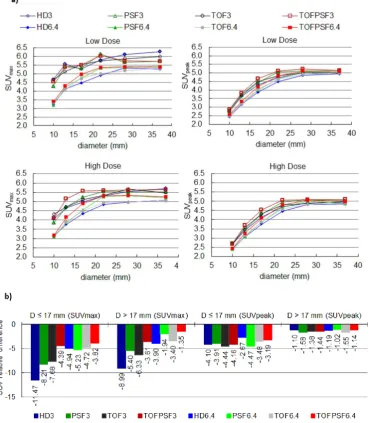
Figure 1a illustrates the SUVmax and SUVpeak as
function of cylinder diameter for different reconstruction methods at two background activity levels (Low Dose: 2.6 kBq / ml; High Dose: 5.3 kBq / ml). The results showed by increasing the background activity level, the relative difference of SUVs had different behaviors whenever the target volume diameter was less than about four times the FWHM of the imaging system resolution. So, the mean relative difference of SUVs in the cylinder with diameter ≤ 17-mm and diameter ˃17 17-mm is shown in Figure 1b.
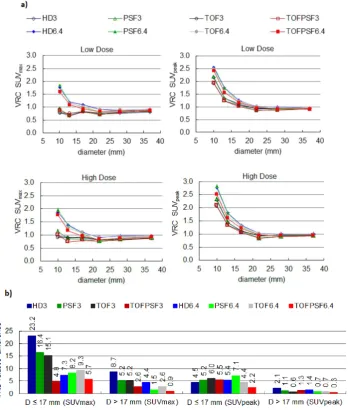
Figure 2ashows the VRCs for each cylinder diameter
and reconstruction methods using the cut-off thresholds SUVmax and SUVpeak at two background
activity levels. The results on the mean relative difference of VRCs are compared in Figure 2b for the cylinder with diameter ≤ 17-mm and diameter ˃ 17 mm. The result showed that the VRC for small target volumes was more sensitive to increasing background activity than large target volumes.
A summary of percent error ΔMTV (%), as relative differences in real target volume and MTV, in the low and high background activity for different target volumes and reconstruction methods are shown in
Figure 3; the smallest (10 mm diameter), the medium
(17 mm diameter), and the largest (37 mm diameter) volumes are presented with cut-off 50% of SUVmax and SUVpeak.
Ir
an
J
N
u
cl
Me
d
20
1
8
,
V
ol
26,
No
2
(
S
er
ial
N
o
51
)
h
tt
p:
//
ir
jn
m
.tu
m
s.a
c.ir
Ju
ly
,
20
18
91
Fig 2. a) Volume recovery coefficients (VRC) as function of cylinder diameter (D) for different reconstruction methods at two background activity levels (Low Dose: 2.6 kBq / mL; High Dose: 5.3 kBq / mL). b) the mean relative difference of VRC by increasing the background activity level in the cylinder with D ≤ 17- mm and D > 17-mm. VRC relative difference (%) = ((VRCHigh Dose – VRCLow Dose)/ VRC Low Dose)*100
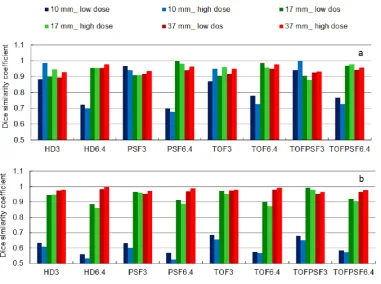
The overlap between each true target volume and MTV of reconstruction methods were calculated by Dice’s similarity coefficient; Figure 4 details the data on Dice similarity coefficient for each specific target volume at two background activity levels.
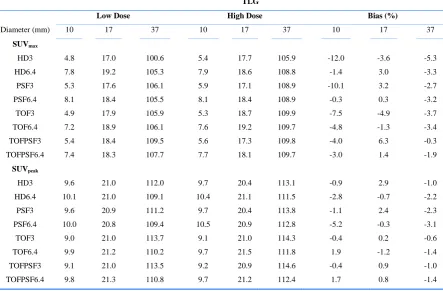
TLG was calculated in each target volume to analyze the target size-dependent variation in different background activity levels; Table 1 summarizes these data on the smallest, medium and largest volumes for different reconstruction methods. The relative difference of TLG in two background activity levels as biases (%) is presented in Table 1. The maximum bias occurred when 3-mm filter and SUVmax was used for all four algorithms.
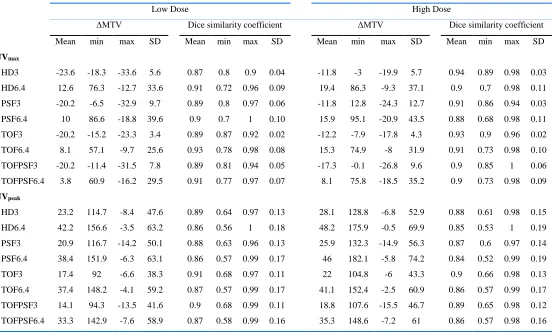
Table 2 compares mean percent error ΔMTV and
corresponding mean Dice similarity coefficient in a range of target volumes for eight reconstruction methods and two different background activity levels. Also, inter-method dependencies to target volume size as SD are compared in Table 2.
DISCUSSION
Ir
an
J
N
u
cl
Me
d
20
1
8
,
V
ol
26,
No
2
(
S
er
ial
N
o
51
)
h
tt
p:
//
ir
jn
m
.tu
m
s.a
c.ir
Ju
ly
,
20
18
92
Fig 3. Percent error ΔMTV (%) for each specific tumor size for different reconstruction methods at two background activity levels (Low Dose: 2.6 kBq / mL; High Dose: 5.3 kBq / mL). The smallest (10 mm diameter), the medium (17 mm diameter), and the largest (37 mm diameter) volumes are presented; a) SUVmax, b) SUVpeak
Ir
an
J
N
u
cl
Me
d
20
1
8
,
V
ol
26,
No
2
(
S
er
ial
N
o
51
)
h
tt
p:
//
ir
jn
m
.tu
m
s.a
c.ir
Ju
ly
,
20
18
93
Table 1: TLG measurements for different reconstruction methods at two background activity levels (Low Dose: 2.6 kBq / mL; High Dose: 5.3 kBq / mL). The bias (%) represents the relative difference of TLG in two background activity levels. Cut-off 50% of SUVmax (upper half) and cut-off 50% of SUVpeak (lower half).
TLG
Low Dose High Dose Bias (%)
Diameter (mm) 10 17 37 10 17 37 10 17 37
SUVmax
HD3 4.8 17.0 100.6 5.4 17.7 105.9 -12.0 -3.6 -5.3
HD6.4 7.8 19.2 105.3 7.9 18.6 108.8 -1.4 3.0 -3.3
PSF3 5.3 17.6 106.1 5.9 17.1 108.9 -10.1 3.2 -2.7
PSF6.4 8.1 18.4 105.5 8.1 18.4 108.9 -0.3 0.3 -3.2
TOF3 4.9 17.9 105.9 5.3 18.7 109.9 -7.5 -4.9 -3.7
TOF6.4 7.2 18.9 106.1 7.6 19.2 109.7 -4.8 -1.3 -3.4
TOFPSF3 5.4 18.4 109.5 5.6 17.3 109.8 -4.0 6.3 -0.3
TOFPSF6.4 7.4 18.3 107.7 7.7 18.1 109.7 -3.0 1.4 -1.9
SUVpeak
HD3 9.6 21.0 112.0 9.7 20.4 113.1 -0.9 2.9 -1.0
HD6.4 10.1 21.0 109.1 10.4 21.1 111.5 -2.8 -0.7 -2.2
PSF3 9.6 20.9 111.2 9.7 20.4 113.8 -1.1 2.4 -2.3
PSF6.4 10.0 20.8 109.4 10.5 20.9 112.8 -5.2 -0.3 -3.1
TOF3 9.0 21.0 113.7 9.1 21.0 114.3 -0.4 0.2 -0.6
TOF6.4 9.9 21.2 110.2 9.7 21.5 111.8 1.9 -1.2 -1.4
TOFPSF3 9.1 21.0 113.5 9.2 20.9 114.6 -0.4 0.9 -1.0
TOFPSF6.4 9.8 21.3 110.8 9.7 21.2 112.4 1.7 0.8 -1.4
TLG = MTV × SUVmean; Bias (%) = ((TLG low Dos – TLG high Dos)/ TLG low Dos) ×100; Diameter (volume): 10 mm (2 cm3), 17 mm (5.5 cm3),
37 mm (28.5 cm3)
Although, previous studies have demonstrated the image reconstruction and segmentation methods can affect the PET image quantification and make it difficult to detect tumor burden [25, 33, 38], but it is necessary to know the inter- reconstruction method variability of image quantification at different background (i.e. surrounding normal tissues) activity level, and it should also be taken into account during PET/CT based target volume delineation. Our results showed that even though the variability in SUVs and SUV-based volumetric quantification were small, the background activity level can affect target volume quantification in some reconstruction method.
SUVmax and SUVpeak decreased as function of increasing background activity level. Figure 1a
indicates exactly where SUVmax and SUVpeak meet the reference SUV (i.e. SUV = 4 calculated based on decay corrected tracer activities) within target volumes. There was a clear trend in the mean relative difference of SUVs, as shown in Figure 1b. Non-TOF reconstruction methods (i.e. HD and PSF) were more sensitive to increasing the background dose in the cylinder with diameter ≤ 17-mm. Also, There was a greater sensitivity to increasing the background dose
Ir
an
J
N
u
cl
Me
d
20
1
8
,
V
ol
26,
No
2
(
S
er
ial
N
o
51
)
h
tt
p:
//
ir
jn
m
.tu
m
s.a
c.ir
Ju
ly
,
20
18
94
Table 2: Mean percent error ΔMTV (%) and corresponding Dice similarity coefficient on all target volumes in different background activity level and reconstruction methods. Cut-off 50% of SUVmax (upper half) and cut-off 50% of SUVpeak (lower half).
Low Dose High Dose
ΔMTV Dice similarity coefficient ΔMTV Dice similarity coefficient
Mean min max SD Mean min max SD Mean min max SD Mean min max SD
SUVmax
HD3 -23.6 -18.3 -33.6 5.6 0.87 0.8 0.9 0.04 -11.8 -3 -19.9 5.7 0.94 0.89 0.98 0.03
HD6.4 12.6 76.3 -12.7 33.6 0.91 0.72 0.96 0.09 19.4 86.3 -9.3 37.1 0.9 0.7 0.98 0.11
PSF3 -20.2 -6.5 -32.9 9.7 0.89 0.8 0.97 0.06 -11.8 12.8 -24.3 12.7 0.91 0.86 0.94 0.03
PSF6.4 10 86.6 -18.8 39.6 0.9 0.7 1 0.10 15.9 95.1 -20.9 43.5 0.88 0.68 0.98 0.11
TOF3 -20.2 -15.2 -23.3 3.4 0.89 0.87 0.92 0.02 -12.2 -7.9 -17.8 4.3 0.93 0.9 0.96 0.02
TOF6.4 8.1 57.1 -9.7 25.6 0.93 0.78 0.98 0.08 15.3 74.9 -8 31.9 0.91 0.73 0.98 0.10
TOFPSF3 -20.2 -11.4 -31.5 7.8 0.89 0.81 0.94 0.05 -17.3 -0.1 -26.8 9.6 0.9 0.85 1 0.06
TOFPSF6.4 3.8 60.9 -16.2 29.5 0.91 0.77 0.97 0.07 8.1 75.8 -18.5 35.2 0.9 0.73 0.98 0.09
SUVpeak
HD3 23.2 114.7 -8.4 47.6 0.89 0.64 0.97 0.13 28.1 128.8 -6.8 52.9 0.88 0.61 0.98 0.15
HD6.4 42.2 156.6 -3.5 63.2 0.86 0.56 1 0.18 48.2 175.9 -0.5 69.9 0.85 0.53 1 0.19
PSF3 20.9 116.7 -14.2 50.1 0.88 0.63 0.96 0.13 25.9 132.3 -14.9 56.3 0.87 0.6 0.97 0.14
PSF6.4 38.4 151.9 -6.3 63.1 0.86 0.57 0.99 0.17 46 182.1 -5.8 74.2 0.84 0.52 0.99 0.19
TOF3 17.4 92 -6.6 38.3 0.91 0.68 0.97 0.11 22 104.8 -6 43.3 0.9 0.66 0.98 0.13
TOF6.4 37.4 148.2 -4.1 59.2 0.87 0.57 0.99 0.17 41.1 152.4 -2.5 60.9 0.86 0.57 0.99 0.17
TOFPSF3 14.1 94.3 -13.5 41.6 0.9 0.68 0.99 0.11 18.8 107.6 -15.5 46.7 0.89 0.65 0.98 0.12
TOFPSF6.4 33.3 142.9 -7.6 58.9 0.87 0.58 0.99 0.16 35.3 148.6 -7.2 61 0.86 0.57 0.98 0.16
Ir
an
J
N
u
cl
Me
d
20
1
8
,
V
ol
26,
No
2
(
S
er
ial
N
o
51
)
h
tt
p:
//
ir
jn
m
.tu
m
s.a
c.ir
Ju
ly
,
20
18
95 In small lesions, the small filter size was more suitable
and the behavior of reconstruction methods was important. For all four reconstruction algorithms, the VRCs plots illustrated that the VRCs were close to 1.0 using SUVmax with 3-mm filter size in both background activity levels, although at a higher background activity was slightly closer. With increasing background activity, the lowest and the largest change in VRCs were seen in TOFPSF and HD reconstruction methods in the small volumes using
SUVmax cut-off threshold, respectively.
Reconstruction with 6.4-mm filter size less affected by the background activity variation and lower inter- reconstruction methods variability observed (Figure 1b) which is due to averaging and suppressing the noise effect. However, in small lesions, as shown in
Figure 2, the use of larger post-smoothing filter can
lead to lesion volume overestimation (1< VRCs), so that VRCs in different reconstruction algorithms obtained up to 1.6 - 1.9 in low, and 1.7 - 2 in high background activity levels. The reconstruction with 6.4-mm filter size not suitable for small tumor quantification, although they showed less sensitivity to increase the background dose (Figures 1 and 2). For all reconstruction methods, VRCs was severely increased in diameter ≤ 17-mm using SUVpeak cut-off thresholds. These increases were up to 1.9 - 2.6 in low, and 2 - 2.8 in high background activity levels .The SUVpeak cut-offthreshold was not suitable for small lesions (diameter ≤ 17-mm) quantification. However, inter- reconstruction methods variability in the cylinder with diameter ˃ 17 mm was negligible. The value of MTV was increased by increasing the background activity level. This increase was significant in small target volumes. In 10-mm diameter cylinder using SUVmax, MTV increases in percent for HD3, PSF3, TOF3, and TOFPSF3 were 23.1%, 20.6%, 17.4%, and 12.7%, respectively; and for HD6.4, PSF6.4, TOF6.4, and TOFPSF6.4 were 5.6%, 4.6%, 11.3%, and 9.3%, respectively. By increasing the background activity, the percent error ΔMTV was reduced or increased when ΔMTV was negative or positive, respectively (equation 2 and
Figure 3).
A high degree of overlap was observed between true target volumes and corresponding MTVs at different background dose. As can be seen in Figure 4, by increasing the background dose, Dice similarity coefficient has slightly increased or decreased depending on whether the primary MTV was larger or smaller than true target volume. The largest changes in the Dice similarity coefficient were observed in a smaller volume when SUVmax was used as the cut-off threshold. In the smallest target volume, Dice similarity coefficients were 0.88, 0.97, 0.87, 0.94 in the low background dose and 0.98, 0.94, 0.95, 1.00 in the high background dose for HD3, PSF3, TOF3, and
TOFPSF3, respectively. For cutoff using SUVmax, the use of TOFPSF algorithm with a small post- smoothing filter in the presence of a background activity uptake can improve the Dice similarity coefficient. The large filter in small tumor volumes leads to a reduction in the Dice similarity coefficient, whether the SUVmax was cutoff value or SUVpeak. Using the large filter in the presence of background activity uptake led to more uncertainty in the tumor quantification and /or delineation.
As detailed in Table 1, the TLG value for large target volume was not significantly changed by increasing background activity level. Increasing the background activity from 2.6 kBq / ml to 5.3 kBq / ml in the smallest target volumes resulted in the largest TLG difference in HD3, PSF3, TOF3, and TOFPSF3 with -12.0%, -10.1%, -7.5%, and -4.0% bias (=100 × (TLG
low Dos – TLG high Dos)/ TLG low Dos). Hence, the quantification of TLG was also affected by reconstruction methods and target volume.
In a range of target volumes, as can be seen in Table 2, the differences between the mean ΔMTV in the high
and low background dose (i.e. mean ΔMTVHigh Dose - mean ΔMTVLow Dose) varied from -11.8% to 7.2% using SUVmax and from 2.1% to 7.6% using SUVpeak inter reconstruction methods. The mean ΔMTV at two background dose showed small variations within one type of reconstruction method (i.e. TOFPSF); however, there was a significant difference in the mean ΔMTV in different reconstruction methods. With increasing the surrounding background uptake for all four algorithms, the SD (i.e. tumor size dependency of each reconstruction method) increased on average about 20.6% for filter 3-mm and 16.0% for filter 6.4-mm using SUVmax, and 12.1% for filter 3-mm and 8.6% for filter 6.4-mm using SUVpeak, respectively. PSF3 with 30.7% and TOF3 with 27.2% increases in SD had the maximum variation by increasing background dose using SUVmax.
Ir
an
J
N
u
cl
Me
d
20
1
8
,
V
ol
26,
No
2
(
S
er
ial
N
o
51
)
h
tt
p:
//
ir
jn
m
.tu
m
s.a
c.ir
Ju
ly
,
20
18
96 background dose especially in small lesions as
described in detail. The problems of segmentation approaches in tumor volume delineation in FDG-PET have addressed in the literature [24]. Other investigators have looked at the other tumor segmentation requirements, but the results are controversial and they did not take into account the impact of different reconstruction algorithms and post smoothing filters size [24]. One of the most important limitations of thresholding approaches for PET-image segmentation is that does not consider background activity. However, despite many other methods, thresholding approaches are more common in clinics and they have an intuitive basis. So, the authors suggest that fixed thresholding-based segmentation methods require considering the reconstruction method and post smoothing filters size.
There are some limitations to this study. Our phantom study was performed in a range of simple shape volumes (2- 28 cm3) and finding might not be transferable to smaller volumes or lesion with a complex shape in clinical situations. Only one tumor-to-background ratio was considered, the background activity uptake in low contrast lesion may be most problematic.
CONCLUSION
Our study addresses the question of volumetric tumor quantification and/or delineation in different background activity uptake and different reconstruction methods both for SUVmax and SUVpeak cut-off thresholds. The effect of the background activity variation on SUV-based quantification in small lesion was more noticeable than large lesion. SUVmax and a smaller filter were more suitable whenever the tumor size was less than three to four times the FWHM of the reconstructed image resolution. The HD and TOFPSF algorithms had the lowest and the highest sensitivity to background activity variation, respectively.
Acknowledgments
This work was supported under grant number 28212, Tehran University of Medical Sciences, Tehran, Iran, and Masih Daneshvari hospital, Shahid Beheshti University of Medical Sciences, Tehran, Iran.
REFERENCES
1. Wahl RL, Jacene H, Kasamon Y, Lodge MA. From
RECIST to PERCIST: Evolving Considerations for PET response criteria in solid tumors. J Nucl Med. 2009 May;50 Suppl 1:122S-50S.
2. Thorwarth D, Geets X, Paiusco M. Physical radiotherapy
treatment planning based on functional PET/CT data. Radiother Oncol. 2010 Sep;96(3):317-24.
3. Tofilon PJ, Camphausen K. Increasing the therapeutic ratio
of radiotherapy: Springer; 2017.
4. Lucignani G. SUV and segmentation: pressing challenges
in tumour assessment and treatment. Eur J Nucl Med Mol Imaging. 2009 Apr;36(4):715-20.
5. Oh JR, Seo JH, Chong A, Min JJ, Song HC, Kim YC, Bom
HS. Whole-body metabolic tumour volume of 18F-FDG PET/CT improves the prediction of prognosis in small cell lung cancer. Eur J Nucl Med Mol Imaging. 2012 Jun;39(6):925-35.
6. Lee JW, Kang CM, Choi HJ, Lee WJ, Song SY, Lee JH,
Lee JD. Prognostic Value of Metabolic Tumor Volume and Total Lesion Glycolysis on Preoperative ¹⁸F-FDG PET/CT in Patients with Pancreatic Cancer. J Nucl Med. 2014 Jun;55(6):898-904.
7. Sheikhbahaei S, Marcus C, Subramaniam RM. 18F FDG
PET/CT and head and neck cancer: Patient management and outcomes. PET Clin. 2015 Apr;10(2):125-45.
8. Manca G, Vanzi E, Rubello D, Giammarile F, Grassetto G,
Wong KK, Perkins AC, Colletti PM, Volterrani D. (18)F-FDG PET/CT quantification in head and neck squamous cell cancer: principles, technical issues and clinical applications. Eur J Nucl Med Mol Imaging. 2016 Jul;43(7):1360-75.
9. Larson SM, Erdi Y, Akhurst T, Mazumdar M, Macapinlac
HA, Finn RD, Casilla C, Fazzari M, Srivastava N, Yeung HW, Humm JL, Guillem J, Downey R, Karpeh M, Cohen AE, Ginsberg R. Tumor treatment response based on visual and quantitative changes in global tumor glycolysis using PET-FDG imaging. The Visual Response Score and the Change in Total Lesion Glycolysis. Clin Positron Imaging. 1999 May;2(3):159-171.
10. d'Amico A. Review of clinical practice utility of positron
emission tomography with 18F-fluorodeoxyglucose in assessing tumour response to therapy. Radiol Med. 2015 Apr;120(4):345-51.
11. Mac Manus MP, Everitt S, Bayne M, Ball D, Plumridge N,
Binns D, Herschtal A, Cruickshank D, Bressel M, Hicks RJ. The use of fused PET/CT images for patient selection and radical radiotherapy target volume definition in patients with non-small cell lung cancer: results of a prospective study with mature survival data. Radiother Oncol. 2013 Mar;106(3):292-8.
12. Pan T, Mawlawi O. PET/CT in radiation oncology. Med
Phys. 2008 Nov;35(11):4955-66.
13. Shi X, Meng X, Sun X, Xing L, Yu J. PET/CT
imaging-guided dose painting in radiation therapy. Cancer Lett. 2014 Dec 28;355(2):169-75.
14. Grégoire V, Langendijk JA, Nuyts S. Advances in
Radiotherapy for Head and Neck Cancer. J Clin Oncol. 2015 Oct 10;33(29):3277-84.
15. Ling CC, Humm J, Larson S, Amols H, Fuks Z, Leibel S,
Koutcher JA. Towards multidimensional radiotherapy
(MD-CRT): biological imaging and biological
conformality. Int J Radiat Oncol Biol Phys. 2000 Jun 1;47(3):551-60.
16. Bentzen SM. Theragnostic imaging for radiation oncology:
dose-painting by numbers. Lancet Oncol. 2005
Feb;6(2):112-7.
17. Lu W, Wang J, Zhang HH. Computerized PET/CT image
Ir
an
J
N
u
cl
Me
d
20
1
8
,
V
ol
26,
No
2
(
S
er
ial
N
o
51
)
h
tt
p:
//
ir
jn
m
.tu
m
s.a
c.ir
Ju
ly
,
20
18
97
18. Peeken JC, Nüsslin F, Combs SE. "Radio-oncomics" : The
potential of radiomics in radiation oncology. Strahlenther Onkol. 2017 Oct;193(10):767-779.
19. Zhang H, Tan S, Chen W, Kligerman S, Kim G, D'Souza
WD, Suntharalingam M, Lu W. Modeling pathologic response of esophageal cancer to chemoradiation therapy using spatial-temporal 18F-FDG PET features, clinical parameters, and demographics. Int J Radiat Oncol Biol Phys. 2014 Jan 1;88(1):195-203.
20. Doot RK, McDonald ES, Mankoff DA. Role of PET
quantitation in the monitoring of cancer response to treatment: Review of approaches and human clinical trials. Clin Transl Imaging. 2014 Aug 1;2(4):295-303.
21. Xu W, Yu S, Ma Y, Liu C, Xin J. Effect of different
segmentation algorithms on metabolic tumor volume measured on 18F-FDG PET/CT of cervical primary squamous cell carcinoma. Nucl Med Commun. 2017 Mar;38(3):259-265.
22. Berthon B, Evans M, Marshall C, Palaniappan N, Cole N,
Jayaprakasam V, Rackley T, Spezi E. Head and neck target delineation using a novel PET automatic segmentation algorithm. Radiother Oncol. 2017 Feb;122(2):242-247.
23. Sridhar P, Mercier G, Tan J, Truong MT, Daly B,
Subramaniam RM. FDG PET metabolic tumor volume segmentation and pathologic volume of primary human
solid tumors. AJR Am J Roentgenol. 2014
May;202(5):1114-9.
24. Zaidi H, El Naqa I. PET-guided delineation of radiation
therapy treatment volumes: a survey of image segmentation techniques. Eur J Nucl Med Mol Imaging. 2010 Nov;37(11):2165-87.
25. Rogasch JM, Hofheinz F, Lougovski A, Furth C, Ruf J,
Großer OS, Mohnike K, Hass P, Walke M, Amthauer H, Steffen IG. The influence of different signal-to-background
ratios on spatial resolution and F18-FDG-PET
quantification using point spread function and time-of-flight reconstruction. EJNMMI Phys. 2014 Dec;1(1):12.
26. Brendle C, Kupferschläger J, Nikolaou K, la Fougère C,
Gatidis S, Pfannenberg C. Is the standard uptake value (SUV) appropriate for quantification in clinical PET imaging? - Variability induced by different SUV measurements and varying reconstruction methods. Eur J Radiol. 2015 Jan;84(1):158-162.
27. Knudtsen IS, van Elmpt W, Ollers M, Malinen E. Impact of
PET reconstruction algorithm and threshold on dose painting of non-small cell lung cancer. Radiother Oncol. 2014 Nov;113(2):210-4.
28. Soret M, Bacharach SL, Buvat I. Partial-volume effect in
PET tumor imaging. J Nucl Med. 2007 Jun;48(6):932-45.
29. Chen GH, Yao ZF, Fan XW, Zhang YJ, Gao HQ, Qian W,
Wu KL, Jiang GL. Variation in background intensity affects PET-based gross tumor volume delineation in non-small-cell lung cancer: the need for individualized information. Radiother Oncol. 2013 Oct;109(1):71-6.
30. Foster B, Bagci U, Mansoor A, Xu Z, Mollura DJ1. A
review on segmentation of positron emission tomography images. Comput Biol Med. 2014 Jul;50:76-96.
31. Andersen FL, Klausen TL, Loft A, Beyer T, Holm S.
Clinical evaluation of PET image reconstruction using a
spatial resolution model. Eur J Radiol. 2013
May;82(5):862-9.
32. Prieto E, Domínguez-Prado I, García-Velloso MJ, Peñuelas
I, Richter JÁ, Martí-Climent JM. Impact of time-of-flight
and point-spread-function in SUV quantification for oncological PET. Clin Nucl Med. 2013 Feb;38(2):103-9.
33. Sheikhbahaei S, Marcus C, Wray R, Rahmim A, Lodge
MA, Subramaniam RM. Impact of point spread function reconstruction on quantitative 18F-FDG-PET/CT imaging parameters and inter-reader reproducibility in solid tumors. Nucl Med Commun. 2016 Mar;37(3):288-96.
34. Lee NY, Riaz N, Lu JJ. Target volume delineation for
conformal and intensity-modulated radiation therapy: Springer; 2014.
35. Hanna GG, Hounsell AR, O'Sullivan JM. Geometrical
analysis of radiotherapy target volume delineation: a systematic review of reported comparison methods. Clin Oncol (R Coll Radiol). 2010 Sep;22(7):515-25.
36. Boellaard R, Delgado-Bolton R, Oyen WJ, Giammarile F,
Tatsch K, Eschner W, Verzijlbergen FJ, Barrington SF, Pike LC, Weber WA, Stroobants S, Delbeke D, Donohoe KJ, Holbrook S, Graham MM, Testanera G, Hoekstra OS, Zijlstra J, Visser E, Hoekstra CJ, Pruim J, Willemsen A, Arends B, Kotzerke J, Bockisch A, Beyer T, Chiti A, Krause BJ; European Association of Nuclear Medicine (EANM). FDG PET/CT: EANM procedure guidelines for tumour imaging: version 2.0. Eur J Nucl Med Mol Imaging. 2015 Feb;42(2):328-54.
37. Zou KH, Warfield SK, Bharatha A, Tempany CMC, Kaus
MR, Haker SJ, Wells WM, Jolesz FA, Kikinis R. Statistical validation of image segmentation quality based on a spatial overlap index 1: Scientific reports. Acad Radiol. 2004;11(2):178-89.
38. Sadick M, Molina F, Frey S, Piniol R, Sadick H, Brade J,
Fink C, Schoenberg SO, He Y. Effect of reconstruction parameters in high-definition PET/CT on assessment of lymph node metastases in head and neck squamous cell carcinoma. J Nucl Med Technol. 2013 Mar;41(1):19-25.
39. Schaefer A, Kremp S, Hellwig D, Rübe C, Kirsch CM,
Nestle U. A contrast-oriented algorithm for FDG-PET-based delineation of tumour volumes for the radiotherapy of lung cancer: derivation from phantom measurements and validation in patient data. Eur J Nucl Med Mol Imaging. 2008 Nov;35(11):1989-99.
40. Burger IA, Vargas HA, Beattie BJ, Goldman DA, Zheng J,
Larson SM, Humm JL, Schmidtlein CR. How to assess background activity: introducing a histogram-based analysis as a first step for accurate one-step PET quantification. Nucl Med Commun. 2014 Mar;35(3):316-24.
41. Burger IA, Casanova R, Steiger S, Husmann L, Stolzmann
P, Huellner MW, Curioni A, Hillinger S, Schmidtlein CR, Soltermann A. 18F-FDG PET/CT of Non-Small Cell Lung
Carcinoma Under Neoadjuvant Chemotherapy: