38
Reliability of Exponential Smoothing Method for forecasting Islamic
Share Price to oil and gas sector in Malaysian Stock Exchange
Nashirah Binti Abu Bakar
1and Sofian Rosbi
21Islamic Business School, College of Business, Universiti Utara Malaysia, Kedah, Malaysia, 2Universiti Malaysia Perlis, Perlis, Malaysia
Corresponding email: [email protected]
Article Information
Abstract
Keywords
Forecasting,
Exponential smoothing, Share price,
Sharia-compliant securities, Malaysian Stock Exchange.
This paper forecast the share price for two companies that related with oil and gas sector. These companies are Sharia-compliant companies that issues Initial Public Offerings (IPO) in year 2012. This paper using forecasting methods which are simple moving average and exponential smoothing. Then, these share prices are evaluated using three types of error, which are mean absolute deviation (MAD), mean squared error (MSE) and mean absolute percentage error (MAPE). The results show exponential smoothing is less error than simple moving average. Therefore, exponential smoothing is more suitable in forecasting the dynamic of share price. This result is to help investors to determine and select share price with higher return using an accurate method.
INTRODUCTION
Financial innovations transformed the traditional financial markets into highly sophisticated markets featuring with high degree of liquidity and wide-array of instruments to share and transfer various sources of risk (Iqbal, 1999). This trend occurred in domestic and international financial markets. This innovation and growth in financial markets was further induced by advances in the financial theory. This trend was occurred with introducing the Islamic investment. Islamic investment was growth up rapidly and earns outstanding recognition from international financial markets in the last decade. Continuing success is the result of increasing demand for Islamic financial products and services by both domestic and international financial intermediaries. Islamic banking is no longer limited to the boundaries of Muslim countries but is establishing roots in non-Muslim countries as well. Moreover, Islamic financial product and service such as Islamic capital market is no longer restricted to Muslims people only.
Part from Islamic capital market, Initial Public Offerings (IPO) for sharia-compliant companies is an alternative way for Islamic companies to growing up and develops. IPO is a common stock that has been widely examined in the finance literature, and academic interest in IPO is continuously till today.
IPO for sharia-compliant companies is act as an alternative source for Islamic companies to raise a capital for expanse a business where the capital must be free from any prohibited element such as usury (riba), gambling
(maisir), and uncertainties (gharar) (Abdul Rahim & Yong, 2010).
39
focus is on the tremendous profit opportunities that IPO frequently offer to investors (Bessler & Thies, 2007). In the same, the studies that focus on the performance of long-term IPO in Malaysia found evidence that long-term performances of IPO are performed better (How, et al., 2007). However, no prior academic has documented the area of forecasting for share price of sharia-compliant in Malaysia.Thus, this study tries to fulfill this gap by forecast the long-term performance of IPO for sharia-compliant companies using exponential smoothing. Specifically, this study examine long term performance of IPO for sharia-compliant companies using moving average methods and compare with exponential smoothing . Next, this study was analysis the error in the analysis.
LITERATURE REVIEW
Many study was investigated the performance of stock markets worldwide (Boulton, et al. 2011). Various studies investigated the long term performance of IPO market found IPO are underperformed their benchmark. Ritter (1991) examines long term performance of IPO in United States found the significant underperform their benchmark.
Carter et al. (1998) also found IPO stocks are underperformed relative to the market over a three-year holding period is less severe for IPO handled by more prestige underwriters. The same result is reported by Chan, et al. (2004) in China. They found IPO in China is slightly underperformed. While, Lee, et al. (1996) report that Australian’s IPO significantly underperform market movements in the three-year period subsequent to list. Goergen, et al. (2007) discusses the long-run performance of UK IPO and found that the percentage of equity issued and the degree of multinationality of a firm are the key predictors of IPO performance in UK. Drobetz, et al. (2005) found long run underperformance to the fact that IPO firms tend to be small firms when used a small capitalization index as a benchmark. Thus, underperformed of long term IPO are observed in various countries (Kirkulak & Davis, 2005).
Therefore, it is important to forecast the performance of share price to make sure that particular share can give high return. Stock markets are influenced by complex factors and nonlinear relationships among factors existed in different periods such that forecasting the future stock trends for investors are extremely difficult (Kluger & McBride, 2011). Paul (2011)
used
exponential smoothing technique to predict the future events.Therefore, implementation of accurate forecasting methods is important in predicting stock prices since the stock market begins (Pavlov & Hurn, 2012). Exponential smoothing is one of the accurate forecasting methods (Taylor, 2004). In this paper, we compare the simple moving average and exponential smoothing. Then, three types of error are calculated. The three types of error are mean absolute deviation (MAD), mean squared error (MSE) and mean absolute percentage error (MAPE).
METHODOLOGY
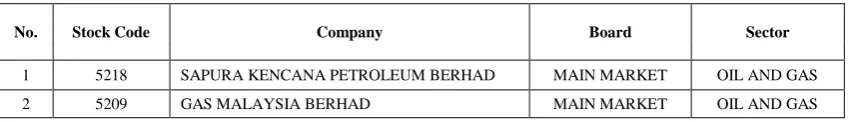
In Malaysia Stock Exchange, there are 2 sharia-compliant companies that issues Initial Public Offering in year of 2012 for oil and gas sector. Table 1 show the list of the companies. We select this sector because the decrement of the share price in this sector is the highest between years 2015 to 2016. In the same time the volatility of the share price during 2015 until 2016 is the largest.
TABLE I : List of Sharia compliance companies that issues Initial Public Offerings (IPO) in year of 2012 for oil and gas sector
No. Stock Code Company Board Sector
1 5218 SAPURA KENCANA PETROLEUM BERHAD MAIN MARKET OIL AND GAS 2 5209 GAS MALAYSIA BERHAD MAIN MARKET OIL AND GAS
The first company is Sapura Kencana Petroleum Berhad. This company is an oil field services company based in Malaysia. It was formed via a merger between SapuraCrest and Kencana in May 2012.Sapura Kencana provides solutions covering the entire oil and gas exploration and production value chain. The company operates in over 20 countries including Malaysia, Brazil, the United States, Western Africa and the Middle East.
40
company shares are held by MMC-Shapadu Holdings, 25% by Tokyo Gas - Mitsui Holdings and 20% by Petronas Gas Berhad.Then, this research analyse the movement of share price, starting from the first month until more than 50 months. The data are collected from Datastream (Thomson Reuters). Then, this research calculates two methods of forecasting. The first method is simple moving average and the second method is exponential smoothing prediction method.
The calculation for simple moving average is as follows:
demand in previous periods
Moving average = n
n
(1)where n is the number of periods in the moving average. In this research, n=3 months is selected.
Next, the calculation for exponential smoothing is as follows:
1 1
New forecast = (Last period's actual demand) +(1- )(Last period's forecast)
(At ) (1 )(Ft )
(2)
where is the smoothing constant. In this research, is set toThis setting is to make this forecasting method more responsive to changes because last period’s actual demand are set to be more heavily weighted.
Next, overall accuracy of the forecasting method needs to validate using robustness diagnostic of error. The forecast error can be determined by comparing the forecasted values with the actual or observed values. If Ft
denotes the forecast in period t, and At denotes the actual value in period t, the forecast error is defined as:
Forecast error = Actual value - Forecast value
t t
A F
(3)
Then, to validate the robustness diagnostic of forecasting method, three types of error is introduced. The first measure of the overall forecast error for a model is the mean absolute deviation (MAD). This value is calculated by taking sum of the absolute values of the individual forecast errors and dividing by the number of periods of data (n):
1 1
1
Forecast error Actual-Forecast
MAD = =
n n
t t
n
t t
t
n n
A F
n
(4)Next, the second parameter for measuring overall forecast error is mean squared error (MSE). The MSE is average of squared differences between the forecasted and observed values. The formula for MSE is:
2 2
1 1
2
1
Forecast error Actual - Forecast MSE =
n n
t t
n
t t
t
n n
A F
n
(5)41
1 1
1
100 Forecast error / Actual 100 Actual Forecast / Actual
MAPE = =
100 A F / A
n n
t t t t
t t
n
t t t
t
n n
n
(6)As robustness for diagnostic error checking, three method of error calculation is compared to find the lowest error for forecasting methods. In this paper, the accuracy between simple moving average and exponential smoothing are evaluated.
RESULT AND DISCUSSION
Figure 1 is the share price characteristics for Sapura Kencana Petroleum Berhad. Figure 1(a) shows the exponential smoothing prediction line is located to the real data of share price. Then, Figure 1(b) shows the absolute percentage error for period 4th month (August 2012) until 54th month (October 2016).It is concluded that exponential smoothing prediction method shows lower value of absolute percentage error. From Figure 1(c) the result shows Exponential smoothing prediction is more accurate than moving average.
0 10 20 30 40 50 60
1 2 3 4 5 6
Share price (MYR)
Period (month) Real data value
Moving average prediction Exponential smooothing prediction
(a)
0
10
20
30
40
50
60
0
10
20
30
40
50
60
70
Ab
solu
te p
er
cen
tag
e
er
ro
r
(%)
Period (month)
Moving average prediction
Exponential smoothing prediction
42
Error evaluation Moving average Exponential smoothingMean absolute deviation (MAD) 0.268 0.211
Mean squared error (MSE) 0.142 0.080
Mean absolute percentage error (MAPE) 9.797 7.795
(c)
Figure 1: Share price for Sapura Kencana Petroleum Berhad (a) Real dynamic movement of share price (b) Absolute percentage error analysis (c) Evaluation for three types of error
Figure 2 is the share price characteristics for Gas Malaysia Berhad. Figure 2(a) shows the exponential smoothing prediction line is located to the real data of share price. Then, Figure 2(b) shows the absolute percentage error for period 4th month (September 2012) until 53th month (October 2016).It is concluded that exponential smoothing prediction method shows lower value of absolute percentage error. From Figure 1(c) the result shows Exponential smoothing prediction is more accurate than moving average.
0 10 20 30 40 50 60
1
2
3
4
5
6
Share price (MYR)
Period (month)
Real data value
Moving average prediction
Exponential smooothing prediction
(a)
0
10
20
30
40
50
60
0
10
20
30
40
50
60
70
Ab
solu
te p
er
cen
tag
e
er
ro
r
(%)
Period (month)
Moving average prediction
Exponential smoothing prediction
43
Error evaluation Moving average Exponential smoothingMean absolute deviation (MAD) 0.144 0.106
Mean squared error (MSE) 0.042 0.024
Mean absolute percentage error (MAPE) 4.968 3.694
(c)
Figure 2: Share price for Gas Malaysia Berhad (a) Real dynamic movement of share price (b) Absolute percentage error analysis (c) Evaluation for three types of error
CONCLUSION
The objective of this research is to evaluate the forecasting method to predict the long term performance of share price. The share prices that involved in this research are sharia-compliant companies that listed in Malaysian Stock Exchange in year of 2012. We select two companies that related with oil and gas sector. The companies are Sapura Kencana Petroleum Berhad and Gas Malaysia Berhad. In this research, we analyzed the implementation of two methods of forecasting which are simple moving average and exponential smoothing. From the result in Figure 1 until Figure 2, this research concludes that:
(1) The value of share price is dynamically moving fluctuate according to market condition. Both of the graph show large decrement of value starting from year of 2015 to 2016.
(2) The evaluation of each forecasting method is evaluate thoroughly with respect to three measure of error calculation, which are mean absolute deviation (MAD), mean squared error (MSE) and mean absolute percentage error (MAPE).
(3) The error value for each calculation is bigger if the volatility of error for the share price is higher. (4) The forecasting method of exponential smoothing is better than simple moving average because of it is
less error. Therefore, exponential smoothing is more accurate in forecasting the dynamic behavior of share price.
REFERENCES
Abdul Rahim, R., & Yong, O. (2010). Initial returns of Malaysian IPOs and Shari’a-compliant status. Journal of
Islamic Accounting and Business Research, 1(1), 60–74.
Abu Bakar, N. and Rosbi, S. (2016). Long Term Performance of Islamic Share Price for Initial Public Offerings (IPOs) in Malaysia: Evidence from Sharia-Compliant Companies Listed on the Malaysian Stock Exchange (2006-2010). International Journal of Management Science and Business Administration, 2(4), 81-87.
Ahmad–Zaluki, N. A, Campbell, K. and Goodacre, A. (2007). The Long Run Share Price Performance of Malaysian Initial Public Offerings (IPOs). Journal of Business and Accounting, 34(1), 78–110.
Astuty, W. (2015). The Extraordinary Solution for Indonesia Economic Crisis: Shariah Capital Market. Journal
of Finance and Bank Management, 3(2), 47-56.
Boulton, T. J., Smart, S. B., & Zutter, C. J. (2010). IPO Underpricing and International Corporate Governance.
Journal of International Business Studies, 41(2), 206–222.
Bessler, W. and Thies (2007). The long-run performance of initial public offerings in Germany. Managerial
Finance, 33(6), 420–441.
Carter, R.B., Dark F. H., and Singh, A.K. (1998). Underwriter Reputation, Initial Return and Long–Run Performance of IPO stocks. The Journal of Finance, 53(1), 285-311.
Chan, K., Wang, J. and Wei K.C.J. (2004). Underpricing and long term performance of IPOs in China. Journal
of Applied Corporate Finance, 10(3), 409–430.
Chen, A. Chen, L.W. and Kao, L (2010). Leverage, liquidity and IPO long–run performance: evidence from Taiwan IPO markets. International Journal of Accounting & Information Management, 18(1), 31–38. Corhay, A., Teo, S. and Rad, A.T. (2002). The long run performance of Malaysian initial public offerings (IPO):
value and growth effects. Managerial Finance, 28(2), 52–65.
Drobetz, W., Kammermann, M. and Walchle, U. (2005). Lon–run performance of Initial Public Offerings: The evidence for Switzerland. Schmalenbach Business Review, 57, 253–275
Farid, D., Meybodi, A.R. and Mirfakhraddiny, S.H. (2010). Investment risk management in Tehran Stock Exchange (TSE) using technique of Monte Carlo Simulation (MCS), Journal of Financial Crime, 17(2), 265-278.
Goergen, M. Khurshed, A and Mudambi, R. (2007). The long–run performance of UK: can it be predicted.
44
How, J., Jelic, R., Saadouni, B., & Verhoeven, P. (2007). Share allocations and performance of KLSE secondboard IPOs. Pacific-Basin Finance Journal, 15(3), 292–314.
Iqbal, Z. (1999). Financial Engineering in Islamic Finance, Thunderbird International Business Review, 41(4), 541-561
Lee, P.J, Taylor, S.L. and Walter, T.S. (1996). Australian IPO pricing in the short and long run, Journal of
Banking and Finance, 20, 1189–1210.
Kluger, B.D and McBride, M, E. (2011). Intraday trading patterns in an intelligent autonomous agent-based stock market,Journal of Economic Behavior & Organization, 79, 226-245.
Kirkulak, B., and Davis, C. (2005). Underwriter Reputation and Underpricing: Evidence from the Japanese IPO Market. Pacific-Basin Finance Journal, 13, 451–470.
Kim, J., Krinsky, I., and Lee, J. (1995). The aftermarket performance of initial public offerings in Korea, Pacific
Basin Finance Journal, 3, 429–448.
Loughran, T, Ritter, J.R., Rydqvist, K. (1994). Initial Public Offerings: International Insights. Pacific–Basin
Financial Journal, 2, 165–199
Pavlov, V and Hurn, S. (2012). Testing the profitability of moving-average rules as a portfolio selection strategy,
Pacific-Basin Finance Journal, 20, 825–842.
Paudyal, K., Saadouni. B. and Briston, R.J. (1998). Privatisation Initial Public Offering in Malaysia: Initial Premium and Long Term Performance, Pacific-Basin Finance Journal, 6(5), 427–451.
Paul, S.K. (2011). Determination of Exponential Smoothing Constant To Minimize Mean Square Error and Mean Absolute Deviation, Global Journal of Research in Engineering, 11 (3), 30-34.
Ritter, J.R. (1991). The Long Run Performance of Initial Public offerings, Journal of Finance, 46(1), 3–27 Taylor, J.W. (2004). Volatility forecasting with smooth transition exponential smoothing, International Journal
of Forecasting, 20, 273 – 286.