5Biomedical Engineering Research Organization, Tohoku University, Sendai 980-8579, Japan
It is reported that the transformation characteristics of Ti–Ni shape memory alloys (SMAs) are influenced by manufacturing conditions, such as composition, heat-treatment temperature, cold working, and so on. To understand correctly the effects of these manufacturing conditions on transformation characteristics of Ti–Ni SMAs make it possible to control the transformation temperature and recovery stress. The purpose of this work is to clarify the effect of cold working ratio on transformation and deformation behavior after pre-deforming SMA. The specimens were Ti–50 at%Ni annealed at 673 K for 3.6 ks. The variation of the recoverable strain, recovery stress and transformation temperature with cold working ratio was investigated experimentally. The solution treated material was also used as a reference material. The effect of cold working ratio on the transformation and deformation behavior is discussed in relation to the volume fraction of the residual martensite subjected to slip deformation.
(Received September 20, 2005; Accepted December 15, 2005; Published March 15, 2006)
Keywords: shape memory alloy, titanium–50 at%nickel, cold working, pre-deformation, transformation and deformation behavior
1. Introduction
Shape memory alloy (SMA) attracts attention as a func-tional material in various fields. Especially, Ti–Ni based alloys are already used in the engineering and medical fields because of their superior mechanical properties and corrosion resistance.1–4)In the most of SMA’s application, the recovery
stress and the recovery deformation caused by shape memory effect (SME) are used. It is reported that the deformation and transformation characteristics of SMA change with the processing condition such as composition, heat-treatment temperature and cold working.5–7)Furthermore, the
marten-sitic transformation and deformation behavior of pre-strained SMAs strongly depends on the slip deformation introduced by applying the pre-strain. The present authors have reported that the residual martensite occurred by the slip deformation represents the index of dislocation.8,9)However, the system-atic study about these influences is not yet done enough.
In the present study, the effect of cold working ratio on the deformation and transformation characteristics were demon-strated and the relation between the cold working ratio and the slip deformation caused by pre-strain was investigated by analyzing the volume fraction of the residual martensite.
2. Expermental Procedures
Ti–Ni alloy was melted using a high frequency induction vacuum furnace. The composition of alloy was Ti–50 at%Ni. The ingot was hot-forged, hot-extrude and cold-drawn to make wires with a diameter of 1.0 mm. Wires were cold-drawn with the reduction of 10, 20 and 30%. Specimens with straight shape were annealed at 673 K for 3.6 ks. Reference
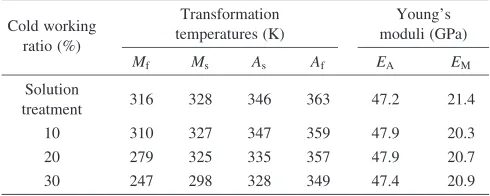
samples were annealed at 1103 K for 60 s. Transformation temperatures of specimens measured by differential scanning calorimetry (DSC) and elastic moduli of martensitic phase EMand parent phaseEAobtained by tensile tests are listed in
Table 1. The tensile test of parent phase specimen was conducted at Afþ20K. The test of martensitic phase
specimen was conducted atAs20K after specimens were
completely transformed to martensitic phase by cooling down toMf30K.
2.1 Stress free test
The schematic drawing of stress free tests is shown in Fig. 1, where (a) and (b) are the stress–strain curve and the strain–temperature curve, respectively. The specimen was elongated at a strain rate of 1.2 mm/min to a given strain"pr
at a given temperature TC (¼As20K), and then it was
unloading to stress free (O!A!B). At point B, the specimen was heated up at a heating rate of 3 K/min to a temperatureTH (>Af) without constrained strain (B!C).
The amount of recovery strain "R and the amount of
residual strain "Re were measured from stress–strain curve
(B!C). The transformation temperature with pre-strainAs0
[image:1.595.304.549.391.489.2]andAf0were measured from strain–temperature curve.
Table 1 Transformation temperatures and elastic moduli of Ti–50 at%Ni alloy.
Cold working ratio (%)
Transformation temperatures (K)
Young’s moduli (GPa)
Mf Ms As Af EA EM
Solution
treatment 316 328 346 363 47.2 21.4
10 310 327 347 359 47.9 20.3
20 279 325 335 357 47.9 20.7
30 247 298 328 349 47.4 20.9
*This Paper was Originally Published in Japanese in J. Japan Inst. Metals
Recovery ratio based on heating was defined as RR ð%Þ ¼"R="pr100. The elastic modulus EL was
obtained by loading curve (C!D) at Af0þ20K. The
volume fraction of slip-deformed martensite is given by following equation.11,12)
¼EMðEAELÞ
ELðEAEMÞ
ð1Þ
2.2 Constrained strain test
The schematic drawing of constrained strain test is shown in Fig. 2, where (a) and (b) are the stress–strain curve and the stress–temperature curve. The specimens cooled down to martensitic phase were loaded to a given strain "pr and
unloaded to stress free (O!A!B). And they were heated up at a heating rate of 3 K/min and cooled down at a cooling rate of 5 K/min under a constrained strain (B!C!B0).
The recovery stress under a constrain strain R and
As0;Af0;Ms0 with pre-strain were measured from (B!
C!B0). The elastic modulusELwas obtained by unloading
curve at TH (C!D). Based on heating/unloading (B!
C!D), recovery ratioRRRbased on heating was defined as
RRR ð%Þ ¼"Re="pr100. The elastic modulus EL was
obtained by unloading curve (C!D). The volume fraction of slip-deformed martensitewere obtained from eq. (1).
3. Result and Discussion
3.1 Deformation behavior
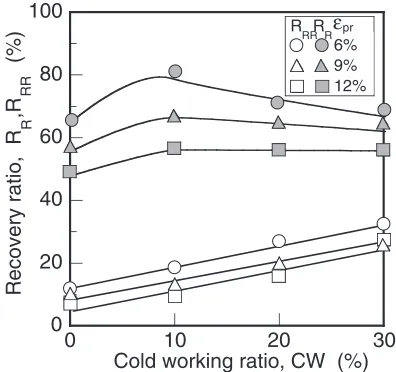
Figure 3 shows the relation between the cold work ratio (CW) and the recovery ratioðRR;RRRÞby the stress free test
and the constrained strain test. BothRRandRRRwithCWare
(b)Strain-temperature curve
(a)Stress-strain curve
Fig. 1 Schematic drawing of stress free test.
(a) Stress-strain curve
(b) Stress-temperature curve
Fig. 2 Schematic drawing of constrained strain test.
0 20 40 60 80 100
0 10 20 30
Recovery ratio, R ,R (%)
Cold working ratio, CW (%)
6% 9% 12%
R
εpr
RR
R
R
R
RR
[image:2.595.104.495.78.235.2] [image:2.595.103.495.280.436.2] [image:2.595.327.525.489.675.2]larger than that of solution treatments. Under constrained strain,RRRincreases with increasing theCW and decreases
with increasing the pre-strain. However, under stress free test,RRis insensitive in a range ofCW >10%.
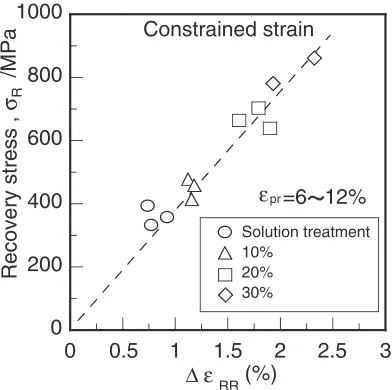
Figure 4 shows the relation of recovery stressRandCW
obtained from constrained strain test. Recovery stress increase linearly with increasing ofCW, while the recovery stress is not affected the pre-strain in the range 6–12%.
Figure 5 shows the relation of the volume fraction of slip-deformed martensite and residual strain "Re. The "Re
increases linearly with increasing of theand the"Replots lie
on a straight line independently of pre-strain, cold working ratio and test condition. Therefore, it is suggested that the volume fraction of slip-deformed martensite indicates the index of the degradation of shape memory property.
Figure 6 shows the relation between the volume fraction of slip-deformed martensiteandCWunder stress-free test and
constrained-strain test. Thedecreases linearly with increas-ing ofCW and increases with increasing the pre-strain. It is well known that the critical stress for slip increases with increasing of the density of dislocation by work hardening.10)
Therefore, it is supposed that the specimens with a largeCW process a high density of dislocation and consequently, further slip-deformation by pre-strain hardly occurs. The
under constrained strain condition is larger than that of stress free condition. Under free stress condition, further slip-deformation only occurs in the pre-strain process. On the other hand, under constrained strain condition, a large recovery force by reverse transformation is obtained and the M phase and parent phase are mixed in reverse trans-formation process. Therefore, further slip-detrans-formation oc-curs in not only pre-strain process but also shape recovery process by reverse transformation. This is a reason why the
of constrained stress condition is larger than that of stress free condition. From above results, theand the"Redecrease with
increasing the CW (see Fig. 5). Consequently, as shown Fig. 3, the shape recovery ratio is enhanced by a largeCW. Figure 7 shows relationship between the increase of volume fraction of slip-deformed martensite (¼a)
and the recovery stressRunder constrained strain condition,
where theand theaare the residual volume fraction of
slip-deformed martensite under constrained stress condition and under stress free condition, respectively. Under both con-dition, thedecreases with increasing the recovery stress, since further slip-deformation hardly occurs with increasing theCW.
Figure 8 shows relationship between the recovery stress
R and the recovery ratio "RR under constrained strain
condition. The R increases linearly with increasing of the
"RR. As shown Figs. 6 and 7, a high CW prevents the
introduction of further slip-deformation and consequently, recovery strain ratio is improved (see Fig. 3). As shown Fig. 4, the recovery stress becomes large if the further slip-deformation by pre-strain is small. It is concluded that the specimens with a high CW show an excellent SME proper-ties.
0
0 10 20 30
Recovery stress,
Cold working ratio, CW (%)
Fig. 4 Variation of recovery stress R with cold working ratio under
constrained strain condition.
0 3 6 9 12 15
Residual ratio,
ε
(%)
Volume fraction of
slip-deformed martensite,
ξ
(%)
Re
Constrained strain Stress free
S.T S.T
CW=10% CW=10%
CW=20% CW=20%
CW=30% CW=30%
0 10 20 30 40 50
Fig. 5 Relationship between residual strain"Re and residual martensite
volume fraction subjected to slip deformation.
0 10 20 30
Cold working ratio, CW (%) 0
3.2 Transformation temperature behavior
It is reported that theAsis raised by the deformation in M
phase because the elastic strain energy stored during martensitic transformation is relaxed by slip.11–13) Figure 9
shows variation ofAs0as a function of theCW, whereAs0
is (As0As) andAs0isAsafter pre-strain. TheAsdecreases
with increasing of theCW and increases with increasing the pre-strain. As shown Fig. 6, the density of dislocation increases with increasing of the CW and the further slip-deformation decreases with decreasing of pre-strain. It is suggested that since the stored elastic energy is hardly relaxed with increasing theCW and with decreasing of the pre-strain, theAs0becomes a small.
Figure 10 shows variation ofAf0with theCW. As shown
Fig. 9, the As0 decreases with increasing the CW. Under
stress free condition, theAf0decreases with increasing the
CWjust like theAs0. However, under constrained strain, the
Af0 increases with increasing of CW. The recovery stress
increases with increasing theCW(see Fig. 4). Consequently, the increasing of recovery stress resists the reverse trans-formation and a large driving force to transform to parent phase is required. Therefore, the Af0 increases with
increasing theCW.
The As raises up with the raising ofAf. Figure 11 shows
variation ofMs0with cold working ratio under constrained
strain condition, whereMs0isMs0MsandMs0isMsunder
constrained stress. TheMs0 in the range of CW less than
10% does not depend onCW, while theMs0in the range of
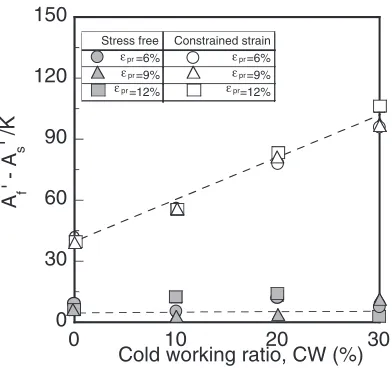
CW more than 10% raises with increasing of CW. The decrease of temperature difference (AfAs) improves the
thermal reactivity for SME. Figure 12 shows the variation of Af0As0 with CW. Figure 13 shows relationship between
Af0As0and the recovery stressRunder constrained strain
condition. The As goes down with increasing theCW (see
Fig. 9). Under free strain condition, theAf goes down, too.
Therefore the temperature difference (Af0As0) does not
depend on CW and pre-strain. However, under constrained strain,Af increases with increasing theCW(see Fig. 10). So,
the (Af0As0) increases linearly with increasing the CW.
0 200 400 600 800 1000
0 0.5 1 1.5 2 2.5 3
Constrained strain
Recovery stress ,
σ
RR (%)
R
/MPa
Solution treatment 10%
20% 30%
∆ ε
εpr=6 12%
Fig. 8 Relationship between the recovery stressRand the recovery ratio "RRunder constrained strain condition.
0 10 20 30 40 50
0 10 20 30
∆
A
Cold working ratio, CW (%)
s
' / K
εpr
9%
6% =12%
Fig. 9 Variation ofAs0with cold working ratio.
0 30 60 90 120 150
0 10 20 30
∆
A
Cold working ratio, CW (%)
f
' /K
Constrained strain Stress free
=12% =12%
εpr
εpr =9%
εpr =6% εpr =6%
εpr =9%
[image:4.595.71.267.68.254.2]εpr
Fig. 10 Variation ofAf0with cold working ratio.
0 200 400 600 800 1000
Constrained strain
Recovery stress,σ /MPa
Increase of volume fraction of slip-deformed martensite,
∆ ξ
(%)
εpr
6% 9% =12%
Solution treatment 10%
20% 30%
R 50
40
30
20
10
0
Fig. 7 Relationship between the increase of volume fraction of slip-deformed martensite and the recovery stressRunder constrained
[image:4.595.332.525.75.263.2] [image:4.595.330.525.307.495.2] [image:4.595.72.268.318.513.2]Furthermore, the (Af0As0) increases linearly with
increas-ing of recovery stressR, too. Therefore under constrained
strain, the (Af0As0) increases with increasing theCW and
R. This fact means that the thermal responsibility becomes
worse. In addition, the temperature difference (Af0As0) is
little affected by pre-strain.
4. Conclusion
The effect of cold working ratio on the transformation and deformation characteristics after pre-strain in Ti–50 at%Ni alloy were investigated. The discussion were done using volume fraction of slip-deformed martensite. The obtained results are summarized as follows;
(1) The increasing of the cold working ratio enhances the critical stress for slip and suppresses the introduction of further slip-deformation by pre-strain. The volume
fraction of slip-deformed martensite which represents the degradation of SME properties decreases with increasing the cold working ratio. It is reconfirmed by the index of slip-deformed martensite that the high reduction ratio improves the shape recovery ratio and the shape recovery stress.
(2) The raising ratio ofAsdecreases with increasing of cold
reduction ratio. In the stress free condition, that of Af
decreases with increasing of cold working ratio. In the constrained stress condition, that of Af increases
because the recovery stress prevents the transformation and also, that ofMsincreases.
(3) The temperature difference (Af0As0) of constrained
stress condition increases with cold working ratio and recovery stress, which makes worse thermal responsi-bility. However, that of stress free condition does not depend on the cold working ratio and the pre-strain.
REFERENCES
1) S. Miyazaki, T. Sakuma and T. Shibuya:Properties and Application Development of Shape Memory Alloy(CMC, Japan 2001) 233–260. 2) T. Honma: J. Jpn. Soc. Mech. Eng.87(1984) 517–522.
3) K. Yamauchi: Jpn. Inst. Met.7(1993) 495–499. 4) M. Miyagi: Jpn. Inst. Met.24(1985) 69–74. 5) T. Saburi: Metals and Technology59(1989) 11–18.
6) S. Miyazaki and H. Sakamoto: Jpn. Inst. Met.24(1985) 33–44. 7) T. Todoroki and H. Tamura: J. Jpn. Inst. Met.50(1986) 538–545. 8) T. Sakuma, M. Hosogi, N. Okabe, U. Iwata and K. Okita: Mater. Trans.
43(2002) 815–821.
9) T. Sakuma, M. Hosogi, N. Okabe, U. Iwata and K. Okita: Mater. Trans.
43(2002) 828–833.
10) S. Miyazaki: J. Mater. Sci. Soc. Jpn.27(1990) 59–67.
11) M. Piao, K. Otsuka, S. Miyazaki and H. Horikawa: Mater. Trans., JIM
34(1993) 919–929.
12) H. G. Yong and C. M. Wayman: Acta Met.22(1974) 887–896. 13) G. B. Olson and M. Cohen: Scr. Met.9(1975) 1247–1254. 0
0 10 20 30
[image:5.595.74.268.75.260.2]Cold working ratio, CW (%)
Fig. 11 Variation ofMs0with cold working ratio under constrained strain
condition.
0 30 60 90 120 150
0 10 20 30
A f
' - A
Cold working ratio, CW (%)
s
' /K
Constrained strain Stress free
=6% =6%
=9% =9%
=12% =12%
εpr
εpr
εpr εpr
εpr
[image:5.595.329.523.76.259.2]εpr
Fig. 12 Variation ofAf0As0with cold working ratio.
0
0 200 400 600 800 1000
Recovery stress,σR /MPa
Fig. 13 Relationship between Af0As0 and recovery stress R under
[image:5.595.72.268.313.497.2]