An Interactive Framework Based on Geometry
Driven Data Distribution and Parallelisation
Vasco Varduhn, Ralf-Peter Mundani, Ernst Rank
Abstract—In this paper, we present an interactive framework, which is capable of delivering access to huge amounts of data from Building Information Models (BIM) and digital terrain data by using hierarchical data structures and elaborate algorithms in an efficient multi-level fashion. This framework bridges the gap between big datasets and accurate numerical simulations by exploiting parallelisation and data distribution techniques based on the geometric information existing at various levels.
By having such a framework at hand, results of numerical simulations become applicable, which take on the one hand side multi-level geometric information from a global to a fine detailed level into account, and on the other hand side can make use of auxiliary information. These auxiliary information result from the underlying product model data and give the input for simulation relevant details, such as part specific material parameters e.g.
As applications of the framework, besides a scalable parallel immersive visualisation, we present the integration of a mas-sive parallel CFD simulation following the Lattice-Boltzmann-Method, a multi-scale extension of a spatial version of the Structured-Query-Language(SQL), and the coupling to a grid generation framework.
Index Terms—spatial data decomposition, data distribution, built infrastructure (BIM/IFC), hierarchical data structures, numerical simulations
I. INTRODUCTION
T
ODAY, in scientific fields such as computational engineering [1], [2], civile engineering [3], [4], [5], [6] disaster management [7], or environmental sciences [8], [9], there are many scientific simulations giving the user a tool at hand to predict the behavior of a newly built building during a rain storm, the impact of a tsunami to coastal regions or the thermal behavior of a person using a room during the life cycle of a building. On the other hand, the amount of available input data for constructions and built infrastructure [10], digital terrain data [11], or subsurface information is growing rapidly.In this paper, we present an interactive framework, which is capable of delivering access to huge amounts of data from Building Information Models (BIM) and digital terrain data by using hierarchical data structures and elaborate algorithms in an efficient multi-level fashion. This framework bridges the gap between big datasets and accurate numerical simulations by exploiting parallelisation and data distribution techniques based on the geometric
Manuscript received July 16, 2011; revised August 16, 2011.
Computation in Engineering, Technische Universit¨at M¨unchen, Arcis-strasse 21, 80290 M¨unchen, GERMANY. Corresponding author con-tact: phone: +49-89-289-25063; fax: +49-89-289-25051; e-mail: [email protected]
information existing at various levels.
By having such a framework at hand, results of numerical simulations become applicable, which take on the one hand side multi-level geometric information from a global to a fine detailed level into account, and on the other hand side can make use of auxiliary information. These auxiliary information result from the underlying product model data and give the input for simulation relevant details, such as part specific material parameters e.g.
As applications of the framework, besides a scalable parallel immersive visualisation, we present the integration of a massive parallel CFD simulation following the Lattice-Boltzmann-Method, a multi-scale extension of a spatial version of the Structured-Query-Language(SQL), and the coupling to the grid generation framework Peano [12].
This paper is organised as follows: In the first part, an overview over the implemented data structures and the performed data distribution is given, followed by the imple-mented concept of hybrid parallelisation. In the second part, three applications of the framework are introduced, and this paper closes with the achieved results and the outlook for future work.
II. OVERVIEW OF THEUSEDDATASTRUCTURES AND
ARCHITECTURE OF THEFRAMEWORK
Fig. 1. Visualisation of BIM and terrain data on a global scale.
Fig. 2. Visualisation of a detailed in house scale.
Based on this (initially unstructured) set of data, we implemented a hierarchical data structure, based on octrees, generated on the bounding boxes of all constructions. The octree follows the idea of spatial decomposition and applies the following hierarchical algorithm to the considered domain, starting with the whole domain. If the domain is not completely within or outside the objects to approximate, it halves the domain along every axis and applies the algorithm recursively on all child domains.
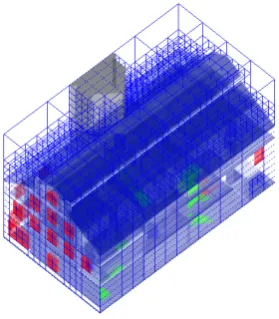
Fig. 3. Global first-level octree covering the bounding boxes of all BIM models.
[image:2.595.54.284.246.383.2]Once this data structure is build up, we have an efficient tool at hand for evaluating all questions concerning global location awareness and an implicit assembly of our data basis, as it is illustrated in figure 3.
Fig. 4. Local second-level octree approximating a single BIM model.
Besides this global first-level octree representation of the whole set of data, the octree is also applied to every single construction of our set. The build up of these second-level octrees is a highly dynamic process depending on the user behavior and therefore ensures the feasibility of the framework due to limited computational and storage resources. Having these second-level octrees, see figure 4, at hand, the evaluation of local queries concerning visibility decisions for single buildings can be answered, furthermore a hierarchical representation of fine construction details opens the door for further applications such as indoor path finding or evacuation scenarios e.g. For a detailed description of the presented techniques, the reader is referred to [14].
III. DISTRIBUTION BASEDDECOMPOSITION
Whereas efficient data structures and elaborate algorithms can almost always increase the performance and often are necessary for the applicability of a framework, the pure amount of data and the architecture of modern hardware make parallelisation and data distribution an inevitable technique to achieve the full performance of a system.
In a first step, we identified four different types of tasks and their dependencies in the framework, as shown in figure 5. This is used as a first layer for the distribution of the workload to different processes and communication is implemented by using the MPI interface [15].
[image:2.595.57.279.566.669.2] [image:2.595.312.540.598.746.2]The first group, which consists only of a single process, is the master process and holds the first-level octree as introduced in section II. As the octree is an efficient hierarchical data structure, it can be expected, that it can be kept in a single process in main memory. The master process is the center piece, which answers all requests directly, if they can be evaluated with the first-level octree, or indirectly by forwarding the task to further processes, and therefore by exploiting non-blocking communication patterns ensures sufficient fast response times.
The single BIM files and their octree representation are kept in memory by a group of k processors, whereas the distribution is made in a fashion, such that during the runtime of the framework all models in scope are equally distributed over the processors to avoid delayed response times. To assure this, at the initialisation of the framework, all BIM files that are to be loaded to the framework, are sorted ascending by their distance to the middle point of the domain. This list is then using a round robin distribution balanced over the processors to avoid a clustering of model allocations to few or even single processors in certain regions of the domain and therefore ensures, that a query based on the surrounding of a point or region scales over many processors.
Concerning the visualisation of the stored data, the amount of running processes is directly given by the topology of the visualisation platform, the framework is run on. In this setting, every viewport receives a single process to visualise a part of the data. For an installation with multiple e.g. tiled displays, every display receives a single process to be run on its attached part of the visualisation cluster, in a stereoscopic setting every display is driven by two processes to generate the different output needed for the generation of the left and right eye component of a frame. As already mentioned, the implementation of the MPI communication in a non-blocking fashion ensures, that the visualisation is performed efficiently, due to the fact that the raw data are directly uploaded to the GPU memory as soon as they are completely received by the visualisation process and no drop of the frame rate is introduced by waiting for updates to be transfered completely.
As numerical simulations are a time and resource consuming task in computer sciences and nowadays are almost exclusively run fully in parallel, one main aspect is the avoidance of bottlenecks of response times as they slow down the whole simulation and hinder good speedup values of the application. Therefore, we implemented an interface for the coupling of simulations, which on the one hand side delivers the geometry information and boundary conditions from the framework and on the other hand side controls the simulation. This interface is run in a group of simulator process, whereas each process drives one simulation run on the framework.
After introducing the group of four different types of processes, the orchestration of these processes puts the framework into practice and therefore delivers the content requested by the user. Visualisation is a process
which is completely driven by the interaction with the user respectively by the position of the camera in the domain. Therefore during runtime one single process of the visualisers sends the updated position based on the movements to the master process, if the difference exceeds a certain threshold. As the master process holds the first-level octree, it identifies the models and therefore processors holding the subset of the models whose visualisation has to be updated and notifies them to update the visualisation, in most cases, this depends on the distance to the camera and therefore changing level of detail to be applied. Each processor then generates the data for the updated visualisation of the affected models and sends it to all visualisation processes. As already mentioned, this is done in a non-blocking fashion and therefore the visualisation is swapped without delays, as soon as the new data arrived completely at the visualiser process.
This paradigm of the master receiving a change request and distributing the workload of processing the data is im-plemented in the complete framework and will be introduced in more detail for further scenarios of the framework in V.
IV. HYBRIDSETTING- PARALLELISATION OF SINGLE PROCESSES
As we already introduced the decomposition of processes using MPI for achieving a hybrid parallelisation and therefore further increased performance, the application of shared memory using OpenMP [16] parallelisation is put into practice. The visualisation processes are not affected by a shared memory parallelisation, as neither the used OpenGL [17] standard directly supports parallel rendering nor it would lead to increased performance.
For processes of type master, processor and simulator as described in figure 5, data as well as function parallelism has been applied. Data parallelism offers the possibility to profit from the count of cores of the processor(s) with an almost linear speedup, if as in our case the instructions of the single loop iterations do not depend on each other. All loops in the framework running over the triangles of the mesh or the graphic representation of the BIM files are distributed to the cores and therefore run in parallel.
although in overlapping accesses more threads are running than cores are available, due to the combination of data and function parallelism.
V. APPLICATIONS OF THEFRAMEWORK
In this chapter, we show three examples of applications to our framework which can be combined in almost free combi-nations. Conditional compiling is implemented to generate an efficient version of the software for every purpose and adds only features such as visualisation or the different simulation kernels on request.
A. Enriched SQL-Interface
The Structure-Query-Language (SQL) is a standard language for querying datasets or databases and therefore is one possibility of an interface to use the data basis of our framework like a database. Whereas it is easy to see, that a single BIM file easily can be queried by standard tools [10], the evaluation of queries against all constructions forming a whole city or even country is not straight forward. Having such a tool at hand, gives the user the possibility to evaluate questions such as the search for the closest building, that has a room with an air condition and at least 1000 sqf. of space. The application areas of such a tool range from disaster management [7] to the development of augmented navigation systems for cities [18], just to name a few.
A sample query can be found in 1 and is evaluated forwarding the whole string to the master processes. Based on thedistanceT o(·)all models and therefore processes are identified, that fulfill this part of the WHERE clause and the SQL query is forwarded to them. Based on its local set of buildings, every processor in parallel performs the evaluation of the where clause and sends the results to the corresponding simulator process running this query. After all processors have send their data or an empty message in case that none of their data fulfill the query, the grouping is performed by the simulator process, aggregate functions are applied and the ordering condition is fulfilled. By implementing this interface, almost arbitrary queries can be performed on the loaded data whereas it has to be mentioned, that the depth of iterated aggregate functions is limited to two.
Algorithm 1 Augmented spatial SQL query. SELECT max ( c o u n t ( d o o r s ) )
FROM b u i l d i n g s
WHERE ( IFC has AC = TRUE
AND SUM( I F C f l o o r s p a c e ) > 1 0 0 0 )
AND d i s t a n c e T o ( m y p o s i t i o n ) < 1000 GROUP BY b u i l d i n g s . ID
ORDER BY d i s t a n c e T o ( m y p o s i t i o n )
B. CFD-Simulation
In modern engineering applications and fields of scientific computing, CFD simulations are of great interest. Whereas the dynamics underlying the physical behavior and their
[image:4.595.326.527.243.321.2]application on different but fixed scales is well known and studied [19], multi-scale simulations are still a topic of ongoing research. Overcoming the challenges of multi-scale simulations opens the door for applications such as holistic urban planning for new buildings before the first part of the construction is built or the preparation for tsunami waves in coastal region. This opens the door to the field of urgent computing relevant topics, as it bridges the gap between complex numerical simulations and the need for a just-in-time delivery of results.
[image:4.595.320.527.403.516.2]Fig. 6. Geometric input highliting different (temperature) boundary conditions.
Fig. 7. CFD-simulation results for urban geometries based on terrain and construction data.
We coupled an existing implementation of the Lattice-Boltzmann-Method (LBM) using a D3Q15 model based on finite differences in space and time [20]. This implementation is validated and follows a strict massive parallel approach and has been successfully run on the German National Supercomputer HLRB II [21], covering almost one third of the whole machine. Due to the structure of the framework, coupling the code could be ensured by implementing a simulator process, see 5, which generates the geometry by evaluating the first-level octree for the grid generation and in the applied pure convection scenarios generates the boundary conditions from the distinction between the different heat values of the terrain, buildings, and their surrounding fluid.
C. Coupling the Peano Framework
boundary conditions delivered by the framework, the grid generation framework Peano [12] has been coupled, whereas the structure of Peano and the presented framework follow the same paradigm of an message based information exchange. The Peano framework runs in a loose coupled, parallel environment and initially receives the size and resolution of the computational domain. During the generation of the grid, the information of the intersection of the grid points is queried against the framework and in most cases can be evaluated on the relation of the point to the given terrain data or first-level octree, in very fine grain resolutions the processors containing the fully detail BIM models and their octree representation can be evaluated. It is to be mentioned, that the communication between Peano and the presented framework is implemented in an efficient way, such that even the messages querying the geometry can be packed together in an adjustable size to hide latency and adapt to the given topology of the underlying hardware such as clusters. The interested reader is referred for a detailed description in [12].
Fig. 8. Section of the generated regular grid.
Fig. 9. Section of the generated adaptive grid.
VI. RESULTS
To show the applicability of the presented framework, we list the results of the framework achieved within the different scopes. Concerning the evaluation of SQL like queries, a linear growth of the execution time could be measured, whereas it has to be mentioned, that the x-Axis given in figure 10 lists the amount of BIM files per process holding the model data and therefore has to be multiplied with the amount of processes to receive the amount of handled models.
Fig. 10. Achieved response times over increasing amount of constructions.
[image:5.595.54.284.327.440.2]Concerning the visualisation performance, tests could be performed on the VisLab@KAUST [22] under the following conditions. The single models have a fully-detailed resolution of approximately 150.000 Triangles per model and the terrain a resolution of 2000 times 2000 mesh points. On the available hardware equipped with a visualisation cluster with eleven Nodes, the visualisation was run on 21 passive 3D monitors. As for each monitor the generation of two independent images is required, this sums up to a need of 42 different images per frame, which could be ensured with a sufficient real-time rendering performance of more than 60 fps.
Fig. 11. The framework running on the NexCAVE in VisLab@KAUST
VII. CONCLUSION
In this paper, we presented an approach how a distributed, hybrid framework can combine the arising of huge data sets from constructions, built infrastructure, and terrain data with accurate multi-scale numerical simulations and therefore produces an additional value for modern computational engineering and scientific computing applications.
[image:5.595.311.541.424.578.2] [image:5.595.55.282.501.593.2]ACKNOWLEDGEMENTS
This publication is based on work supported by Award No. UK-c0020, made by King Abdullah University of Science and Technology (KAUST).
Furthermore, the work in this project is supported by the International Graduate School of Science and Engineering (IGSSE) of Technische Universit¨at M¨unchen.
REFERENCES
[1] M. Kluth, A. Borrmann, E. Rank, T. Mayer, and P. Schiessl, “3D Building Model-Based Life-Cycle Management of Reinforced Con-crete Bridges,”Proc. of the 7th European Conference on Product and Process Modelling (ECPPM’08). Sophia-Antipolis, France, 2008. [2] I. Faraja, M. Alshawi, G. Aouad, T. Child, and J. Underwood, “An
industry foundation classes Web-based collaborative construction com-puter environment: WISPER ,”Automation in Construction, vol. 10, pp. 79–99, 2000.
[3] T. Froese and K. Yu, “Industry Foundation Class Modeling for Esti-mating and Scheduling ,”8th International Conference on Durability of Building Materials and Components, 1999.
[4] M. Alshawi, G. Aouad, I. Faraj, T. Child, and J. Underwood, “The implementation of the industry foundation classes in integrated envi-ronments,”CIB W78 Conference, pp. 55–66, 1998.
[5] B. Bj¨ork, “The RATAS project — an example of co-operation between industry and research toward computer integrated construction.” Jour-nal of Computing in Civil Engineering, ASCE, p. 401–419, 1994. [6] J. Benner, A. Geiger, and K. Leinemann, “Flexible Generation of
Semantic 3D Building Models,”Proc. of the 1st Intern. Workshop on Next Generation 3D City Models, 2005.
[7] P. van Oosterom, S. Zlatanova, and E. M. Fendel, “Geo-information for Disaster Management,”Springer Berlin Heidelberg, 2005. [8] L. Albrechts, “Strategic (spatial) planning reexamined,”Environment
and Planning B: Planning and Design, vol. 31, p. 743 – 758, 2004. [9] E. Sfakianaki and M. O’Reilly, “Gis in road environmental planning
and management,”Urban Transport VIII: Urban Transport and the Environment in the 21st Century, vol. 60, 2002.
[10] TNO Building and Construction, “ IFC Engine ,”
http://www.ifcbrowser.com/.
[11] J. Lebiedz and K. Mieloszyk, “Real terrain visualisation on the basis of gis data,”Intelligent Media Technology for Communicative Intelligence, pp. 40–49, 2005.
[12] P. Neumann, T. Neckel, and T. Weinzierl, “The peano framework,” Jun. 2010.
[13] IFC2x3 TC1 Release, “IFC Specification,” http://www.iai-tech.org/products/ifc specification/ifc-releases/ifc2x3-tc1-release. [14] V. Varduhn, R.-P. Mundani, E. Rank, “Real time processing of large
data sets from built infrastructure,”To be published in the Proc. of the 7th Int. Conf. on Cybernetics and Information Technologies, Systems and Applications, 2010.
[15] A. N. Laboratory, “The message passing interface (mpi) standard,”
http://www.mcs.anl.gov/research/projects/mpi/.
[16] OpenMP, “The OpenMP API specification for parallel programming,”
http://openmp.org/.
[17] Khronos Group, “The opengl standard,”http://www.opengl.org/. [18] R. Azuma, B. Hoff, H. N. III, and R. Sarfaty, “A motion-stabilized
outdoor augmented reality system,” Proceedings of IEEE Virtual Reality ‘99, 1999.
[19] M. Griebel, T. Dornseifer, and T. Neunhoeffer,Numerical Simulation in Fluid Dynamics, a Practical Introduction. Philadelphia: SIAM, 1998.
[20] C. van Treeck, E. Rank, M. Krafczyk, J. T¨olke, and B. Nachtwey, “Extension of a hybrid thermal lbe scheme for Large-Eddy simulations of turbulent convective flows,”Computers and Fluids, vol. 35, pp. 863–871, 2006.
[21] Leibniz-Rechenzentrum, “Hardware description of hlrb 2,”
http://www.lrz.de/services/compute/hlrb/hardware/.
[22] KAUST, “Nexcave interactive visualization system,”