© The Authors, published by EDP Sciences. This is an open access article distributed under the terms of the Creative Commons
Polyelectrolytes and small angle scattering
Jérôme Combet*
Institut Charles Sadron, CNRS-Université de Strasbourg, 23 rue du Loess, B.P. 84047, 67034 Strasbourg Cedex 2, France
Abstract. We present an introduction to the application of small angle X-ray and neutron scattering to the study of polyelectrolyte solutions. We aim to give a simple overview of the structural information that can be gained with these techniques. In particular, we show how neutron scattering associated to isotopic labelling enables the determination of the different partial structure functions as well as the dispersion state and the average conformation of polyions.
1 Introduction
Polyelectrolytes (PEs) are polymers with ionisable groups that dissociate in polar solvent (such as water). Due to the long-range electrostatic interactions as well as the presence of dissociated counterions, their solutions show distinct properties than those of neutral polymers [1]. Their remarkable solubility in water is an important characteristic that can be used for instance to modify the rheological properties of aqueous solutions (thickener, gel…). The presence of electrical charges opens up additional possibilities trough the formation of electrostatic complexes with oppositely charged species (colloids, surfactants, PEs, proteins…) leading to new potential applications (flocculent, drug delivery, chemosensors, coatings…). The structural organisation of PEs solutions is a fundamental point to control in order to improve their applications. It concerns the average conformation and the dispersion state of macroions, but also, the distribution of counterions in the solution. In this context, small angle neutron and X-ray scattering (SANS and SAXS) are well-suited techniques since they allow a well-adapted distance scale (from few Å to several hundreds) to be probed.
In this contribution, we aim to present how scattering experiments can help us to understand the structural properties of PEs solutions1. We first briefly introduce PEs and recall their main characteristics (Sec. 2). Then, we give the basics of small angle scattering theory. We present the coherent scattering cross section and the partial structure functions related to the polyions and the counterions. We particularly emphasize the importance of the neutron scattering technique and the contrast variation method to separate these different contributions, but also, to extract the intramolecular (form factor) and intermolecular structure functions associated to the polyions (Sec. 3). We present experimental measurements and show the effects of the concentration, contrast factor and linear charge density on the scattering cross sections (Sec. 4). Finally, we give an example
*Corresponding author: [email protected]
of polyions form factor and intermolecular structure function and discuss their main characteristics (Sec. 5).
2 Polyelectrolytes
PEs are polymers with ionisable groups (Fig. 1). They can be classified according to the polyions properties such as the sign of the ionized group (polycations/polyanions) or their chemical charge fraction (highly charged/weakly charged PEs). Distinctions can also be made on the basis of the weak or strong acid/base character of the monomers (strong PEs/weak PEs), their hydrophilic/hydrophobic properties, the intrinsic rigidity of the chains… In this contribution, only salt-free aqueous solutions of linear, hydrophilic, flexible and strong PEs in the semidilute regime (i.e. above their overlap concentration cp*)
will be considered.
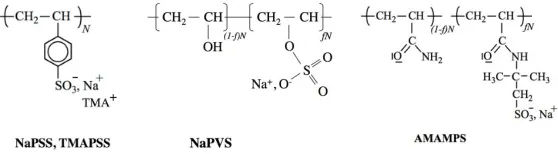
Fig. 1. Sodium/tetramethylammonium poly(styrene sulfonate): NaPSS, TMAPSS; Sodium salt of partially sulfuric acid esterificated poly(vinyl alcohol): NaPVS; Sodium salt of Poly(acrylamide-co-sodium-2-acrylamido-2-methylpropane sulfonate): AMAMPS.
Polyions can be considered as copolymers carrying ionized monomers and neutral ones (non-dissociated or non-ionisable groups of distinct nature, Fig. 2a). The structure of the solutions is highly dependent on the solvent quality (usually H2O) for the polymer backbones. Since the different type of monomers may have a different hydrophilic/hydrophobic character, the macromolecular organisation results from the balance between the electrostatic repulsions that stretch the polyions, and the hydrophobic interactions that lead to their collapse. In the following, we will consider that the physics of the system is mainly governed by the electrostatic repulsions (hydrophilic PEs).
(a) (b) (c)
Fig. 2. Schematic representation of a PE solution. The typical size of the monomer is b, the average
distance between charge is l, the degree of polymerization is N. There are Nc charged monomers and
counterions. The chemical charged fraction f is defined as f=Nc/N. (a) weakly charged PE; (b) highly
of polyions form factor and intermolecular structure function and discuss their main characteristics (Sec. 5).
2 Polyelectrolytes
PEs are polymers with ionisable groups (Fig. 1). They can be classified according to the polyions properties such as the sign of the ionized group (polycations/polyanions) or their chemical charge fraction (highly charged/weakly charged PEs). Distinctions can also be made on the basis of the weak or strong acid/base character of the monomers (strong PEs/weak PEs), their hydrophilic/hydrophobic properties, the intrinsic rigidity of the chains… In this contribution, only salt-free aqueous solutions of linear, hydrophilic, flexible and strong PEs in the semidilute regime (i.e. above their overlap concentration cp*)
will be considered.
Fig. 1. Sodium/tetramethylammonium poly(styrene sulfonate): NaPSS, TMAPSS; Sodium salt of partially sulfuric acid esterificated poly(vinyl alcohol): NaPVS; Sodium salt of Poly(acrylamide-co-sodium-2-acrylamido-2-methylpropane sulfonate): AMAMPS.
Polyions can be considered as copolymers carrying ionized monomers and neutral ones (non-dissociated or non-ionisable groups of distinct nature, Fig. 2a). The structure of the solutions is highly dependent on the solvent quality (usually H2O) for the polymer backbones. Since the different type of monomers may have a different hydrophilic/hydrophobic character, the macromolecular organisation results from the balance between the electrostatic repulsions that stretch the polyions, and the hydrophobic interactions that lead to their collapse. In the following, we will consider that the physics of the system is mainly governed by the electrostatic repulsions (hydrophilic PEs).
(a) (b) (c)
Fig. 2. Schematic representation of a PE solution. The typical size of the monomer is b, the average
distance between charge is l, the degree of polymerization is N. There are Nc charged monomers and
counterions. The chemical charged fraction f is defined as f=Nc/N. (a) weakly charged PE; (b) highly
charged PE (Nc=N, f=1) and condensation phenomenon; (c) net charge fraction versus chemical charge fraction f according to the MO theory.
The properties of PEs solutions naturally depend on the linear charge density, i.e. the fraction of dissociated groups along the polyions. The chemical charge fraction f is defined as the ratio of the number of ionized groups Nc to the degree of polymerization N (f=Nc/N,
€
0
≤
f
≤
1
). In the case of rigid (or locally rigid) polyions with monomers of size b and an average distance between ionized groups l, f is also equal to b/l.For high chemical charge fractions (f→1), the electrostatic potential around the polyions
is very huge and part of the counterions is trapped in the vicinity of the chains (Fig. 2b). This condensation phenomenon leads to a charge renormalization and an effective charge fraction
€
feff < f. In the framework of the Manning-Oosawa theory (MO) [3, 4], it occurs
when the average distance between charged monomers is equal to the Bjerrum length2 l B
(monovalent counterions). The variation of the net charge fraction with the chemical charge fraction f is presented in Fig. 2c. For
€
f
<
b l
B(weak-coupling regime), it corresponds to the chemical charge fraction f; for€
f >b lB(strong-coupling limit), it is constant and given by the effective charge
€
feff =b lB. The counterion condensation threshold corresponds to the boundary between these regimes
€
fthreshold=b lB.
3 Small Angle Scattering
A PE solution is a complex system containing polyions and counterions (solute) as well as solvent molecules (usually water). In a small angle scattering experiment, we measure the total differential scattering cross section per unit volume3
€
Σ
total(
q ,c
p)
(cm-1), which contains the coherent scattering cross section€
Σ
coh(
q ,c
p)
related to the solute, and a flat “background”€
Σ
B(c
p)
, which has to be removed [5]. This later contribution combines scattering from the solvent as well as incoherent scattering from the solute in the case of neutron scattering. For highly charged PEs (f=1), it can be written€
Σ
B(c
p)
= Φ
sΣ
S+
c
pN
aσ
inc4
π
(1)where
€
ΣS (cm-1) is the differential scattering cross section of the solvent; Φs its volume
fraction; cp, the PE concentration (mol cm-3);
€
σinc (cm2), the incoherent cross section of a monomer including its counterions (cm2) and N
a the Avogadro’s number (mol-1). In the
following, we will only discuss the coherent scattering cross section related to the solute,
€
Σ
coh(
q ,c
p)
, that contains all the information about the structural organization of the PE.3.1 Scattering cross sections and partial structure functions
In a small angle scattering experiment, the spatial resolution (> 5Å) is always larger than the inter-atomic distances. Atoms are no longer considered as the elementary scatterers and can be replaced by monomers or molecules (molecular counterions, solvent) [5].
The coherent scattering cross section per unit volume
€
Σ
coh(
q ,c
p)
(in cm-1) can be written€
Σcoh(q ,c p)= 1
V KiKj exp i
[
q (
r i−r j)
]
i,j∑
, K=a−as ννs (2)
2 In pure water at 25°C, l
B=7.14 Å.
where Ki and Kj are the contrast lengths (cm) of the elementary scatterers i and j (monomers
or counterions) relative to the solvent. a and as are the coherent scattering lengths (cm) of the scatterers and the solvent4, and v and vs, their partial molar volumes (cm3/mol). These quantities can be determined from the atomic or chemical composition of the scatterers, assuming additivity of their coherent scattering lengths and their partial molar volumes. Contrast lengths of the monomer (m) Km and the counterions (c) Kc relative to the solvent
(s) can also be written as a function of the scattering length densities ρm, ρc, ρs (cm-2) 5
€
Km=am−asνm
νs
= νm
Na
ρm−ρs
(
)
Kc=ac−asννc s
= νc
Na
ρc−ρs
(
)
%
& ' '
( ' '
with
€
ρm= am νmNa,
€
ρc=ac νc Na,
€
ρs= as
νsNa (3)
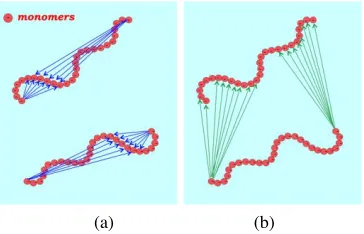
The coherent scattering cross section of the solute (Eq. (2)) can be split in three distinct terms by considering specifically monomer-monomer, counterion-counterion and monomer-counterion pairs in the summation (as illustrated in Fig. 3), leading to three partial structure functions Smm, Scc and Smc associated to the monomers (m) and the
counterions (c)6:
€
Σ
coh(q)
=
K
m2S
mm(q)
+
K
c2S
cc(q)
+
2K
mK
cS
mc(q)
(4)(a) (b) (c)
Fig. 3. Illustration of the three distinct summations according to the nature of the elementary
scatterers pairs (arrows): (a) monomer-monomer pairs; (b) counterion-counterion pairs; (c) monomer-counterion pairs. These summations lead to the three partial structure functions Smm, Scc, and Smc respectively.
The partial structure functions (Eq. (4)) are weighted by
€
K
m2 and€
K
c2 (cm2), the contrast factors of the monomers and counterions relative to the solvent.These partial structure functions contain all the information about the organisation of the monomers (
€
Smm), the counterions (
€
Scc), and the cross structure (
€
Smc).
€
Smm combines
intramolecular (form factor) and intermolecular terms related to the macroions. For
4 For neutrons, the scattering lengths of atoms and ions depend on the nuclei properties. For X-rays, they are related to their number of electrons Ze: aX (10-13 cm) = 2.82 Ze.
5Using conventional units, we have: ρ(1010cm−2)= ∑a(10−13cm)
v(cm3mol−1)
∑ 6.022(10
23mol−1).
6 We will mainly consider the modulus of the scattering vector q considering an isotropic scattering.
5 where Ki and Kj are the contrast lengths (cm) of the elementary scatterers i and j (monomers
or counterions) relative to the solvent. a and as are the coherent scattering lengths (cm) of the scatterers and the solvent4, and v and vs, their partial molar volumes (cm3/mol). These quantities can be determined from the atomic or chemical composition of the scatterers, assuming additivity of their coherent scattering lengths and their partial molar volumes. Contrast lengths of the monomer (m) Km and the counterions (c) Kc relative to the solvent
(s) can also be written as a function of the scattering length densities ρm, ρc, ρs (cm-2) 5
€
Km=am−asνm
νs
=νm
Na
ρm−ρs
(
)
Kc=ac−asννc s
= νc
Na
ρc−ρs
(
)
% & ' ' ( ' ' with €ρm= am νmNa,
€
ρc= ac νc Na,
€
ρs= as
νsNa (3)
The coherent scattering cross section of the solute (Eq. (2)) can be split in three distinct terms by considering specifically monomer-monomer, counterion-counterion and monomer-counterion pairs in the summation (as illustrated in Fig. 3), leading to three partial structure functions Smm, Scc and Smc associated to the monomers (m) and the
counterions (c)6:
€
Σ
coh(q)
=
K
m2S
mm(q)
+
K
c2S
cc(q)
+
2K
mK
cS
mc(q)
(4)(a) (b) (c)
Fig. 3. Illustration of the three distinct summations according to the nature of the elementary
scatterers pairs (arrows): (a) monomer-monomer pairs; (b) counterion-counterion pairs; (c) monomer-counterion pairs. These summations lead to the three partial structure functions Smm, Scc, and Smc respectively.
The partial structure functions (Eq. (4)) are weighted by
€
K
m2 and€
K
c2 (cm2), the contrast factors of the monomers and counterions relative to the solvent.These partial structure functions contain all the information about the organisation of the monomers (
€
Smm), the counterions (
€
Scc), and the cross structure (
€
Smc).
€
Smm combines
intramolecular (form factor) and intermolecular terms related to the macroions. For
4 For neutrons, the scattering lengths of atoms and ions depend on the nuclei properties. For X-rays, they are related to their number of electrons Ze: aX (10-13 cm) = 2.82 Ze.
5Using conventional units, we have:
€
ρ(1010cm−2)= ∑a(10−13cm)
v(cm3mol−1)
∑ 6.022(10
23mol−1).
6 We will mainly consider the modulus of the scattering vector q considering an isotropic scattering.
The c dependence of the scattering functions will only be mentioned if necessary.
counterions, which are not covalently bounded, this distinction could be meaningless. However, for highly charged PEs, they condense around the polyions and partly reproduce the organisation of the polyions. The cloud of condensed ions can therefore be considered as a dynamical large scale “self assembled” system: the notion of form factor is recovered and the separation between intra- and intermolecular terms makes sense. Scc therefore
reflects the average conformation and the dispersion state of the cloud of condensed counterions. In this description, the contribution of the free counterions only appears as a flat contribution in the scattering cross section.
In a neutron scattering experiments, it is possible to determine each of the partial structure functions
€
Smm,
€
Scc and
€
Smc by using isotopic labelling and the contrast variation
method, or the contrast matching method. This can be achieved using a subtle combination of deuterated macroions or counterions and a suited mixture of H/D solvent molecules. For H2O/D2O mixtures, the scattering length density of the solvent is given by
€
ρ
s=
φ
vHρ
sH+
(1
−
φ
vH)
ρ
sD (5)where
€
φvHis the volume fraction of the H water. A judicious choice of
€
φvH allows to match the scattering length density of the solvent ρs to ρc (Kc=0) or ρm (Km=0) and to
directly determine the macroion (
€
ρs=ρc
,
€
Σcoh(q)=Km2Smm(q)) or the counterion (
€
ρs=ρm
,
€
Σcoh(q)=Kc2Scc(q)) partial structure functions. This provides a real advantage over other small angle scattering techniques (SAXS or light scattering). In SAXS measurements, we are usually in an intermediate contrast situation (Kc≠0 and Km≠0) and all
partial structure functions contribute to the coherent scattering cross section.
All these structure functions combine intra- and intermolecular contributions. Behind this apparent complexity, they are usually well suited to characterize the dispersion state of the macroions (and the condensed counterions). Indeed, the scattering functions usually display a maximum that is characteristic of the organization of the polyions in salt-free solutions.
3.2 Intra- and intermolecular structure functions
When we are concerned with the form factor of macroions and their intermolecular correlations, it is necessary to go beyond the previous scattering cross sections. We will assume hereafter that Kc=0 and therefore, that the contribution of counterions to the
scattered intensity is negligible. The coherent scattering cross section becomes
€
Σcoh(q,cp)=Km2Smm(q,cp), or simply,
€
Σcoh(q,cp)=K2S(q,cp).
€
S(q,cp) is usually called the total structure function and noted
€
ST(q,cp).
By differentiating the monomer pairs belonging to the same polyions or to different chains,
€
S(q,cp) can be split in two distinct parts associated with intra- and intermolecular correlations respectively (Fig. 4):
€
S(q,cp)=ST(q,cp)=cpg(q,cp)=S1(q,cp)+S2(q,cp)=cpg1(q,cp)+cp2g2(q,cp)
(6)
In this expressions,
€
S1(q,cp) and
€
S2(q,cp) are the intra- and intermolecular structure functions (cm-3).
€
function in the Van Hove’s formalism [6];
€
g1(q,cp), the form factor (without unit);
€
g2(q,cp), the intermolecular correlation function (cm3). cp is the PE monomer
concentration (cm-3). Since electrostatic interactions are repulsive,
€
S2(q,cp) and
€
g2(q,cp) are negative functions.
(a) (b)
Fig. 4. Illustration of the two types of summation. Counterions are neglected. (a) monomer pairs
along the same polyions: intramolecular structure function S1(q); (b) monomer pairs on distinct polyions: intermolecular structure functions S2(q).
To determine the form factor of the polyions
€
g1(q,cp), the “classical” extrapolation to zero concentration is not feasible in salt-free PEs solution: the dilution modifies the strength of the electrostatic interactions and therefore, the average conformation of the chain. Using neutron scattering and its unique isotopic H/D substitution possibility, other methods are however possible. The “Zero Average Contrast” technique (ZAC) enables the determination of
€
g1(q,cp) in a single measurement. For a mixture of identical H/D chains (total monomer concentration cp), the coherent scattering cross section can be written
€
Σcoh(q,cp)=KH2SHH(q,cp)+KD2SDD(q,cp)+2KHKDSHD(q,cp)
(7)
If H and D macroions have the same degree of polymerization, their form factor
€
g1(q,cp) and their intermolecular correlation function
€
g2(q,cp) are identical. For a fraction x of hydrogenated chains, the partial structure functions are:
€
SHH(q,cp)=xcpg1(q,cp)+x2cp2g2(q,cp)
SDD(q,cp)=(1−x)cpg1(q,cp)+(1−x)2cp2g2(q,cp)
SHD(q,cp)=x(1−x)cp2g2(q,cp) #
$ % %
& % %
(8)
and Eq. (7) becomes
€
Σcoh(q,cp)=[xKH2+(1−x)KD2]cpg1(q,cp)+[ xKH+(1−x)KD]2cp2g2(q,cp)
(9)
The second term, related to the intermolecular correlations can be cancelled providing that the average contrast
€
[ xKH+(1−x)KD] is equal to zero. We usually choose
€
x=0.5, leading
to
€
KH= −KD=K. The coherent scattering cross section is thus a simple function of the
function in the Van Hove’s formalism [6];
€
g1(q,cp), the form factor (without unit);
€
g2(q,cp), the intermolecular correlation function (cm3). cp is the PE monomer
concentration (cm-3). Since electrostatic interactions are repulsive,
€
S2(q,cp) and
€
g2(q,cp) are negative functions.
(a) (b)
Fig. 4. Illustration of the two types of summation. Counterions are neglected. (a) monomer pairs
along the same polyions: intramolecular structure function S1(q); (b) monomer pairs on distinct polyions: intermolecular structure functions S2(q).
To determine the form factor of the polyions
€
g1(q,cp), the “classical” extrapolation to zero concentration is not feasible in salt-free PEs solution: the dilution modifies the strength of the electrostatic interactions and therefore, the average conformation of the chain. Using neutron scattering and its unique isotopic H/D substitution possibility, other methods are however possible. The “Zero Average Contrast” technique (ZAC) enables the determination of
€
g1(q,cp) in a single measurement. For a mixture of identical H/D chains (total monomer concentration cp), the coherent scattering cross section can be written
€
Σcoh(q,cp)=KH2SHH(q,cp)+KD2SDD(q,cp)+2KHKDSHD(q,cp)
(7)
If H and D macroions have the same degree of polymerization, their form factor
€
g1(q,cp) and their intermolecular correlation function
€
g2(q,cp) are identical. For a fraction x of hydrogenated chains, the partial structure functions are:
€
SHH(q,cp)=xcpg1(q,cp)+x2cp2g2(q,cp)
SDD(q,cp)=(1−x)cpg1(q,cp)+(1−x)2cp2g2(q,cp)
SHD(q,cp)=x(1−x)cp2g2(q,cp) # $ % % & % % (8)
and Eq. (7) becomes
€
Σcoh(q,cp)=[xKH2+(1−x)KD2]cpg1(q,cp)+[ xKH+(1−x)KD]2cp2g2(q,cp)
(9)
The second term, related to the intermolecular correlations can be cancelled providing that the average contrast
€
[ xKH+(1−x)KD] is equal to zero. We usually choose
€
x=0.5, leading
to
€
KH = −KD=K. The coherent scattering cross section is thus a simple function of the
form factor:
€
Σcoh(q,cp)=K2cpg1(q,cp)=K2S1(q,cp)
g1(q,cp)=Σ coh(q,c
p)
K2c
p
(10)
The knowledge of
€
g1(q,cp) (or
€
S1(q,cp)) and
€
g(q,cp) (or
€
S(q,cp)) allows the determination of the intermolecular correlation function
€
g2(q,cp) (or
€
S2(q,cp)):
€
g2(q,cp)=S2(q,cp) cp2=
(
g(q,cp)−g1(q,cp))
cpS2(q,cp)=S(q,cp)−S1(q,cp) (11)
4 Coherent scattering cross sections
In this section, we present experimental scattering cross sections
€
Σcoh(q) measured on different PE solutions in different situations. We comment their general features in the light of the previous chapters, and in particular, their variations with the concentration, the contrast conditions and the chemical charge fraction. We finally give a simple picture for the structural organisation on the basis of a theoretical model.
4.1 General properties and concentration dependence
SANS and SAXS measurements on salt-free PE solutions usually show a maximum at a position q* that shifts to larger q-values as the concentration is increased [7-9]. This peak is characteristic of the electrostatic repulsions and disappears when salt is added to the solution (screening of the electrostatic interactions). In the dilute regime (cp<cp*, i.e. below
the critical overlap concentration), q* scales as cp1/3. The maximum is the signature of a soft
position order (“liquid-like order”) between the centres of mass of the chains [10]. In the semidilute regime (cp>cp*), macroions are entangled. The maximum is now related to the
correlations between polyion segments and q* scales as cp1/2. For higher concentrations
(concentrated solutions), other scaling exponents can also be observed according to the intrinsic thickness of the chains [11, 12].
Typical SAXS measurements (
€
Σcoh(q,cp) /cp) in the semidilute regime are presented in Fig. 5. They were obtained using synchrotron radiation (D2AM beamline, ESRF, Grenoble, France) on salt-free aqueous solutions of poly(styrene sulfonate) polyions (PSS-) with two different counterions (TMA+ and Na+). For these highly charged systems (f=1), a large number of counterions are condensed and trapped along the chains. The theoretical effective charge fraction feff is close to 0.36, corresponding approximately to one effective
charge every three monomers.
The scattering curves for these two systems are qualitatively similar. They show a broad scattering peak at a similar position q* which is displaced to larger q values when the concentration is increased. General comments can however be mentioned on these two systems.
If we consider the contrast condition for TMAPSS,
€
ρm>ρc ≈ρs: the scattering length density of the counterions is close to that of the solvent (Fig. 5c). The contrast length Kc is
therefore small compared to that of the monomer Km. We are in a situation where the
€
ρm ≈ρc>ρs,
€
Σcoh(q,cp) is a linear combination of three different partial structure functions. As it will be discussed in the next chapter, this explains the difference observed in the shape of the scattering cross sections for the highest q values, and more particularly, the faster reduction in the case of NaPSS [2, 13].
(a) (b) (c)
Fig. 5. Σcoh(q)/cp measured by SAXS on salt-free aqueous solutions of TMAPSS (a) and NaPSS (b) at different concentrations. For these PEs, f=1, and feff=0.36. (c) X-ray scattering length densities of the different components. For Na+, we consider the ρ value corresponding to the hydrated ion (Na+,
5H2O).
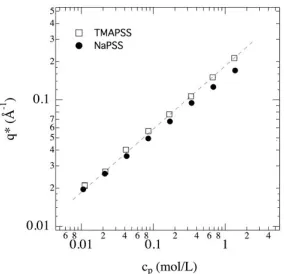
Fig. 6. Variation of q* with the concentration for TMAPSS and NaPSS. Dashed line corresponds to
the cp1/2 power law.
For these two systems, the variation of q* as a function of the concentration can be described by a power law close to
€
€
ρm ≈ρc>ρs,
€
Σcoh(q,cp) is a linear combination of three different partial structure functions. As it will be discussed in the next chapter, this explains the difference observed in the shape of the scattering cross sections for the highest q values, and more particularly, the faster reduction in the case of NaPSS [2, 13].
(a) (b) (c)
Fig. 5. Σcoh(q)/cp measured by SAXS on salt-free aqueous solutions of TMAPSS (a) and NaPSS (b) at different concentrations. For these PEs, f=1, and feff=0.36. (c) X-ray scattering length densities of the different components. For Na+, we consider the ρ value corresponding to the hydrated ion (Na+,
5H2O).
Fig. 6. Variation of q* with the concentration for TMAPSS and NaPSS. Dashed line corresponds to
the cp1/2 power law.
For these two systems, the variation of q* as a function of the concentration can be described by a power law close to
€
cp1/ 2 (Fig. 6). This is typical of hydrophilic PEs in the semidilute regime, where the interactions are dominated by the electrostatic repulsions. For hydrophobic PEs, this behaviour is usually lost, the power law exponent is reduced [14] and different regimes in concentration are observed [15]. A close inspection of the q* variation however reveals smaller values for NaPSS especially at high concentrations. This effect is not due to the hydrophobicity and could be explained by the combination of the different partial structure functions and [2, 13].
4.2 Contrast factors variations: Partial structure functions Smm and Scc
Experimental scattering cross sections are usually related to both components: polyions and counterions. To characterise their respective organization in the solution, it is necessary to determine their partial structure functions Smm and Scc. This can be achieved with neutron
scattering by using the contrast matching method. It requires the adjustment of the solvent scattering length density to that of the monomers (Scc measurement) or that of the
counterions (Smm measurement) using suited H2O/D2O mixtures.
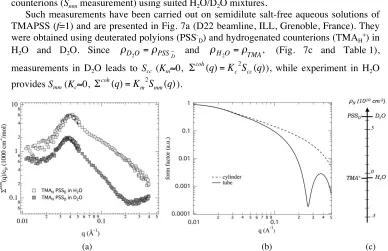
Such measurements have been carried out on semidilute salt-free aqueous solutions of TMAPSS (f=1) and are presented in Fig. 7a (D22 beamline, ILL, Grenoble, France). They were obtained using deuterated polyions (PSS-D) and hydrogenated counterions (TMAH+) in H2O and D2O. Since
€
ρ
D2O=
ρ
PSSD
− and
€
ρ
H2O=
ρ
TMA+ (Fig. 7c and Table 1),measurements in D2O leads to Scc (Km≈0,
€
Σ
coh(q)
=
K
c2S
cc(q)
), while experiment in H2O provides Smm (Kc≈0,€
Σ
coh(q)
=
K
m2S
mm(q)
).(a) (b) (c)
Fig. 7. (a) coherent scattering cross section Σcoh(q) measured by SANS on TMAHPSSD (f=1, feff=0.36) at cp=0.0425 mol/L in H2O and D2O. In H2O, Σcoh(q)=Km2Smm(q). In D2O, Σcoh(q)=Kc2Scc(q). (b) form factors (a.u.) of a rigid cylinder (radius: 5 Å, length: 200 Å), and for a tube (internal radius: 5 Å, external radius: 13 Å, length: 200 Å). (c) neutron scattering length densities of the different components.
Table 1. SANS parameters for TMA+
H andPSS-D in H2O and D2O.aN: neutron coherent scattering length, KN neutron contrast length, KN2 neutron contrast factor.
aN
(10-13cm)
v
(cm3/mol)
ρN
(cm-2)
KN in H2O
(10-13 cm)
KN2 in H2O
(10-26 cm2)
KN in D2O
(10-13 cm)
KN2 in D2O
(10-26 cm2)
PSSD- 120.17 114 6.35 130.8 17109 -0.7 0.5
TMAH+ -8.92 84.2 -0.64 -1.1 1.2 -98.2 9643
H2O -1.68 18.07 -0.56
D2O 19.15 18.07 6.38
monomer structure function Smm7. This means that the distribution of counterions is not
homogeneous in the solution and reproduces the spatial organization of the macroions [44]. This is a clear manifestation of the counterion condensation process. In the absence of condensation, one would expect a completely flat partial structure function Scc.
Another point concerns the shape of the scattering cross sections above q*, and more particularly, the presence of a minimum around 0.2 Å-1 in S
cc. This behaviour originates
from the form factor of the scattering objects. While a polyion can be assimilated to a rigid cylinder of a few Å in diameter (at a local scale), the cloud of condensed counterions can be viewed as a tube surrounding this cylinder. For large scattering vectors (q>q*), we can reasonably assume that the main contribution to Scc and Smm comes from the form factor of
these different entities8. The form factors of a tube and a cylinder are shown in Fig. 7b. A minimum and a first oscillation are clearly observed for the tube whereas they are out of the selected q range for the cylinder. This explains the shape behaviour observed in Scc around
0.2 Å-1. Furthermore, in between 0.06 and 0.2 Å-1, the decay of the theoretical form factor is much steeper in the case of the tube, a fact that is also observed in the experimental scattering cross sections9.
We can also learn quantitative information from the height of the maximum. Around q* (0.04 Å-1), the form factors are very close to each other. If we made the assumption that the scattering is dominated but the contribution of the form factor, the difference in intensities only originates from the contrast length and the concentration of monomers and condensed counterions. The latter can therefore be estimated, leading to an effective charge fraction of 0.4, very close to the theoretical one (0.36).
In conclusion, the shape of the partial structure functions (q>q*) can be qualitatively understood with the help of the form factor of the scattering entities. We can note that an exact calculation of the high q behaviour of Scc (above q*) is quite complex to determine
since counterions do not form a wall of constant scattering length density. It should be better approximated using the real counterion density profile determined from the Poisson-Boltzmann equation within a cylindrical cell model [16-18].
4.3 Effect of the linear charge density
To vary the chemical charge fraction, it is necessary to synthesize a random copolymer with ionisable and neutral monomers. Pioneer works were proposed by El Brahmi et al. using acrylamide-acrylic acid copolymers [19] and by Nishida et al. using esterificated poly(vinyl alcohols) (NaPVS) [20]. In the latter study the position of the PE peak was measured as a function of the concentration and the chemical charge fraction above and below the MO counterion condensation threshold (SAXS experiments).
Beside the classical cp1/2 evolution, the most interesting point was the increase of q*
with the chemical charge fraction f according to the power law
€
q*∝f≈0.3 up to fcrit (Fig. 8).
For higher charge fractions, q* was found to be almost constant. The crossover value fcrit
being close to the theoretical condensation threshold (fthreshold=0.36), this phenomenon was
interpreted as the consequence of the onset of the counterion condensation process leading
7 For higher concentrations small differences are observed [2, 13], q* appears at slighltly lower values
for Scc. This effect is related the form factor of the scattering entities.
8 This assumption is justified in the light of the S
1(q) and S2(q) structure functions presented in Sec.
5.2.
9 This is consistent with the SAXS observations on TMAPSS and NaPSS (Sec. 4.3).
to a charge renormalization. In other words, despite the increase in the chemical charge fraction, both the effective charge fraction and the peak position remain constant.
Another study was performed by Essafi et al. by using poly(acrylamide-co-sodium-2-acrylamido-2-methylpropane sulfonate) (AMAMPS) [21]. In this work, different charge fractions above fthresholdwere investigated (SANS, SAXS experiments). They could evidence
the invariance of q* for highly charged macroions. A close inspection of the macroion partial structure function (Smm, SANS measurements) showed a similar organisation in the
strong-coupling regime. The authors also tried to determine the effective charge through osmotic pressure measurements [22] and showed that is was in striking agreement with MO predictions.
Fig. 8. Variation of q* with the chemical charge fraction f for NaPVA at three different
concentrations in semidilute regime (or close to cp*, SAXS measurements, from Ref. [20]). The lines correspond to a power law
€
q*∝fα with α=0.3.
All these studies highlight an important feature: the position of the PE peak is related to the net charge of polyions and is thus sensitive to the counterion condensation process. Above fthreshold, the chemical charge fraction f has to be replaced by the effective one feff. In
addition to the structural characterization, a careful investigation of the PE peak position also permits the investigation of the counterion condensation phenomenon.
4.4 General structural organization
The PE peak observed in the semidilute regime reflects the polyion-polyion correlations in the solution. If it is clearly related to the electrostatic repulsions, its physical origin in term of structural organization is however difficult to determine.
This maximum could come from an ordered phase in which polyions (or part of them) form a lattice of aligned rigid rods [10]. In this model, q* is related to the d-spacing (q*=2π/d) and its variation with concentration results from a simple dilution law. However,
in flexible PEs solutions, only one peak is visible and no higher-order reflexion is observed. PEs solutions are therefore certainly more disordered systems.
coherent scattering cross section measured in small angle scattering experiments) exhibits a maximum at a position q*=2π/ξ [10, 23, 43, 44, 46, 47]. Other interpretations attribute the PE peak to a liquid-like order between chains segments [44]. Contrary to the correlation hole description, this organization induces a characteristic maximum in the intermolecular structure function S2(q): chain segments have the tendency to stay at a finite distance ξ from each other. The distinction between these two descriptions is difficult to achieve on total structure functions (S(q)) and requires the separation between intra (S1(q)) and intermolecular (S2(q)) structure functions.
The problem is now to understand the relationship between the position q* (or the correlation length ξ) and the physical parameters of the systems. A simple model is therefore needed for the chain conformation and their dispersion state in the solution.
We present in Fig. 9a, a global overview of q* variations as a function of cp for a large
set of hydrophilic flexible PEs found in the literature, in the semidilute regime (considering different polyions, counterions, solvents and linear charge densities, above and below the counterion condensation threshold) [13]. They were measured by SANS, SAXS, and light scattering. If the general variations are still described by a “classical” cp1/2 behaviour, there
is a wide dispersion of the experimental values. The concentration is indeed not the only parameter that governs the organization or the dispersion state of macroions.
In the scaling approach initially developed by de Gennes and Pfeuty for weakly charged PEs [10, 24] and recently revisited by Dobrynin et col. [25], polyions are viewed as an assembly of electrostatic blobs of typical size ξe. Inside each blob, the chain is not
perturbed by the electrostatic interactions and adopts a conformation similar to that of a neutral chain. For larger length scale the electrostatic repulsions dominate and the electrostatic blobs strongly repulse each other and align. In the dilute regime, the average conformation of the macroions can be seen as a linear array of electrostatic blobs and is thus highly stretched. In the semidilute regime, macroions overlap and form a transient network.
(a) (b)
Fig. 9. (a) q* versus cp for different macroions, monovalent counterions, solvents and chemical charge fractions above and below the counterion condensation threshold. (b) q* versus 2π/ξ. From Ref. [13].
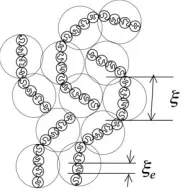
Fig. 10. Schematic representation of a semidilute PE solution according to the scaling approach
within the isotropic model.
The isotropic model [10] postulates that a single characteristic length governs the system: the mesh size of the transient network ξ that also represents the screening length of the electrostatic interactions. For length scales smaller than ξ, the electrostatic interactions are dominant and the average conformation of the macroions remains highly stretched as in the dilute regime. For distances larger than ξ, the electrostatic interactions are screened: the average conformation of the macroions becomes a random walk of correlation blobs of size ξ. A schematic representation of semidilute solution of PE is given in Fig. 10.
By imposing a close packing condition for correlation blobs, scaling arguments allow the determination of the correlation length ξ. In good solvent conditions, it can be written:
€
ξ = f-2/7(lB/b)−1/ 7(bcp)−1/ 2 (12)
From an experimental point of view, the scattering peak position q* provides a direct measurement of ξ (through
€
q*=2π ξ) and gives insights into the structure of the semidilute solutions:
€
q*= 2π ξ = 2πf
2/7(l
B/b)1/ 7(bcp)1/ 2
(13)
The f-dependence of q*, or ξ, is correlated to that of the electrostatic blob size. Eq. (13) perfectly accounts for the experimental observations:
€
q*∝cp1/ 2and
€
q*∝f≈0.3 (2/7=0.285) in the weak-coupling regime.
The scaling model was initially developed for weakly charged PEs, where the net charge fraction is the chemical charge fraction of the macroions. For highly charged PEs, the electrostatic blobs are very small and only concern a very limited number of monomers. However, the model is still assumed to apply provided that the macroions are treated as weakly charged PEs with an effective charge fraction feff. In the strong-coupling limit Eq.
(13) then becomes
€
q*= 2π
ξ = 2πfeff
2/7(l
B/b)1/ 7(bcp)1/ 2 (14)
This theoretical expression can be directly compared with the measurements presented in Fig. 9a. If we plot q* as a function of
€
2
π
/
ξ
(as defined in Eq. (13) or (14)), instead of the concentration cp we observe a master curve (Fig. 9b). The isotropic model associated5 Intra- and intermolecular structure functions
The examples presented in the previous section involve the partial structure functions of the different components. These functions don’t allow to draw direct and accurate conclusions about the average conformation and the intermolecular correlations of macroions. The determination of the intra- and intermolecular structure functions can be achieved through neutron scattering taking advantage of isotopic H/D substitution as described in Sec. 3.2. In the following, we will assume that the contribution of counterions to the scattered intensity is negligible. We present experimental mesasurements and a way to interpret the data. A more detailed presentation of the usual form factors of polymers is given in [26, 27]. 5.1 Form factor
The intramolecular structure function, or form factor, characterizes the average shape of macroions and give insight into their degree of polymerization N, their radius of gyration Rg
and their average conformation. Two q-ranges are usually considered according to qRg
values.
5.1.1 Guinier range
In the Guinier range (qRg<1), the spatial resolution allows to probe distances on the
macromolecular scale (larger than Rg). Measurements are used to determine the degree of
polymerization N and the radius of gyration Rg of the chains10.
The form factor of a particle is a function, which usually decreases monotonically and tends to zero for larger scattering vectors. In the Guinier range, it can be approximated by a series:
€
g1(q)=N 1−q 2R
g2
3 +(q2)
#
$ % %
&
' (
( (15)
For linear macromolecules, we usually prefer Zimm [28] or Berry [29] representations:
€
Zimm : 1 g1(q)
= 1
N 1+ q2R
g2
3 +(q2)
"
# $ $
%
& '
' , Berry : 1g1(q) =
1
N 1+ q2R
g2
6 +(q2)
"
# $ $
%
& ' ' (16)
Plotting
€
1 g1(q) or
€
1 g1(q) as a function of q2 allows the determination of the radius of
gyration (slope), whereas the extrapolation of
g
1(q)
to q=0 gives the degree ofpolymerization N (provided that the measurements are in absolute scale)11. Since we know the molar mass of the monomer unit m, we can deduce the molecular mass of the polyion
M=Nm.
Taking into account polydispersity, we measure the weight average (w) of the form factor
€
g
1(q)
w [27]. Eq. (16) can then be written (Zimm representation)10 The formalism developed in this section only applies to homopolymers. 11 In some cases, the determination R
5 Intra- and intermolecular structure functions
The examples presented in the previous section involve the partial structure functions of the different components. These functions don’t allow to draw direct and accurate conclusions about the average conformation and the intermolecular correlations of macroions. The determination of the intra- and intermolecular structure functions can be achieved through neutron scattering taking advantage of isotopic H/D substitution as described in Sec. 3.2. In the following, we will assume that the contribution of counterions to the scattered intensity is negligible. We present experimental mesasurements and a way to interpret the data. A more detailed presentation of the usual form factors of polymers is given in [26, 27]. 5.1 Form factor
The intramolecular structure function, or form factor, characterizes the average shape of macroions and give insight into their degree of polymerization N, their radius of gyration Rg
and their average conformation. Two q-ranges are usually considered according to qRg
values.
5.1.1 Guinier range
In the Guinier range (qRg<1), the spatial resolution allows to probe distances on the
macromolecular scale (larger than Rg). Measurements are used to determine the degree of
polymerization N and the radius of gyration Rg of the chains10.
The form factor of a particle is a function, which usually decreases monotonically and tends to zero for larger scattering vectors. In the Guinier range, it can be approximated by a series:
€
g1(q)=N 1−q 2R
g2
3 +(q2)
# $ % % & ' (
( (15)
For linear macromolecules, we usually prefer Zimm [28] or Berry [29] representations:
€
Zimm : 1 g1(q)
= 1
N 1+ q2R
g2
3 +(q2)
" # $ $ % & '
' , Berry : 1g1(q) =
1
N 1+ q2R
g2
6 +(q2)
" # $ $ % & ' ' (16)
Plotting
€
1 g1(q) or
€
1 g1(q) as a function of q2 allows the determination of the radius of
gyration (slope), whereas the extrapolation of
g
1(q)
to q=0 gives the degree ofpolymerization N (provided that the measurements are in absolute scale)11. Since we know the molar mass of the monomer unit m, we can deduce the molecular mass of the polyion
M=Nm.
Taking into account polydispersity, we measure the weight average (w) of the form factor
€
g
1(q)
w [27]. Eq. (16) can then be written (Zimm representation)10 The formalism developed in this section only applies to homopolymers. 11 In some cases, the determination R
g and N can be difficult. For relatively long chains, the Guinier range may be shifted to very low q, even out of the accessible values. Furthermore, the low q range may present strong upturns that prevent any accurate Rg or N measurements.
€
1
g1(q) w =N1w 1
+q 2 R
g2 z 3 +(q2)
" # $ $ % & '
' (17)
where Nw is the weight average degree of polymerization, and
€
Rg2 zis the “z average” mean square radius of gyration.
5.1.2 Asymptotic range
In the asymptotic q-range (qRg>1), we probe the internal structure of the polyion. The
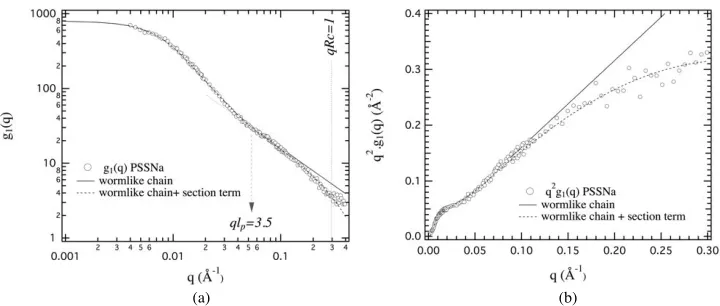
effect of polydispersity is negligible. The data analysis is usually based on a comparison with theoretical models. Measurements performed on poly(styrene sulfonate) (NaPSS) [30] showed that the radius of gyration of the macroions was in between those of a Gaussian chain and a rigid rod, reflecting a global stretching of the macroions due to the electrostatic repulsions. The model usually adopted to describe the average conformation is that of the the wormlike chain (Porod-Kratky model).
The electrostatic repulsions between monomers along the chemical sequence of the macroions lead to an elongated average conformation. The chain conformation (monodisperse infinitely thin thread) is Gaussian at low resolution (large distances, small q values) and gradually evolves to that of rigid rod for typical distances smaller than the persistence length lp (high q values), the usual length characterizing the local stiffness of the
thinthread. The form factor can be expressed as a function of the effective contour length L (or as a function of the apparent monomer size b, using L = Nb) and the persistence length
lp. There is no analytical expression valid over the whole q range for a chain with a finite
length. The global form factor g1(q) can however be obtained by juxtaposing three different
functions f1(q), f2(q) and f3(q) according to the considered qlp domain [27, 31-34].
For
€
qlp ≤2 and when the condition
€
L≥20lp is satisfied (region 1), we can consider the form factor calculated by Sharp and Bloomfield [32]:
€
g1(q)= f1(q)=N 2x2
[
x−1+exp(−x)]
#$
% +2lp
Nb 154 +15x7 − 1115+15x7
# $
% & ' ( exp(−x) )
*
+ ,
- . &
' (
x=Nq2blP 3
(18)
The form factor of an infinite wormlike chain has been calculated by des Cloizeaux [33]. For
€
2≤qlp ≤4 (region 2), we can use the analytic expression12:
€
g1(q)= f2(q)= q21bl
p
(
6+0.5470(qlp)2−0.01569(qlp)3−0.002816(qlp)4
)
(19)For
€
qlp ≥4 (region 3), we can consider the asymptotic form derived by des Cloiseaux [33]:
€
g1(q)= f3(q)= qbπ +23q21bl
P
=πML
mq +23qM2mlL
P (20)
12 Other numerical coefficients associated to slightly different ql
with m, the molar mass of monomers and ML the mass per unit length (ML =Nm/L=m/b).
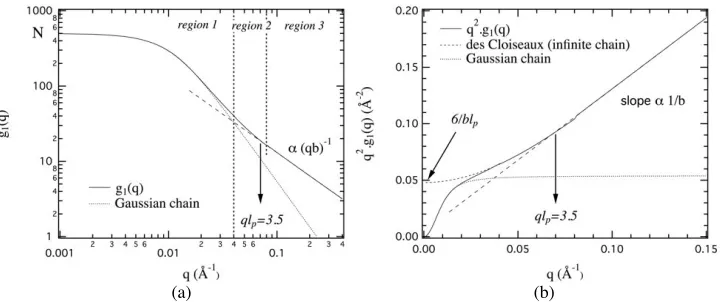
The form factor g1(q) of the wormlike chain model is shown in Fig. 11 using log-log
and Kratky (q2g1(q) versus q) representations.
(a) (b)
Fig. 11. Form factor of a wormlike chain according to Eq. (18), (19) and (20) in logarithmic (a) and
Kratky (b) representations. N=500, b=2.5 Å and lp=50 Å (Rg=136 Å). The three distinct regions associated with f1(q), f2(q) and f3(q) are separated by vertical dashed lines. The long dashed line corresponds to the asymptotic form of des Cloiseaux. The form factor of a Gaussian chain with the same radius of giration is also indicated.
In the high q range (right part of region 3), g1(q) shows a q-1 decay that is characteristic
of rigid rods. In this domain, we probe the molecular structure on a typical length smaller than lp and the chain is expected to be rigid and close to small cylinders. In the Kratky
representation, this corresponds to a straight line with a slope related to the inverse of the monomer size (q2g
1(q)=π/qb), or to the mass per unit length ML .
For
€
qlp≤3.5
,
q2g1(q) deviates from the asymptotic behaviour and initiates a plateau,characteristic of the Gaussian statistics, whose height is 6/blp. For rather short chains, this
plateau is never reached and q2g
1(q) decreases again. The end of the q-1 scattering behaviour
is located at
€
qlp=3.5. Its location can be used to directly evaluate the persistence length.
For the lowest q values, the chain behaves like a Gaussian chain. We enter the Guinier range and g1(q) tends to a plateau. This regime enable the determination of the radius of
gyration (Eq. (16)) while the extrapolation of g1(q) to q=0 gives the degree of
polymerization N (Eq. (15)).
The Gaussian behaviour in region 1 extends beyond the Guinier range (in Fig. 11, the limit of the Guinier range is qGuinier limit=7.10-3 Å-1). The radius of gyration can then be determined by analyzing g1(q) on an extended q range (
€
qRg≤3) with the help of the Debye
function (form factor of a Gaussian chain) [35]:
€
g1(q)=N 2x2
[
x−1+exp(−x)]
x=q2Rg2(21)