ABSTRACT
SLOAN, MARISSA MARIE. A Study of Physical Learning and Virtual Learning in
Technology, Engineering, and Design Education. (Under the direction of T. Branoff and V.W. DeLuca.)
The purpose of this research study was to determine if physical learning or virtual learning was more effective for Technology, Engineering, and Design Education students in the post-‐secondary level. A pretest -‐ posttest research design was used to measure the amount of knowledge gained within both settings.
A sample of 44 undergraduate students enrolled in introductory Technology, Engineering, and Design courses at North Carolina State University during the 2013 spring semester was selected. Twenty-‐one students completed a structures activity that including reading, quizzes, and modeling a bridge virtually using a software program called Whitebox learning. Twenty-‐three students completed the same structures activity physically using balsa wood to model their bridges. Both groups were given a pretest and a posttest to measure knowledge gained throughout the study. The data implied there was a significant relationship between pretest and
A Study of Physical Learning and Virtual Learning in Technology, Engineering, and Design Education
by
Marissa Marie Sloan
A thesis submitted to the Graduate Faculty of North Carolina State University
in partial fulfillment of the requirements for the degree of
Master of Science
Technology Education
Raleigh, North Carolina 2013
APPROVED BY:
________________________________________ ________________________________________ V. William DeLuca Aaron C. Clark
___________________________________________ Theodore J. Branoff
BIOGRAPHY
Marissa Marie Sloan was born in San Jose, California on October 5, 1988. She graduated from Leesville Road High School in 2006 and completed a Bachelor of Science in Technology, Engineering, and Design Education from North Carolina State University in 2010.
ACKNOWLEDGEMENTS
Many people have contributed to my success through graduate school. I would like to give special thanks to the following people:
• My fiancé, Patrick, for always being there to support me through the long nights of studying and researching. I appreciate the love and encouragement he has given me throughout the process.
•My mother and father, Mary and Larry, and the rest of my family. I am so thankful for their support during my graduate work. Their encouraging words and
confidence in me that have helped me get to where I am today.
TABLE OF CONTENTS
LIST OF TABLES... vii
LIST OF FIGURES ... viii
CHAPTER 1: INTRODUCTION ...1
Purpose of the Study ...2
Research Questions and Hypotheses...3
Assumptions...3
Limitations ...4
Definition of Key Terms ...5
Summary ...6
CHAPTER 2: REVIEW OF LITERATURE ...8
Introduction...8
Technology, Engineering, and Design Education and Engineering Design Activities...8
Physical Learning ... 11
Virtual Learning... 13
Constructivism – An Educational Learning Theory ... 16
Summary ... 18
CHAPTER 3: METHODOLOGY... 20
Introduction... 20
Null Hypotheses ... 21
Research Design ... 22
Target Population ... 24
Sample... 24
Instrumentation ... 24
Procedure ... 26
Analysis of Data... 28
Dependent Variables... 29
Independent Variables... 30
Control Variables... 30
Variables ... 30
Summary ... 31
CHAPTER 4: RESULTS... 32
Introduction... 32
Description of the Participants... 33
Analysis of Scores within Treatment Groups... 36
Analysis of Scores between Treatment Groups ... 39
Summary ... 42
CHAPTER 5: DISCUSSION... 44
Introduction... 44
Summary of Findings ... 44
Research Questions and Summary of the Findings... 46
Recommendations for Further Research... 52
REFERENCES... 55
APPENDICES ... 58
APPENDIX A: INFORMED CONSENT FORM ... 59
APPENDIX B: STRUCTURES PROJECT DESIGN SHEET... 61
APPENDIX C: PRETEST... 62
LIST OF TABLES
Table 3.1 Research Design………23
Table 3.2 Statistical Analyses Listed by Hypothesis………31
Table 4.1 Gender Demographics of the Participants………..…33
Table 4.2 Classification Demographics of the Participants……….……34
Table 4.3 Major Demographics of the Participants……….……….……35
Table 4.4 Participant Enrollment of Involved Courses……….………..…35
Table 4.5 Treatment Groups……….………..…36
Table 4.6 Scores for Pretest and Posttest by Treatment Group………37
Table 4.7 Wilcoxon Signed Rank Test Results for Virtual Learning Group………...…38
Table 4.8 Wilcoxon Signed Rank Test Results for Physical Learning Group………….38
Table 4.9 Mann Whitney Results for Gain Scores – Ranks……….40
Table 4.10 Mann Whitney Results for Gain Scores – Test Statistics………40
Table 4.11 Mann Whitney Results for Differences between Posttest Scores – Ranks………...41
Table 4.12 Mann Whitney Results for Differences between Posttest Scores – Test Statistics……….………41
LIST OF FIGURES
CHAPTER 1: INTRODUCTION
The pros and cons of physical learning and virtual learning has been the interest of many people in the field of education. Learning treatments and learning types are constantly being looked at and changed to better suit the needs of students. Most recently, virtual learning has seemed to start to take over the field of education and the learning treatments within it. Administrators, teachers, and students are all being trained to think in a technologically advanced manner. Student’s assignments are changing from paper and pencil, to computers and cloud space. Although, many studies have been done on both physical and virtual learning separately, research looking at both comparatively is very scarce. Little is known about the effectiveness of virtual learning environments compared to traditional classroom education in the context of Technology, Engineering, and Design Education (Piccoli, Ahmad, & Ives, 2001).
It is believed students are able to combine intellectual stimulation through hands-‐on learning with activities that expand learning (Cardon, 2000). This applies to the past, industrial arts, and the present, Technology, Engineering, and Design
learn from an experience allows for a more rich understanding of the content being examined (Fox-‐Turnbull & Snape, 2011).
Virtual learning allows students to participate in a non-‐traditional form of hands-‐on education through the use of computers, extending hands-‐on learning to minds-‐on skills (Haury & Rillero, 1995). Computer-‐aided three-‐dimensional design is a technological equivalent to traditional hands-‐on methodology (Smith, 2003). Three dimensional computer aided design is able to teach students advanced mathematics and physics concepts, through different software and programs available. Virtual learning
environments allow interaction and different encounters with the participant in order to provide a wide range of learning capabilities (Piccoli, Ahmad, & Ives, 2001). Students are able to use these programs to experiment with different scenarios, problem solving, and decision making with little risk and without wasting resources. Virtual learning is often popular due to convenience and flexibility factors, however, its effectiveness remain an open question (Chou & Liu, 2005).
Purpose of the Study
The purpose of this study is to determine if students comprehend more by completing a physical learning task or a virtual learning task. Students will be examined in both learning settings to determine if a learning difference is present or not.
Research Questions and Hypotheses
Research Question: Is there a significant difference between virtual learning and physical learning in the classroom for Technology, Engineering, and Design Education students? The research hypotheses related to the research question are as follows:
H01: There will be no significant difference in the knowledge gain scores between the virtual learning group and the physical learning group, at the p=0.05 level.
H02: There will be no significant difference between the post-‐test scores
between the virtual learning group and the physical learning group, at the p=0.05 level. H03: There will be a significant difference between the pretest and post-‐test scores for the virtual learning group, at the p=0.05 level.
H04: There will be a significant difference between the pretest and post-‐test scores for the physical learning group, at the p=0.05 level.
Assumptions
The following assumptions were made for the study:
1. With the population of interest being late adolescence and early adulthood, it is assumed the students in the Technology through Engineering and Design 1 and the students in the Materials and Processes Technology classes will fall into this category.
3. Since the sample will be taken from introductory courses, it is assumed all of the students will have relatively no experience with structures or bridges.
4. It will be assumed the conditions for completing the study will be consistent for all individuals involved.
5. It will be assumed each student completing the pre-‐assessment and post assessment will complete it to the best of his/her ability.
Limitations
1. With the study being completed over a multi-‐week period, it is possible the conditions when completing the project for some students may not be the same for others.
2. It is possible some students may not complete the required assessments to the best of their abilities.
3. Since the study will be done in a Technology through Engineering and Design 1 class and two sections of Materials and Processes Technology classes, the sample is limited in size and participants.
4. A percentage of the students may have background knowledge on the topic of structures before the study.
Definition of Key Terms
The purpose of this section is to provide various background information and/or definitions used in this study.
Learning Treatments - The different tactics of how individuals can learn and
process information: by seeing and hearing, reflecting and acting, reasoning logically and intuitively, or analyzing and visualizing (Felder, 2012).
Physical Learning (hands-on learning) - A traditional way of teaching, in which
the students are physically working with materials and tools to build a representation or final product. The students are learning by doing (Haury & Rillero, 1995).
Post-test/assessment – A test administered after completion of an instructional
period, in conjunction with a pretest, to measure knowledge gained and achievement. Pre-test/assessment – A test administered to determine a baseline of knowledge
for educational purposes.
Structures - A body or combination of bodies that has been constructed or built
of many parts and held or put together in a particular way (International Technology Education Association, 2002).
Technology – Human innovation in action that involves knowledge ands
Technology Education - A study of technology. Provides an opportunity for
students to learn about the processes and knowledge related to technologies that are needed to solve problems and extend human capabilities (International Technology Education Association, 2002).
Three-Dimensional - To be able to give the illusion of depth or varying distances,
when using an image or pictorial representation on a two-‐dimensional plane. A model can take many forms, including graphic, mathematical, and physical (International Technology Education Association, 2002).
Virtual Learning - A new teaching method allowing learners to perceive the
environment, assess situations and performance, perform actions and process through experiences and lessons using various software on the computer (Pimentel, 1999).
Summary
CHAPTER 2: REVIEW OF LITERATURE
Introduction
This chapter begins with an examination into engineering design activities within Technology, Engineering, and Design Education. Engineering design activities are constantly used and incorporated within technology education courses. This research looks into the reasoning behind these projects and the benefits they can provide. Next, research looking into both physical learning and virtual learning is examined. Both of these fields of learning have had numerous studies conducted to look into what constitutes each type of learning. The background, negative effects, benefits, and implementations are discussed from through a review of research literature. Lastly, a review of the constructivist learning theory is looked at in its regards to technology education.
Technology, Engineering, and Design Education and Engineering Design Activities
stems from an alignment and closer relationship with the engineering community (Dearing & Daugherty, 2004). Both engineering and engineering design are included in the Standards for Technological Literacy (International Technology Education
Association, 2002). A student’s task understanding is related to their planning and cognitive strategies within an engineering design activity (Lawanto, 2011).
Mentzer (2011) states, “Technology Education has a successful track record in providing hands on experiences, but may strengthen its ties to an integrative STEM education approach by leveraging natural connections that exist” (p. 131). By aligning engineering design activities, such as building model bridges or rockets, it allows “students to understand the impacts of engineering development and become literate about the technological world around them” (Dearing & Daugherty, 2004, p. 8). Technological literacy is a vital educational goal, and the ability to make meaningful decisions in relation to society and technology is essential. By utilizing tools specific to engineering in conjunction with technology education’s experiential approach helps to expand and facilitate a student’s technological literacy (Mentzer, 2011). Just to be able to understand the problem is an important step and design activity for students
problems by using an active, hands-‐on methodology through practical application (Mentzer, 2011). Not only do successful engineering and classroom projects help students to understand real-‐world applications, but also do natural catastrophes or engineering failures. Educators embrace studies of engineering failures as a means for a pedagogical strategy that teaches students’ different learning standards and how to design within realistic constraints (Rose & Hunt, 2012).
Technology, Engineering, and Design Education involves the process of
creativity. In order, to develop creative thinking it is vital to practice activities that help to promote design and innovation. The development of design and technology curricula is premised on the importance of designing and the worth of the contingent action of creative thinking (Middleton, 2005). Technology, Engineering, and Design Education is an avenue for developing general problem solving skills, modeling and prototyping skills, creative thinking, and analytical reasoning (Dearing & Daugherty, 2004).
Physical Learning
Physical or hands-‐on learning has always been a large component of Technology, Engineering, and Design Education. Historically, Technology, Engineering, and Design Education has been the window through which students are able to apply their
model catapult. An experiential approach allows and requires the participants to become active learners instead of passive learners through lectures (Haury & Rillero, 1995).
Virtual Learning
Virtual learning is a new component in Technology, Engineering, and Design Education with a number of advantages in terms of convenience and flexibility, however, the effectiveness has yet to be determined (Piccoli, Ahmad & Ives, 2001). Online technology has a gripping impact on teaching and learning (Chou & Liu, 2005). Virtual learning allows students to participate in a non-‐traditional form of hands-‐on education through the use of computers, extending hands-‐on learning to minds-‐on skills (Haury & Rillero, 1995). Piccoli, Ahmad & Ives (2001) state, “Internet technologies are having a significant impact on the learning industry” (p. 401). Virtual learning allows interactions and the sharing of knowledge with other participants and provides a broad range of resources. The open system of virtual learning allows participant interaction through synchronous and asynchronous communication. As a result, students have a larger chance to express and articulate their knowledge and understanding (Chou & Liu, 2005).
capabilities. Computer-‐aided three-‐dimensional design is a technological equivalent to traditional hands-‐on methodology. Three dimensional computer aided design is able to teach students advanced mathematics and physics concepts, through different software and programs available. Simple machines, mechanical advantage, related mathematics, and problem solving are all examples of integration of mathematics and sciences in technology virtual learning software (Smith, 2003). By using three-‐dimensional computer-‐aided design software students are able to use the computer to make a representation of any physical object. Along with three-‐dimensional software programs, computers use simulation software in conjunction. Simulations allow students to see how various functions are interrelated and help contribute to success (Lamoureux, 2009). Virtual learning environments allow interaction and different encounters with the participant in order to provide a wide range of learning capabilities (Piccoli, Ahmad, & Ives, 2001). Students are able to use these programs to experiment with different scenarios, problem solving, and decision making with little risk and without wasting resources.
(Chou & Liu, 2005). Additionally, virtual learning is efficient, technology-‐based training takes much less time to complete relative classroom instruction (Deal, 2002). Along with all of its benefits, virtual learning environments also include drawbacks. Much of literature involving technology highlights both the potential value and the setbacks of feelings of isolation, frustration, anxiety, and confusion (Piccoli, Ahmad, & Ives, 2001). Lack of interest or reduced interest in the subject or learning effectiveness can also be a setback with virtual learning (Chou & Liu, 2005). Factors of the effect of virtual
learning mainly deal with technology itself. The quality and reliability of technology, along with the easy access to appropriate hardware and software equipment, are important determinants of learning effectiveness. Hardware and software
compatibility, along with connectivity and technology skills, are common problems when it comes to virtual learning success (Deal, 2002).
Virtual learning helps to promote self-‐efficacy. Implications show that higher learner control allows students to feel proud they have the capability to use learning tools and learn independently, in turn leading to higher self-‐efficacy (Chou & Liu, 2005). Virtual learning is able to provide a way to merge the best features of real-‐world
information navigation. Online navigation paired with the memory of places or visual cues permit quick searches, sorting, and swift cross-‐referencing (Bouras, Philopoulos & Tsiatsos, 2001).
Constructivism – An Educational Learning Theory
knowledge through communication and interaction with others in the sociocultural surroundings (Fox-‐Turnbull, 2010). This relates and holds true when being applied to technology and technology education since “technological knowledge is socially
constructed because the social and cultural values of particular groups of people
influence the technological advances made at any one time” (Fox-‐Turnbull, 2010, p. 25). Meaning is assigned to what is learned by the student from the experiences that
surround the learning; as a result, the process of solving real-‐world problems is much better and more deeply understood (Jonassen, et al., 1995). Based on the constructivist principles, practical activity successfully leads to the growth of students and teachers understanding of technological practice and technology education. Students are able to gather a rich understanding of theory linked to technological practice and other
relevant links to learning within the classroom (Fox-‐Turnbull & Snape, 2011). The interaction between teachers and learners and peers is vital for the development of superiority technology in schools according to the practical nature and constructivist foundation of technology education (Fox-‐Turnbull, 2010). Constructivist educators strive to create active learning environments, where learning is participating and interacting rather than listening and mirroring (Jonassen, et al., 1995).
autonomous way of thinking and reasoning (Fox-‐Turnbull, 2010). Instructors serve as guides for students because in constructivism there is no absolute determination, there is always more than one solution to a problem and depending on the different
perspectives used to approach it, it can have different solutions (Boudourides, 2003). Educators and instructors use a collaborative approach, instead of a dictating
approaching to teaching. This collaborative approach helps students to take ownership of their learning and technological outcomes, which in turn, situates a quality
technology education program (Fox-‐Turnbull, 2010). The principles of constructivists provide principles that help to guide designers and teachers to create learner-‐centered, collaborative environments that support experiential and reflective processes
(Jonassen, et al., 1995). Learners do not just take in information that is fed to them to store, but make interpretations of experiences and use those to elaborate and test those interpretations (Perkins, 1992). Students are able to make connections and
demonstrate a high level of engagement to real and authentic needs, issues, and technological practices within society through activity and reflection in the classroom (Fox-‐Turnbull & Snape, 2011).
Summary
This literature review covers engineering design activities through Technology, Engineering, and Design Education, physical learning, virtual learning, and the
CHAPTER 3: METHODOLOGY
Introduction
It is believed students will gain a deeper understanding of content when actively participating within a hands-‐on physical activity. However, it is also believed students will take more pride, self-‐efficacy, and responsibility when moving at a self-‐motivated pace when completing virtual activities. The review of literature led to believe there could be components of both physical and virtual learning that has not been examined yet. One component included the comparison between the two learning treatments, physical and virtual, with respect to which is more effective for Technology,
Engineering, and Design Education students.
Purpose of the Study
The purpose of this study is to determine if students comprehend more by completing a physical learning task or a virtual learning task. Students will be examined in both learning settings to determine if a learning difference is present or not.
Research Questions and Hypotheses
Is there a significant difference between virtual learning and physical learning in the classroom for Technology, Engineering, and Design Education students is the main research question involved with the study?
The research hypotheses relating to the research question; which will guide the sample selection, testing instrumentation, data collected, and the analysis of the data; are as follows:
H01: There will be no significant difference in the knowledge gain scores between the virtual learning group and the physical learning group, at the p=0.05 level.
H02: There will be no significant difference between the post-‐test scores
between the virtual learning group and the physical learning group, at the p=0.05 level. H03: There will be a significant difference between the pretest and post-‐test scores for the virtual learning group, at the p=0.05 level.
H04: There will be a significant difference between the pretest and post-‐test scores for the physical learning group, at the p=0.05 level.
Null Hypotheses
Null Hypothesis #2. There will be no significant difference between the scores on
the posttest for the virtual learning group and the scores on the posttest for the physical learning group. A non-‐parametric Mann Whitney statistical test will be used to
determine if differences exist between the variables vscore2 for the virtual learning group and pscore2 for the physical learning group.
Null Hypothesis #3. For the virtual learning group, there will be no significant
difference between the scores on the posttest and the pretest. A non-‐parametric Wilcoxon Signed Rank statistical test will be used to determine if differences exist between the variables vscore1 and vscore2 for the virtual learning group.
Null Hypothesis #4. For the physical learning group, there will be no significant difference between the scores on the posttest and the pretest. A non-‐parametric Wilcoxon Signed Rank statistical test will be used to determine if differences exist between the variables pscore1 and pscore2 for the physical learning group.
Research Design
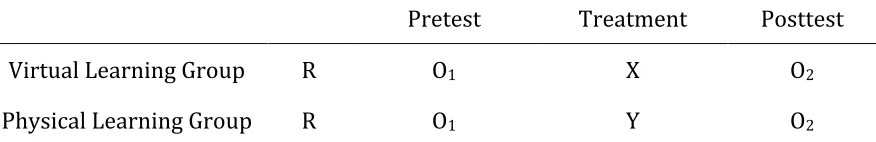
The research design for this particular study will follow a pretest-‐posttest design (see Table 3.1). The study is comparing two different participant groups by methods of learning, while trying to control the extraneous variables. The purpose of selecting this design is to show how the study will measure the degree of change occurring as a result of the two groups, physical learning and virtual learning. The particular pretest
this design is relatively simple; subjects are assigned a group depending upon their enrollment within an introductory Technology, Engineering, and Design Education course, a physical learning and a virtual learning group (Shuttleworth, 2009). Both groups are administered the pre and post-‐test, with the ultimate difference being one group is in an alternative environment, this allows a number of distinct analyses. The study is not trying to explain a relationship between the two types of learning, but trying to distinguish which learning type allows the students to learn the best and most efficiently.
Table 3.1. Research Design
Pretest Treatment Posttest
Virtual Learning Group R O1 X O2
Physical Learning Group R O1 Y O2
R: Assignment of the subject to either the physical learning group or the virtual learning group by enrollment status
O1: A test on the knowledge of the components and elements on structures.
O2: An equivalent form of the test on the knowledge of the components and elements on structures.
X: Students will be using Whitebox Learning to create a virtual model of their structure. Y: Students will be in the traditional setting of building a physical structure.
Target Population
The intent of the study is to examine which form of learning is the most efficient and effective within a college course. The target population for this study will be individuals in late adolescence and early adulthood enrolled in a post-‐secondary institution. This population is of interest to teachers in the Technology, Engineering, and Design Education courses at the post-‐secondary level.
Sample
A convenience sample of undergraduate students enrolled in introductory Technology, Engineering, and Design Education courses at North Carolina State University during the 2013 Spring semester was selected and used. The class rolls of TDE 131 -‐ Technology through Engineering and Design 1 and two sections of TDE 110 – Materials and Processes Technology were used as the sampling frame. The complete population of all three courses was used for the study.
Instrumentation
Design Education course, and each completed the project within their own type of environment, either physical or virtual. After completing the project within their environments, all the students then completed a post-‐test to measure the amount of knowledge and comprehension about the subject gained in the separate environments. The post and pre-‐tests were compared, then grouped and compared to look at each group and the different environments collectively.
reliability using the Kuder-‐Richardson Formula 20 (KR-‐20) test. The KR-‐20 values for the pretest and posttest were 0.827 and 0.699, respectively.
Procedure
To begin, the subjects within the study were the students of the undergraduate Technology, Engineering, and Design Education courses TDE 110-‐001, TDE 110-‐002, and TDE 131 at North Carolina State University. The students were both female and male who were 18 years or older. They had some background knowledge in
Technology, Engineering, and Design Education, but were not masters of the subject or the activity planned. The three classes were broken up into two groups, a physical learning group and a virtual learning group which were the independent variables, to create as even as a sample as possible. The course TDE110-‐001 (13 students) and TDE131 (8 students) were both assigned to the virtual learning group to create one group with a total of 21 students, and TDE110-‐002 (23 students) was the physical learning group with a total of 23 students. To avoid cross contamination of the groups within the study, each class as a whole was assigned to a specific grouping. The
All students involved signed an informed consent form (see Appendix A) and were aware of the study being conducted.
The students were given a structures design project sheet (see Appendix B) to outline the contents of what was going to be asked of them and inform the students of the time limitations for each step of the process. Both groups in the class took a pre-‐test of the information that was going to be learned through the project to check each
students beginning knowledge. The pre-‐test was a 30 minute timed test that showed previous knowledge carried over into the project by the students, such as mathematics formulas and physical attributes; it also acted as a section of the dependent variable and measurement instrument. The students were given a project on structures; the
physical learning group was given readings and informal quizzes on paper, and supplies to build a model bridge. Whereas, the virtual learning group completed readings,
informal quizzes, and a virtual model online through software called Whitebox Learning. The virtual learning group completed their online modeling in a classroom equipped with computers, while the physical learning group completed their physical modeling in an attached separate laboratory. Participants were given 1.5 hours to complete the readings and quizzes and 2 hours to plan and complete the modeling, regardless of the group to which they were assigned.
differences from the pre-‐test to the post-‐test. Once the results were recorded, an analysis was completed on the differences between the knowledge gained and comprehension for the subject for each of the two groups. The data was turned into quantitative data in order to carry out the statistical tests to look at the spreads and significance tests. The statistical tests used for this study were non-‐parametric tests, consisting of the Wilcoxon Signed Rank test and the Mann Whitney test.
Figure 3.1 shows the procedure in a quick list format. The courses and number of participants per group is listed, as well as each step of the study is named, along with the amount of time tied to each activity.
• TDE 110-‐001 and TDE 131 = Virtual Learning Group (21 students) •TDE 110-‐002 = Physical Learning Group (23 students)
o 1. Consent Form Signed
o 2. Structures Design Sheet
Outline of process and assignment
o 3. Pretest – 30 minutes
o 4. Given assignment in respective groups – 1.5 hours Readings and informal quizzes
o 5. Given project in respective groups – 2 hours Designing and modeling a bridge structure
o Posttest – 30 minutes
Figure 3.1 Procedure – Quick View
Analysis of Data
conducted. The data was analyzed using the SPSS statistical analysis program to run the Mann Whitney test in order to analyze the pretest and posttest scores within the groups. Additionally, the data was analyzed using the JMP statistical analysis program to run the Wilcoxon Signed Rank test in order to analyze the pretest and posttest scores between the two groups. The study aimed to provide reliable, consistent, and accurate statistical analyses.
Dependent Variables
The dependent variables of the study are the gain scores in each learning
environment of the post-‐test and the pre-‐tests, which were given to the students. Four dependent variables were examined: the difference between vscore1 (score of the virtual learning group for the pretest) and pscore1 (score of the physical learning group for the pretest) – diff1, the difference between vscore2 (score of the virtual learning group for the posttest) and pscore2 (score of the virtual learning group for the posttest) – diff2, the difference between vscore2 and vscore1 – vgain, and the
difference between pscore2 and pscore1 – pgain. All participants received the same treatment when vscore1 and pscore1 were collected. For vscore2 and pscore2, although the test group and control group received different treatments throughout the project, all the participants received the same treatment when these values were
Independent Variables
Within the study, the independent variables were the two different learning environments, physical learning and virtual learning. The purpose of the study was to examine which learning environment creates a more effective and efficient version of learning.
Control Variables
The control variables within the study are the students and the class in which the study is given, TDE 110-‐001, TDE 110-‐002, and TDE 131.
Variables
group – 1-‐virtual learning group, 2-‐physcial learning group vscore1 – Score of the virtual learning group for the pretest pscore1 – Score of the physical learning group for the pretest diff1 – Difference between vscore1 and pscore1
vscore2 – Score of the virtual learning group for the posttest pscore2 – Score of the physical learning group for the posttest diff2 – Difference between vscore2 and pscore2
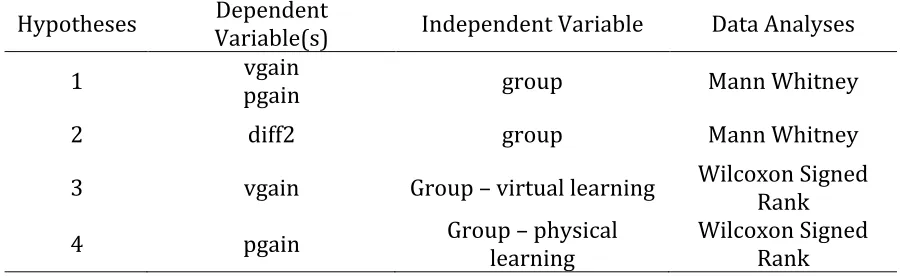
The analyses used to test each research hypothesis are listed in Table 3.2.
Table 3.2. Statistical Analyses Listed by Hypothesis
Hypotheses Variable(s) Dependent Independent Variable Data Analyses
1 vgain pgain group Mann Whitney
2 diff2 group Mann Whitney
3 vgain Group – virtual learning Wilcoxon Signed Rank 4 pgain Group – physical learning Wilcoxon Signed Rank
Summary
This chapter has described the method and research design used to execute the purpose of the study and test the research hypotheses. The study used a pretest-‐ posttest design. The test instruments used were a structural pre-‐assessment and an equivalent form as a structural post-‐assessment. The target population was individuals in late adolescence and early adulthood. The sample was of undergraduate students enrolled in introductory Technology, Engineering, and Design Education courses during the spring semester of 2013 at North Carolina State University. Two statistical analysis programs, SPSS and JMP, were used to analyze the data. Each section discussed
CHAPTER 4: RESULTS
Introduction
The purpose of this study was to explore the comparison of physical learning versus virtual learning in Technology, Engineering, and Design Education at the post-‐ secondary level. The results from all students enrolled in introductory classes TDE110-‐ 001, TDE110-‐002, and TDE131 (n=44) were investigated, in regards to which learning group was most efficient and effective. This chapter presents the data relevant to physical learning and virtual learning within Technology, Engineering, and Design Education introductory courses.
The target population for this study consisted of 44 students currently enrolled in introductory Technology, Engineering, and Design Education courses, TDE110-‐001, TDE110-‐002, and TDE131. Participants were acquired and informed through each of these courses, at which they then signed an informed consent letter. Usable responses were collected from the full population of 44 students who responded and participated within the learning activities and assessments (response rate 100%).
covered a wide range about structures and the calculations behind how to correct build a structural sound bridge. Research hypotheses 3 and 4 are tested and the results are reported to whether the findings were statistically significant. The third section in this chapter exhibits data related to scores on the pretest and posttest compared between treatment groups. Research hypotheses 1 and 2 are tested and the results are reported to whether the findings were statistically significant. The chapter concludes with an overall summary of the findings.
Description of the Participants
Table 4.1 displays data on the participants in the study by gender.
Table 4.1. Gender Demographics of the Participants (N=44)
Gender No. of participants Percentage
Male 34 77.0
Female 10 23.0
Total 44 100
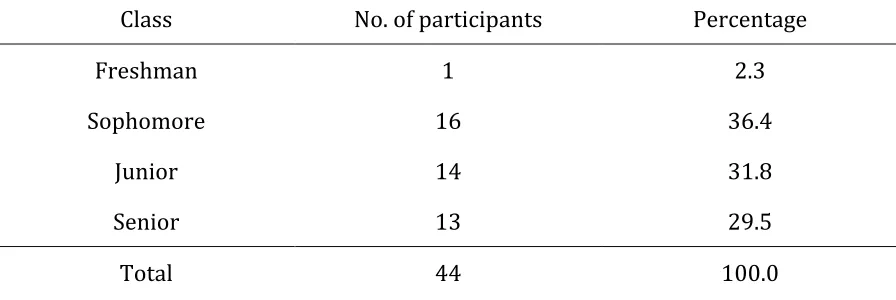
Table 4.2 displays the classification demographics of the participants within the study.
Table 4.2. Classification Demographics of the Participants (N=44)
Class No. of participants Percentage
Freshman 1 2.3
Sophomore 16 36.4
Junior 14 31.8
Senior 13 29.5
Total 44 100.0
Within the sample (N=44), the spread of classification through school ranking all participants except for one outlier were classified as a sophomore, junior, or senior. This could be due to the fact that is an introductory course and showing up early in their curricular display for sophomores (36.4%), and perhaps major changes for juniors (31.8%) or seniors (29.5%).
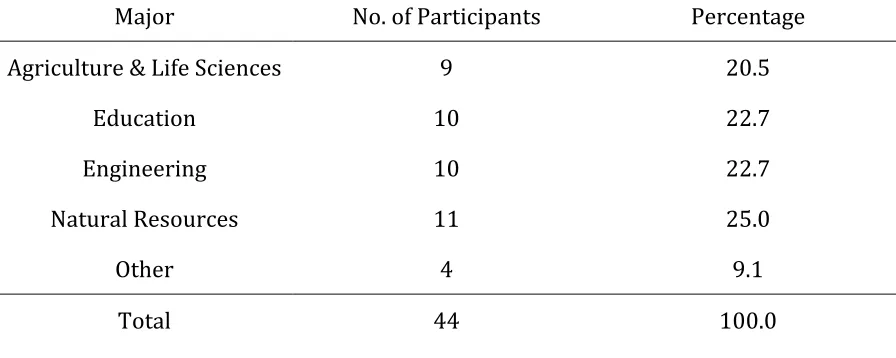
Table 4.3 displays the major demographics of the participants within the study.
Table 4.3. Major demographics of the participants (N=44)
Major No. of Participants Percentage
Agriculture & Life Sciences 9 20.5
Education 10 22.7
Engineering 10 22.7
Natural Resources 11 25.0
Other 4 9.1
Total 44 100.0
When considering the major each participant was currently enrolled in,
participants were almost evenly spread across the board for Agriculture & Life Sciences (20.5%), Education (22.7%), Engineering (22.7%), and Natural Resources (25.0%). These colleges most likely require students in the different curricula to take the involved introductory courses.
Table 4.4 displays the breakdown of participant enrollment in the two courses.
Table 4.4. Participant Enrollment of Involved Courses (N=44)
Course No. of Participants Percentage
TDE110 – Materials & Processes Technology 36 81.8 TDE131 – Technology Through Engineering &
Design 1 8 18.2
Total 44 100.0
The study involved two different Technology, Engineering, and Design Education introductory courses. The class rolls of two sections of TDE 110 – Materials and
Processes Technology (81.8%) and TDE 131 -‐ Technology through Engineering and Design 1 (18.2%) were used as the sampling frame.
Table 4.5 shows the breakdown of participants for each treatment group.
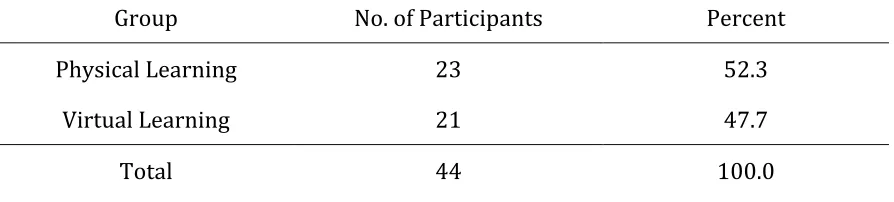
Table 4.5. Treatment Groups (N=44)
Group No. of Participants Percent
Physical Learning 23 52.3
Virtual Learning 21 47.7
Total 44 100.0
Students were assigned to two treatment groups, physical learning or virtual learning. Courses TDE 131-‐001 and TDE110-‐001 were assigned virtual learning, while course TDE110-‐002 was assigned to physical learning. Twenty-‐one students (47.7%) were assigned to the virtual learning group and twenty-‐three students (52.3%) were assigned to the physical learning group.
Analysis of Scores within Treatment Groups
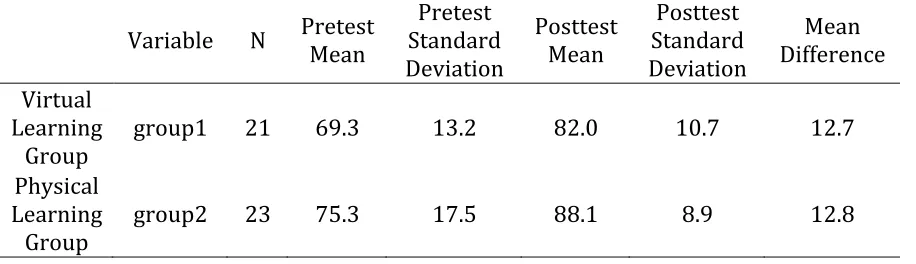
Table 4.6. Scores for Pretest and Posttest by Treatment Group
Variable N Pretest Mean Standard Pretest Deviation
Posttest Mean
Posttest Standard Deviation
Mean Difference Virtual
Learning
Group group1 21 69.3 13.2 82.0 10.7 12.7
Physical Learning
Group group2 23 75.3 17.5 88.1 8.9 12.8
The data was analyzed using the JMP statistical analysis program. The table shows the variable vscore1 = 69.3, vscore2 = 82.0, pscore1 = 75.3, and pscore2=88.1. The mean difference is discussed as variables, vgain (12.7) and pgain (12.8).
Table 4.6 shows that the virtual learning group started with a mean score of 69.3 and ended with a mean score of 82.0, this was a mean difference of 12.7 points.
Meanwhile, the physical learning group started with a mean score of 75.3 and ended with a mean score of 88.1, this was a mean difference of 12.8 points. Even though the physical learning group had a higher mean for both the pretest and the posttest scores, the gain or mean difference within both groups was about equal.
Table 4.7. Wilcoxon Signed Rank Test Results for Virtual Learning Group (group1)
Posttest -‐ Pretest
Test Statistic S 109.500
Prob>|S| <.0001*
Prob>S <.0001*
Prob<S 1.0000
*Significant at α = 0.05.
Table 4.8. Wilcoxon Signed Rank Test Results for Physical Learning Group (group2)
Posttest -‐ Pretest
Test Statistic S 123.000
Prob>|S| <.0001*
Prob>S <.0001*
Prob<S 1.0000
*Significant at α = 0.05.
The p-‐value for both the virtual learning group (group1) and the physical
learning group (group2) is p=0.0001, meaning it is significant. This shows that for both groups the amount of knowledge content learned between the time of the pretest and the time of the posttest, vgain and pgain, was significant.
Wilcoxon Signed Rank statistical test was used to determine if differences existed between the variables vscore1 and vscore2 for the virtual learning group. The analysis indicated a significant difference for the variable vgain, the difference between vscore2 and vscore1 at α = 0.05. The findings support Research Hypothesis 03.
Null Hypothesis #4. For the physical learning group, there will be no significant difference between the scores on the posttest and the pretest. A non-‐parametric Wilcoxon Signed Rank statistical test was used to determine if differences existed between the variables pscore1 and pscore2 for the physical learning group. The analysis indicated a significant difference for the variable pgain, the difference between pscore2 and pscore1 at α = 0.05. The findings support Research Hypothesis 04.
Analysis of Scores between Treatment Groups
Table 4.9 and table 4.10 display the results for the Mann Whitney statistical test for the gain scores, vgain and pgain. The data was analyzed using the SPSS statistical analysis program. This test is a non-‐parametric statistical test of the null hypothesis. It is used when two populations are the same against an alternative hypothesis; it is used across two groups of data, such as the virtual learning group and the physical learning group within this study.
Table 4.9. Mann Whitney Results for Gain Scores – Ranks
Group N Mean Rank Sum of Ranks
Virtual Learning Group 21 23.52 494.00
Physical Learning Group 23 21.57 496.00
Total 44
Table 4.10. Mann Whitney Results for Gain Scores – Test Statistics
Gain
Mann Whitney 220.00
Wilcoxon W 496.00
Z -‐0.507
Asymp. Sig. (2-‐tailed) 0.612
The p-‐value for the gain scores across the virtual learning group and the physical learning group is p=0.612, meaning it is not significant. This shows the difference in the gain scores across the virtual learning and physical learning groups was not significant.
The analysis indicated there was not a significant difference for the differences between the variables vgain and pgain at α = 0.05. The findings support Research Hypothesis 01.
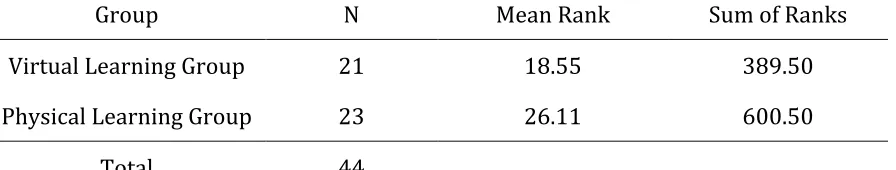
Table 4.11 and table 4.12 display the results for the Mann Whitney statistical test for variable diff2, the difference in the posttest scores of the virtual learning group (vscore2) and the physical learning group (pscore2). The data was analyzed using the SPSS statistical analysis program.
Table 4.11. Mann Whitney Results for Differences between Posttest Scores – Ranks
Group N Mean Rank Sum of Ranks
Virtual Learning Group 21 18.55 389.50
Physical Learning Group 23 26.11 600.50
Total 44
Table 4.12. Mann Whitney Results for Differences between Posttest Scores – Test Statistics
Posttest
Mann Whitney 158.50
Wilcoxon W 389.50
Z -‐1.963
Asymp. Sig. (2-‐tailed) 0.05
The p-‐value for the difference in the posttest scores across the virtual learning group and the physical learning group is p=0.05, meaning it is significant. This shows the difference in the posttest scores across the virtual learning and physical learning groups was significant.
Null Hypothesis #2. There will be no significant difference between the scores on the posttest for the virtual learning group and the scores on the posttest for the physical learning group. A non-‐parametric Mann Whitney statistical test will be used to determine if differences exist between the variables vscore2 for the virtual learning group and pscore2 for the physical learning group.
The analysis indicated there was a significant difference for diff2, the differences between the variables vscore2 and pscore2, at α = 0.05. The findings do not support Research Hypothesis 02.
Summary
CHAPTER 5: DISCUSSION
Introduction
In this chapter major findings between physical and virtual learning are
discussed. The findings of this study were based on the data collected in the form of the pretest-‐posttest research design. Using this form of instrumentation, the comparative analyses between physical learning and virtual learning was explored. This discussion seeks to achieve an interpretation of empirical analysis of the data and compare the results of the research with the literature review or with the views of other researchers. The chapter also gives guidance and suggestions for future studies relating to physical learning versus virtual learning, and concluding with lessons learned about the
research from the perspective of the researcher.
Summary of Findings
There have been many discussions of physical learning versus virtual learning in the Technology, Engineering, and Design Education field. These discussions go back and forth to what it the best method to teach students within the field. Many