INVESTIGATION
Trisomic and Allelic Differences In
fl
uence
Phenotypic Variability During Development
of Down Syndrome Mice
Samantha L. Deitz and Randall J. Roper1 Department of Biology and Indiana University Center for Regenerative Biology and Medicine, Indiana University-Purdue University Indianapolis, Indiana 46202
ABSTRACTIndividuals with full or partial Trisomy 21 (Ts21) present with clinical features collectively referred to as Down syndrome (DS), although DS phenotypes vary in incidence and severity between individuals. Differing genetic and phenotypic content in individuals with DS as well as mouse models of DS facilitate the understanding of the correlation between specific genes and phenotypes associated with Ts21. The Ts1Rhr mouse model is trisomic for 33 genes (the“Down syndrome critical region”or DSCR) hypothesized to be responsible for many clinical DS features, including craniofacial dysmorphology with a small mandible. Experiments with Ts1Rhr mice showed that the DSCR was not sufficient to cause all DS phenotypes by identifying uncharacteristic craniofacial abnormalities not found in individuals with DS or other DS mouse models. We hypothesized that the origins of the larger, dysmorphic mandible observed in adult Ts1Rhr mice develop from larger embryonic craniofacial precursors. Because of phenotypic variability seen in subsequent studies with Ts1Rhr mice, we also hypothesized that genetic background differences would alter Ts1Rhr developmental phenotypes. Using Ts1Rhr offspring from two genetic backgrounds, we found differences in mandibular precursor volume as well as total embryonic volume and postnatal body size of Ts1Rhr and nontrisomic littermates. Additionally, we observed increased relative expression ofDyrk1aand differential expression ofEts2on the basis of the genetic background in the Ts1Rhr mandibular precursor. Our results suggest that trisomic gene content and allelic differences in trisomic or nontrisomic genes influence variability in gene expression and developmental phenotypes associated with DS.
D
OWN syndrome (DS) is caused by three copies of all or part of human chromosome 21 (Hsa21) and occurs in1 of 700–800 live births (Christiansonet al.2006). Individuals with DS display subsets of phenotypes with a spectrum of severities including cognitive impairment, facial dysmorphol-ogy, congenital heart defects, and behavioral anomalies (Richtsmeier et al. 2000; Epstein 2001; Van Cleve et al.2006; Van Cleve and Cohen 2006). The precise genetic and molecular mechanisms causing specific traits associated with Trisomy 21 (Ts21) are not well defined. Early genotype– phenotype analyses based on individuals with partial Ts21 were used to define a“Down syndrome critical or chromo-somal region”(DSCR), and trisomy of the DSCR was thought
to be responsible for most of the major clinical features of DS (Korenberget al.1990; Delabaret al.1993). Experiments in mice with segmental trisomy for the DSCR disproved the original DSCR hypothesis by demonstrating that genes in the DSCR were not sufficient to cause the craniofacial fea-tures associated with DS (Olsonet al.2004a). Advanced anal-yses of individuals with segmental Ts21 have presented evidence against a single critical region affecting all DS phe-notypes and led to the hypothesis that three copies of a gene or genes on Hsa21 (not the entire DSCR or only the DSCR) may be an important factor for one or a few well-defined DS abnormalities (Korbelet al.2009; Lyleet al.2009).
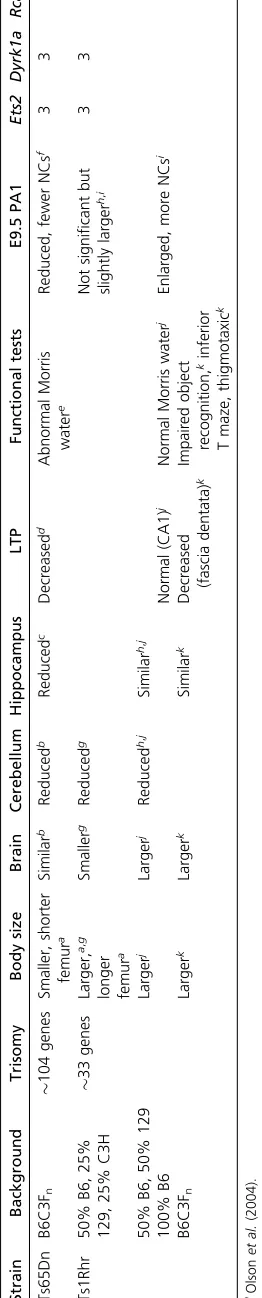
The correlation between DS genotype and phenotype has been investigated using mouse models trisomic for Hsa21 homologs (Table 1) (Escorihuela et al. 1995; Siarey et al.
1997; Baxteret al.2000; Olsonet al.2004a, 2007; Lorenzi and Reeves 2006; Aldridge et al. 2007; Belichenko et al.
2009). Ts65Dn mice, the most commonly used mouse model of DS, replicate many DS-like abnormalities, including
Copyright © 2011 by the Genetics Society of America doi: 10.1534/genetics.111.131391
Manuscript received June 6, 2011; accepted for publication September 8, 2011 Supporting information is available online at http://www.genetics.org/content/
suppl/2011/09/16/genetics.111.131391.DC1.
1Corresponding author: Department of Biology, Indiana University Center for
a small mandible and other craniofacial phenotypes (Richtsmeier et al. 2000). The Dp(16Cbr1-ORF9)1Rhr (Ts1Rhr) mouse model, trisomic for the 33 genes ortholo-gous to those in the DSCR (and triplicated in Ts65Dn mice), was developed to test the DSCR hypothesis by examining craniofacial phenotypes in mice. Ts1Rhr mice exhibited a larger overall size and craniofacial alterations, including a larger and morphologically different mandible than ob-served in Ts65Dn mice and individuals with DS (Olson
et al.2004a). Additional studies of Ts1Rhr mice and euploid littermates have shown differences in cerebellar and brain size, as well as neuronal long-term potentiation (LTP) and behavioral tests of learning and memory (Table 1) (Aldridge
et al.2007; Olsonet al.2007; Belichenkoet al.2009). Yet, some discrepancies exist between studies with Ts1Rhr mice, possibly due to differences in genetic background and ex-perimental methodologies (Table 1). Taken together, these studies show Ts1Rhr mice may have alterations in similar structures as those affected in individuals with DS, although the resultant phenotype may not always replicate those seen in other DS mouse models or individuals with DS.
Candidate genes for craniofacial phenotypes associated with DS include Dyrk1a, Rcan1 (Dscr1), and Ets2. Dyrk1a
has been implicated in several DS phenotypes, including cognitive impairment, motor function, and craniofacial ab-normalities (Altafajet al.2001; Hammerleet al.2003; Arron
et al. 2006). AlthoughRcan1may contribute to behavioral, neurophysiological, and suppression-of-tumor-growth phe-notypes in DS, a third copy of only a small contiguous ge-netic segment includingRCAN1in humans was not sufficient to cause DS craniofacial phenotypes (Baek et al. 2009; Belichenko et al. 2009; Eggermann et al.2010). In mouse models, overexpression ofEts2 has been implicated in cra-niofacial and tumorigenesis phenotypes (Sumarsono et al.
1996; Wolvetang et al. 2003; Sussan et al.2008). Yet, re-ducing theEts2 copy number from three to two in Ts65Dn mice was not enough to normalize the DS-like craniofacial abnormalities with the exception of some mesoderm-derived elements of the skull (Hill et al.2009). Ts1Rhr mice have three copies ofDyrk1aandEts2but two copies ofRcan1and may be used in conjunction with other DS models to un-derstand the effects of trisomic genes on craniofacial devel-opment (Table 1).
The origin of the small mandible associated with DS has been traced to a small first pharyngeal arch (PA1) with fewer neural crest cells in embryonic day 9.5 (E9.5) Ts65Dn as compared to euploid embryos (Roperet al.2009). Addi-tionally, perinatal Ts65Dn mice commonly display the re-duced weight and small stature seen in infants with DS (Cronk et al. 1988; Roizen and Patterson 2003; Roper
et al. 2006). We present evidence suggesting that trisomic gene content as well as allelic differences in trisomic and nontrisomic genes lead to phenotypic differences in mandib-ular precursor development and postnatal growth in Ts1Rhr mice and may significantly contribute to the developmental variability of Ts21 phenotypes.
Materials and Methods
Mice
Dp(16Cbr1-ORF9)1Rhr (Ts1Rhr) mice were obtained from Roger Reeves at The Johns Hopkins University School of Medicine (Baltimore). These mice had been backcrossed to C57BL/6J (B6) mice for 12 generations (N12) to establish the B6.Ts1Rhr line. 129S6/SvEv (129) mice were pur-chased from Taconic Laboratories (Germantown, NY). B6CBA-Tg(Wnt1-lacZ)206Amc/J mice were obtained from The Jackson Laboratory and backcrossed for 6 generations to B6 mice to create B6 mice carrying the Wnt1-lacZ transgene (B6.Wnt1-lacZ). B6.129S4-Gt(ROSA)26Sortm1Sor/J (B6.R26R) and C3H/HeJ (C3H) mice were purchased from The Jackson Laboratory and crossed to create B6C3F1 males. 129S6/SvEv (129) mice were bred to B6 mice, and the trisomic mice generated (B6129.Ts1Rhr) were then bred to B6C3F1 animals to produce offspring from B6129.Ts1Rhr
·B6C3F1 and B6C3F1·B6129.Ts1Rhr crosses. Both male and female Ts1Rhr mice are fertile and were used to gen-erate additional mice. Offspring were genotyped at 6 days and weighed at 6 and 28 days to compare with previous analyses of Ts65Dn mice. Mice were maintained on the Lab Diet 5001 Rodent Diet (PMI Nutrition International, Brent-wood, MO). All animal research was approved by the Indi-ana University-Purdue University IndiIndi-anapolis (IUPUI) Institutional Animal Care and Use Committee and per-formed at IUPUI.
Generation of embryos from Ts1Rhr mothers
(B6.Ts1Rhr·B6.Wnt1-lacZ) and (B6129.Ts1Rhr·B6C3F1) matings were used to obtain E9.5 embryos with a B6 (hence-forth referred to as“inbred”) or50% B6, 25% C3H, 25% 129 (henceforth referred to as“mixed”) genetic background, respectively. Female Ts1Rhr mice were introduced to male mice in the evening and subsequently checked for vaginal plugs the next morning, with E0.5 established at noon on the day the plug was found. Nine days following plug iden-tification, pregnant Ts1Rhr mothers were killed, E9.5 em-bryos were dissected, and somites were counted. Emem-bryos were processed as previously established (Roper et al.
2009), sectioned parasagitally at 18mm and counterstained with 0.1% eosin, or used for gene expression analysis as described below. E9.5 embryos derived from 17 inbred [n= 34 trisomic (Ts), 73 euploid (Eu)] and 8 mixed (n= 31 Ts, 35 Eu) matings were used to quantify PA1 volume as previously done in E9.5 Ts65Dn offspring (Roper et al.
2009).
Gene expression analysis of Ts1Rhr embryonic tissue
RNA was isolated from the PA1 of each embryo using the PureLink RNA Micro Kit (Invitrogen) and analyzed for purity and concentration using the Nanodrop ND-1000 Spectrophotometer (Thermo Scientific). For each gene expression assay, RNA from somite and litter-matched samples was converted to cDNA using the TaqMan Reverse
Transcription Reagents and quantitative PCR (qPCR) performed with the TaqMan Expression Master Mix (Ap-plied Biosystems) and reference (Ev1orActin) and target (Dyrk1a, Rcan1, and Ets2) gene probes. Crossing point (Cp) values from each probe (done in triplicate) were av-eraged for comparison of target to reference samples using the Applied Biosystems 7300 Real Time PCR System and software. Analysis of Cp values was performed as previ-ously described (Pfaffl2001).
Genotyping of Ts1Rhr embryos and mice
Embryonic and postnatal offspring were genotyped by PCR amplification of DNA isolated from yolk sacs and tissues taken at 6 days postnatal, respectively. Offspring from Ts1Rhr mice were genotyped by PCR using primers for Hyg (Olsonet al.2004a) (59CCGTCAGGACATTGTTGGA 39) and (59 CCGTAACCTCTGCCGTTCA 39) amplified for 35 cycles (denaturation: 30 s at 94; annealing: 60 s at 55; and extension: 45 s at 72) and the duplication junction (59GCCAGAGGCCACTTGTGTAG 39) and (59TGTTGACCTC GAGGGACCTA 39) amplified for 30 cycles (denaturation: 30 s at 94; annealing: 30 s at 62.6; and extension: 30 s at 72) as well as the Tcrd DNA control primers (oIMR 8744 and 8745) (The Jackson Laboratory).
Quantitative morphological analysis of embryonic mice
Unbiased stereology was used to determine the volume and number of neural crest cells in the PA1 of Ts1Rhr and euploid littermate E9.5 embryos through systematic random sampling (Mouton 2002; Roper et al.2009). PA1 volumes and neural crest cell numbers were obtained on every fourth and third section, respectively, as previously described (Roper et al. 2009). Twelve euploid and 12 trisomic em-bryos with an inbred background and 10 euploid and 10 trisomic embryos with a mixed background were used for stereological studies. Average coefficient of error (CE) was ,0.01 for embryonic volume and ,0.10 for PA1 volume and neural crest (NC) number. Scaling of the PA1 was per-formed by dividing the PA1 volume by the embryonic vol-ume for each individual embryo.
Statistical analyses
All data were checked and did not significantly deviate from the expected normal distributions. Data analysis was per-formed using a two-tailed t-test and chi square analysis in Microsoft Excel. Differences between offspring on the inbred
and mixed backgrounds were determined using ANOVA in PROC GLM (SAS, Cary, NC). Least significant difference post-hoc comparisons (contrasts) were used to determine differences between backgrounds for individual phenotypes. A significance level ofa = 0.05 was used in all multiple comparison tests. Raw data has been deposited as support-ing information,File S1.
Results
Variability in mandibular development in the Ts1Rhr model of DS
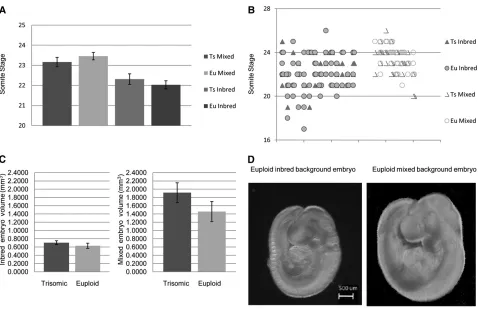
The PA1 contains NC cells and is a developmental precursor to structures of the mid and lower face, including the mandible. We anticipated that the larger, more dysmorphic mandible found in adult Ts1Rhr mice would be predicated by a larger PA1 containing more NC cells in E9.5 Ts1Rhr as compared to euploid littermates. Somite-matched E9.5 Ts1Rhr trisomic and control mixed background embryos [similar background where craniofacial, mandibular, and body size changes were observed in adult Ts1Rhr mice Figure 2 Average somite stage, somite variability, and volumes of E9.5 embryos by genotype and genetic background. (A) Embryos of mixed background displayed greater average somite stages than those of inbred background (n¼11 trisomic and 12 euploid andn¼12 trisomic and 12 euploid, respectively). (B) No overall difference in distribution of somite stage was seen in E9.5 euploid and Ts1Rhr embryos on either an inbred (P¼ 0.61,n¼32 trisomic and 69 euploid embryos) or mixed (P¼0.26,n¼31 trisomic and 35 euploid embryos) background. On the graph embryos are separated according to litter horizontally and somite number vertically. (C) Embryonic volumes (mm3) of trisomic and euploid somite-matched embryos
(Olsonet al.2004a)] did not exhibit a significant difference in PA1 volume (Figure 1A). To test the effect of allelic differ-ences on the mandibular precursor phenotype, we examined PA1 volume in E9.5 Ts1Rhr and euploid embryos on an in-bred C57BL/6J background. Both the PA1 volume (P = 0.004) and the NC number (P , 0.001) were greater in Ts1Rhr as compared to euploid somite-matched inbred em-bryos (Figure 1, A and B). Additionally, the PA1 from all in-bred Ts1Rhr and euploid embryos was significantly smaller than those on a mixed background (P= 0.004) (Figure 1A). Developmental size affected by trisomic and
nontrisomic genes
Because the PA1 appeared smaller in all inbred as compared to mixed background embryos, we examined developmental body size and stage as potential contributors to the observed mandibular precursor phenotype. E9.5 Ts1Rhr as compared to euploid embryo littermates showed no significant differ-ence in average number of somites or embryonic volume when compared within a single background (Figure 2, A–C). When all Ts1Rhr and euploid embryos were compared in a single ANOVA analysis, however, both trisomic and eu-ploid embryo body sizes from a mixed background were
larger than Ts1Rhr and euploid littermate embryo body sizes from an inbred background (Figure 2, C and D). Be-cause there was a marked difference in overall embryonic volume between backgrounds, we scaled PA1 size to overall body volume within a single background and found the scaled PA1 volume remained significantly larger (P = 0.0037) in trisomic embryos from an inbred background and approached significance (P = 0.063) in trisomic em-bryos from a mixed background.
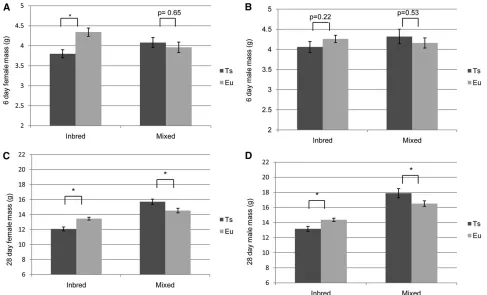
To understand how genetic background influences post-natal development as indicated by mass, we examined pup weights at postnatal day 6 (P6) and P28. At P6, there were significant differences in weight between all female offspring (F3,204= 5.03,P= 0.002). A posthoc analysis revealed that female inbred Ts1Rhr mice weighed less than either their euploid littermates or female offspring from the mixed back-ground cross (Figure 3A). No significant differences between male mice were seen at P6 (Figure 3B). However, at P28 both female and male inbred Ts1Rhr trisomic offspring weighed significantly less than their euploid littermates and all mixed background counterparts (Figure 3, C and D). In contrast, but in agreement with previously published data (Olson et al.
background weighed significantly more than euploid litter-mates (Figure 3, C and D). The data on embryonic and post-natal size, combined with previous results observed in Ts65Dn mice (Table 1) (Roper et al.2006, 2009), indicate that differences in trisomic content as well as allelic differ-ences in either trisomic or nontrisomic genes are responsible for some developmental phenotypic variability.
Expression of Dyrk1a, Rcan1, and Ets2 in PA1 of Ts1Rhr E9.5 embryos
To identify how allelic differences affect trisomic gene expression in the developing PA1, the expression ofDyrk1a,
Rcan1, andEts2, three genes implicated in craniofacial phe-notypes (Sumarsonoet al. 1996; Altafaj et al.2001; Ham-merleet al.2002; Wolvetanget al.2003; Arronet al.2006; Hillet al.2009), was analyzed. Relative expression (trisomic/ euploid) by qPCR revealed an altered expression ratio corre-sponding to the dosage increase ofDyrk1abut an expression ratio close to 1 ofRcan1andEts2in the E9.5 PA1 of mixed background embryos (Figure 4). Trisomic embryos on an in-bred background also displayed increased relative Dyrk1a
expression, slightly lower (P= 0.13) relativeRcan1 expres-sion, and significantly decreasedEts2expression in the PA1. Therefore, allele-specific differences appear to alter gene ex-pression in the developing mandibular precursor.
Prenatal loss of euploid embryos due to increased lethality during development
Due to the low frequency of trisomic offspring observed during development and perinatal stages in Ts65Dn mice (Roperet al.2006; Blazeket al.2010), we assessed similar parameters in Ts1Rhr litters. The percentage of trisomic em-bryos at E9.5 on an inbred background was significantly lower than the Mendelian ratio of trisomic and euploid em-bryos on a mixed background (Table 2). The two Ts1Rhr crosses with different backgrounds showed no significant difference in the average number of embryos per female at
E9.5 or the percentage of trisomic pups at P6 (Table 2). However, the average number of postnatal offspring per lit-ter from an inbred mating was significantly reduced com-pared to litters of a mixed background. In addition, the number of euploid pups appeared to be decreasing from mid-gestation to P6 in the inbred background, but not in the mixed background. These results provide additional ev-idence that allelic differences in Ts1Rhr mice differentially affect offspring at perinatal stages.
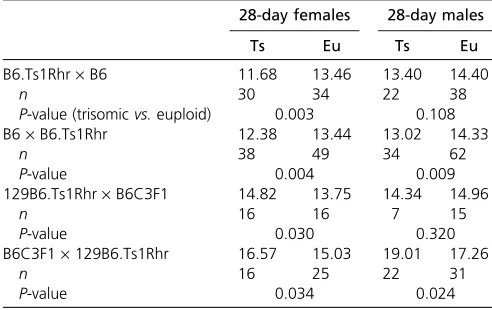
Influence of parental origin of trisomy or sex on traits
The postnatal offspring in this study came from trisomic parents used in reciprocal B6.Ts1Rhr · B6 and B6 · B6. Ts1Rhr or B6129.Ts1Rhr ·B6C3F1 and B6C3F1·B6129. Ts1Rhr matings. The possible effect of parental origin of the trisomy on differences in postnatal phenotypes was investi-gated using the P28 weights of male and female pups on inbred and mixed backgrounds. A significant difference was observed in female inbred Ts1Rhr mice originating from different trisomic parents (F3,147= 6.84,P= 0.0002). Post-hoc analyses showed that euploid females weighed more than trisomic females from either a trisomic mother or father on the inbred background (Table 3). In the posthoc analy-ses, weight differences between male offspring from an in-bred background were significant (F3,152= 3.32,P= 0.02) but not as clearly divided as those between females. Euploid mice from either trisomic parent were significantly larger than trisomic mice from a trisomic father but not a trisomic Figure 4 Dyrk1a,Rcan1, andEts2gene expression alter-ations in the PA1 of inbred and mixed background mice. Slight but not significant differences in gene expression between inbred and mixed backgrounds in the PA1 of E9.5 embryos were seen inDyrk1aandRcan1(P¼0.23 and 0.13, respectively). A significant difference in expres-sion levels was present between both backgrounds for Ets2(*P,0.05). Expression levels ofRcan1andEts2in the PA1 of E9.5 embryos on a mixed background did not differ significantly from euploid levels, whileDyrk1awas significantly upregulated (n¼ 6 trisomic and 6 euploid embryos from 3 litters). Expression ofRcan1was slightly downregulated in the PA1 of E9.5 embryos on an inbred background,Dyrk1awas upregulated, andEts2was sig-nificantly downregulated in expression (n¼7 trisomic and 7 euploid embryos from three litters). Results are provided with error bars indicating standard error of the mean.
Table 2 Reproductive success and inheritance of trisomy in Ts1Rhr mice
Inbred Ts1Rhr (% trisomy)
Mixed Ts1Rhr (% trisomy)
P-value (% trisomy)
Litter size E9.5 7.59 (31.8%) 8.25 (47.0%) 0.44 (0.009) n 107 pups, 17 litters 66 pups, 8 litters
mother. From these data, we found no strong parent-of-origin effect causing differences in the weight of offspring from inbred Ts1Rhr mice.
When P28 weight was examined in male offspring with a mixed background, a significant difference was observed (F3, 71= 11.77,P,0.0001). Posthoc analyses revealed that both trisomic and euploid male and female mice from B6C3F1 ·B6129.Ts1Rhr matings were significantly larger than trisomic and euploid mice from B6129.Ts1Rhr · B6C3F1 matings. Both female trisomic and euploid mice with a nontrisomic mother were significantly larger than euploid pups but not larger than trisomic mice from a tri-somic mother. These results suggest that, on a mixed back-ground, offspring from euploid mothers are larger at 28 days and may indicate an interaction between maternal ploidy and specific alleles from the mixed background cross.
Discussion
Developmental phenotypes affected by trisomic and disomic content
By examining the Ts1Rhr mouse model on differing genetic backgrounds, we provide evidence that interaction between allelic differences in trisomic content and genetic back-ground causes variability in DS phenotypes, including PA1 volume, pre- and postnatal body size, and percentage of trisomic embryonic offspring. Analyses with mouse models and partial trisomies in humans have shown that certain trisomic regions correlate with both the incidence and the severity of DS phenotypes (Richtsmeier et al. 2002; Olson
et al. 2004b, 2007; Korbel et al. 2009; Lyle et al. 2009; Reynoldset al.2010; Yuet al. 2010). Studies investigating the penetrance and variability in DS phenotypes have pre-viously singled out nontrisomic genes as important factors in DS phenotypes (Epstein 2001; Kerstann et al. 2004). For example, nontrisomic CRELD1 mutations have been linked to an increased penetrance of atrioventricular septal defects in individuals with DS, and the occurrence of DS-like heart defects in the Tc1 DS mouse model were dependent upon
genetic background (Maslen et al. 2006; Dunlevy et al.
2010). Certain alleles of GATA1, also not found on Hsa21, may predispose individuals with Ts21 to DS-related acute megakaryoblastic leukemia (Wechsleret al.2002). Similarly, allelic differences in trisomic and nontrisomic genes may also account for phenotypic variability and some differences in brain volume and LTP observed in studies using Ts1Rhr mice, although methodological differences may also be re-sponsible for some of these divergent phenotypes (Table 1) (Olson et al.2007; Belichenkoet al.2009).
Contribution of Dyrk1a, Rcan1, and Ets2 to embryonic mandibular development
Our qPCR gene expression analysis demonstrates that copy number may not necessarily correlate with gene expression in a specific tissue at any given time point.Rcan1is found in two copies in Ts1Rhr embryos and seemed to be equivalently expressed in trisomic and euploid embryos on a mixed back-ground, but expression appeared slightly reduced in the PA1 of inbred Ts1Rhr embryos.Dyrk1ais found in three copies in the Ts1Rhr embryos and was upregulated in Ts1Rhr as com-pared to euploid littermate E9.5 PA1 on both backgrounds. AlthoughEts2is also found in three copies in all Ts1Rhr em-bryos, in inbred Ts1Rhr embryos its expression was signifi -cantly reduced in trisomic as compared to euploid E9.5 PA1. However, no significant difference in expression was seen be-tween trisomic and euploid embryos on a mixed background. Interestingly, in previous studies reducingEts2to two cop-ies in Ts65Dn mice, little effect was seen on the DS-like cra-niofacial abnormalities (Hillet al.2009). In Ts65DnEts2+/2 mice, the mesoderm and not the neural crest-derived skeletal elements had shape differences that were of a greater magni-tude than those found between Ts65Dn and normal mice. Our results suggest that differential expression ofEts2and its pos-sible contribution to the embryonic mandibular precursor phe-notype occurs because of differential allelic contributions in the Ts1Rhr embryos. Taken together, the results of our work and others demonstrate complex genetic interactions involv-ing Ets2and other genes in determining craniofacial abnor-malities (Sumarsonoet al.1996; Wolvetanget al.2003; Hill
et al. 2009). Furthermore, a susceptibility region containing trisomic genes may have a major influence on a distinct phe-notype but only as it interacts with other trisomic and non-trisomic genes. This hypothesis may provide a genetic explanation to account for the incidence and variability of DS phenotypes (Aldridgeet al.2007; Lyleet al.2009). Relationships between developmental stage, embryo volume, and structural phenotypes
Structures from trisomic and euploid Ts65Dn embryos matched for size or developmental stage may display significant differences in their development (Blazek et al.
2010). In Blazek et al. 2010, developmental differences were controlled by using somite-matched embryos and mea-suring the volume of the E9.5 embryos. In the present study, no significant difference existed in the average overall Table 3 Postnatal day 28 weight of inbred and mixed background
offspring
28-day females 28-day males
Ts Eu Ts Eu
B6.Ts1Rhr·B6 11.68 13.46 13.40 14.40
n 30 34 22 38
P-value (trisomicvs.euploid) 0.003 0.108
B6·B6.Ts1Rhr 12.38 13.44 13.02 14.33
n 38 49 34 62
P-value 0.004 0.009
129B6.Ts1Rhr·B6C3F1 14.82 13.75 14.34 14.96
n 16 16 7 15
P-value 0.030 0.320
B6C3F1·129B6.Ts1Rhr 16.57 15.03 19.01 17.26
n 16 25 22 31
somite stage between the two backgrounds or between the two genotypes within that background. Significant differen-ces were present, however, between the total volumes of the trisomic and euploid embryos from differing backgrounds. Our work implies that changes in overall embryonic size may affect developmental processes. For example, in man-dibular development when PA1 size was compared in so-mite-matched Ts1Rhr embryos, only the PA1 from inbred Ts1Rhr embryos was significantly larger than euploid, al-though scaled PA1 volume results for mixed Ts1Rhr embryos appeared to approach significance. Later in development, man-dibular precursor differences between Ts1Rhr and euploid em-bryos on a mixed background may become significant. Although definitive craniofacial analysis has not been per-formed in inbred Ts1Rhr mice, the scaled PA1 volume supports the hypothesis that the larger, dysmorphic mandible seen in adult Ts1Rhr mice is caused by differences in the mandibular precursor as typified by the PA1 (Olsonet al. 2004a). Addi-tionally, the loss in euploid offspring from midgestation to P6, contrary to what has been shown in Ts65Dn offspring (Roper
et al. 2006; Blazeket al. 2010), may be due to the reduced embryonic size of the euploid as compared to the trisomic embryosin utero. Because embryos that appear similar accord-ing to traditionally defined developmental markers such as somite or Theiler staging may actually display differences in growth parameters, investigators may need to account for both developmental stage and size when examining developmental phenotypes in trisomic and euploid embryos.
Our work investigated developmental phenotypes in the Ts1Rhr mouse model with two different genetic back-grounds using identical methodologies and environmental conditions. We show that allelic differences affect PA1 phenotypes, tissue-specific differential gene expression, and developmental variability. These results suggest that the phenotypic variability in other DS mouse models may also be affected by allelic differences. These data also support the hypothesis of the complex genetics and interaction between trisomic and disomic genes in developmental phenotypes associated with DS.
Acknowledgments
This work was supported by funding from an Indiana University-Purdue University Indianapolis Honors Program Research Fellowship (S.L.D. and R.J.R.) and by National Institutes of Health grant DE021034 from the National Institute of Dental and Craniofacial Research (R.J.R.). The contents are solely the responsibility of the authors and do not necessarily represent the official views of the NIDCR.
Literature Cited
Aldridge, K., R. H. Reeves, L. E. Olson, and J. T. Richtsmeier, 2007 Differential effects of trisomy on brain shape and volume in related aneuploid mouse models. Am. J. Med. Genet. A 143: 1060–1070.
Altafaj, X., M. Dierssen, C. Baamonde, E. Marti, J. Visa et al., 2001 Neurodevelopmental delay, motor abnormalities and cognitive deficits in transgenic mice overexpressing Dyrk1A (minibrain), a murine model of Down’s syndrome. Hum. Mol. Genet. 10: 1915–1923.
Arron, J. R., M. M. Winslow, A. Polleri, C. P. Chang, H. Wuet al., 2006 NFAT dysregulation by increased dosage of DSCR1 and DYRK1A on chromosome 21. Nature 441: 595–600.
Baek, K. H., A. Zaslavsky, R. C. Lynch, C. Britt, Y. Okada et al., 2009 Down’s syndrome suppression of tumour growth and the role of the calcineurin inhibitor DSCR1. Nature 459: 1126–1130.
Baxter, L. L., T. H. Moran, J. T. Richtsmeier, J. Troncoso, and R. H. Reeves, 2000 Discovery and genetic localization of Down syn-drome cerebellar phenotypes using the Ts65Dn mouse. Hum. Mol. Genet. 9: 195–202.
Belichenko, N. P., P. V. Belichenko, A. M. Kleschevnikov, A. Salehi, R. H. Reeveset al., 2009 The“Down syndrome critical region” is sufficient in the mouse model to confer behavioral, neuro-physiological, and synaptic phenotypes characteristic of Down syndrome. J. Neurosci. 29: 5938–5948.
Blazek, J. D., C. N. Billingsley, A. Newbauer, and R. J. Roper, 2010 Embryonic and not maternal trisomy causes develop-mental attenuation in the Ts65Dn mouse model for Down syn-drome. Dev. Dyn. 239: 1645–1653.
Christianson, A., C. P. Howson, and B. Modell, 2006 March of Dimes Global Report on Birth Defects: The Hidden Toll of Dying and Disabled Children, pp. 1–98. March of Dimes Birth Defects Foundation, White Plains, NY.
Cronk, C., A. C. Crocker, S. M. Pueschel, A. M. Shea, E. Zackaiet al., 1988 Growth charts for children with Down syndrome: 1 month to 18 years of age. Pediatrics 81: 102–110.
Delabar, J. M., D. Theophile, Z. Rahmani, Z. Chettouh, J. L. Blouin
et al., 1993 Molecular mapping of twenty-four features of Down syndrome on chromosome 21. Eur. J. Hum. Genet. 1: 114–124.
Dunlevy, L., M. Bennett, A. Slender, E. Lana-Elola, V. L. Tybulewicz
et al., 2010 Down’s syndrome-like cardiac developmental de-fects in embryos of the transchromosomic Tc1 mouse. Cardio-vasc. Res. 88: 287–295.
Eggermann, T., N. Schonherr, S. Spengler, S. Jager, B. Denecke
et al., 2010 Identification of a 21q22 duplication in a Silver-Russell syndrome patient further narrows down the Down syn-drome critical region. Am. J. Med. Genet. A 152A: 356–359. Epstein, C. J., 2001 Down syndrome (trisomy 21), pp. 1223–1256
inThe Metabolic and Molecular Bases of Inherited Disease, edited by C. R. Scriver, A. L. Beaudet, W. S. Sly, and D. Valle. McGraw-Hill, New York.
Escorihuela, R. M., A. Fernandez-Teruel, I. F. Vallina, C. Baamonde, M. A. Lumbreras et al., 1995 A behavioral assessment of Ts65Dn mice: a putative Down syndrome model. Neurosci. Lett. 199: 143–146.
Hammerle, B., E. Vera-Samper, S. Speicher, R. Arencibia, S. Martinezet al., 2002 Mnb/Dyrk1A is transiently expressed and asymmetrically segregated in neural progenitor cells at the transition to neurogenic divisions. Dev. Biol. 246: 259–273. Hammerle, B., C. Elizalde, J. Galceran, W. Becker, and F. J. Tejedor,
2003 The MNB/DYRK1A protein kinase: neurobiological func-tions and Down syndrome implicafunc-tions. J. Neural Transm. Suppl: 129–137.
Hill, C. A., T. E. Sussan, R. H. Reeves, and J. T. Richtsmeier, 2009 Complex contributions of Ets2 to craniofacial and thy-mus phenotypes of trisomic “Down syndrome” mice. Am. J. Med. Genet. A 149A: 2158–2165.
Kerstann, K. F., E. Feingold, S. B. Freeman, L. J. Bean, R. Pyatt
heart defects in Down syndrome. Genet. Epidemiol. 27: 240– 251.
Korbel, J. O., T. Tirosh-Wagner, A. E. Urban, X. N. Chen, M. Kasowski
et al., 2009 The genetic architecture of Down syndrome pheno-types revealed by high-resolution analysis of human segmental trisomies. Proc. Natl. Acad. Sci. USA 106: 12031–12036. Korenberg, J. R., H. Kawashima, S. M. Pulst, T. Ikeuchi, N. Ogasawara
et al., 1990 Molecular definition of a region of chromosome 21 that causes features of the Down syndrome phenotype. Am. J. Hum. Genet. 47: 236–246.
Lorenzi, H. A., and R. H. Reeves, 2006 Hippocampal hypocellu-larity in the Ts65Dn mouse originates early in development. Brain Res. 1104: 153–159.
Lyle, R., F. Bena, S. Gagos, C. Gehrig, G. Lopez et al., 2009 Genotype-phenotype correlations in Down syndrome identified by array CGH in 30 cases of partial trisomy and partial monosomy chromosome 21. Eur. J. Hum. Genet. 17: 454–466. Maslen, C. L., D. Babcock, S. W. Robinson, L. J. Bean, K. J. Dooley
et al., 2006 CRELD1 mutations contribute to the occurrence of cardiac atrioventricular septal defects in Down syndrome. Am. J. Med. Genet. A 140: 2501–2505.
Mouton, P. R., 2002 Principles and Practices of Unbiased Stereol-ogy: An Introduction for Bioscientists. Johns Hopkins University Press, Baltimore.
Olson, L. E., J. T. Richtsmeier, J. Leszl, and R. H. Reeves, 2004a A chromosome 21 critical region does not cause specific Down syndrome phenotypes. Science 306: 687–690.
Olson, L. E., R. J. Roper, L. L. Baxter, E. J. Carlson, C. J. Epstein
et al., 2004b Down syndrome mouse models Ts65Dn, Ts1Cje, and Ms1Cje/Ts65Dn exhibit variable severity of cerebellar phe-notypes. Dev. Dyn. 230: 581–589.
Olson, L. E., R. J. Roper, C. L. Sengstaken, E. A. Peterson, V. Aquino
et al., 2007 Trisomy for the Down syndrome“critical region”is necessary but not sufficient for brain phenotypes of trisomic mice. Hum. Mol. Genet. 16: 774–782.
Pfaffl, M. W., 2001 A new mathematical model for relative quan-tification in real-time RT-PCR. Nucleic Acids Res. 29: e45. Reynolds, L. E., A. R. Watson, M. Baker, T. A. Jones, G. D’Amico
et al., 2010 Tumour angiogenesis is reduced in the Tc1 mouse model of Down’s syndrome. Nature 465: 813–817.
Richtsmeier, J. T., L. L. Baxter, and R. H. Reeves, 2000 Parallels of craniofacial maldevelopment in Down syndrome and Ts65Dn mice. Dev. Dyn. 217: 137–145.
Richtsmeier, J. T., A. Zumwalt, E. J. Carlson, C. J. Epstein, and R. H. Reeves, 2002 Craniofacial phenotypes in segmentally trisomic mouse models for Down syndrome. Am. J. Med. Genet. 107: 317–324.
Roizen, N. J., and D. Patterson, 2003 Down’s syndrome. Lancet 361: 1281–1289.
Roper, R. J., H. K. St. John, J. Philip, A. Lawler, and R. H. Reeves, 2006 Perinatal loss of Ts65Dn Down syndrome mice. Genetics 172: 437–443.
Roper, R. J., J. F. VanHorn, C. C. Cain, and R. H. Reeves, 2009 A neural crest deficit in Down syndrome mice is associated with deficient mitotic response to Sonic hedgehog. Mech. Dev. 126: 212–219.
Siarey, R. J., J. Stoll, S. I. Rapoport, and Z. Galdzicki, 1997 Altered long-term potentiation in the young and old Ts65Dn mouse, a model for Down syndrome. Neuropharmacol-ogy 36: 1549–1554.
Sumarsono, S. H., T. J. Wilson, M. J. Tymms, D. J. Venter, C. M. Corricket al., 1996 Down’s syndrome-like skeletal abnormali-ties in Ets2 transgenic mice. Nature 379: 534–537.
Sussan, T. E., A. Yang, F. Li, M. C. Ostrowski, and R. H. Reeves, 2008 Trisomy represses Apc(Min)-mediated tumours in mouse models of Down’s syndrome. Nature 451: 73–75. Van Cleve, S. N., and W. I. Cohen, 2006 Part I: clinical practice
guidelines for children with Down syndrome from birth to 12 years. J. Pediatr. Health Care 20: 47–54.
Van Cleve, S. N., S. Cannon, and W. I. Cohen, 2006 Part II: Clin-ical Practice Guidelines for adolescents and young adults with Down Syndrome: 12 to 21 Years. J. Pediatr. Health Care 20: 198–205.
Wechsler, J., M. Greene, M. A. McDevitt, J. Anastasi, J. E. Karp
et al., 2002 Acquired mutations in GATA1 in the megakaryo-blastic leukemia of Down syndrome. Nat. Genet. 32: 148–152. Wolvetang, E. J., T. J. Wilson, E. Sanij, J. Busciglio, T. Hatzistavrou
et al., 2003 ETS2 overexpression in transgenic models and in Down syndrome predisposes to apoptosis via the p53 pathway. Hum. Mol. Genet. 12: 247–255.
Yu, T., C. Liu, P. Belichenko, S. J. Clapcote, S. Liet al., 2010 Effects of individual segmental trisomies of human chromosome 21 syn-tenic regions on hippocampal long-term potentiation and cogni-tive behaviors in mice. Brain Res. 1366: 162–171.
GENETICS
Supporting Information
http://www.genetics.org/content/suppl/2011/09/16/genetics.111.131391.DC1
Trisomic and Allelic Differences In
fl
uence
Phenotypic Variability During Development
of Down Syndrome Mice
Samantha L. Deitz and Randall J. Roper
File S1 Supporting Data
File S1 is available for download at http://www.genetics.org/content/suppl/2011/09/16/genetics.111.131391.DC1 as an Excel file.