A Generalized Failure Map for Fuel Elements Subject to a Power Pulse
John C. Luxat1) and David R. Novog1)
1) Department of Engineering Physics, McMaster University, Hamilton, ON, Canada
ABSTRACT
This paper reviews the various power pulse tests that have been conducted in research reactors over the past three decades and summarizes the dominant fuel failure modes that that have been observed in these tests. Using physically based analytical models a map of failure limits for Zircaloy-clad uranium dioxide fuel is developed. This falure map is used to assess the experimental data from the power pulse tests. It is shown that the fuel failure map provides a good basis for establishing criteria that demarcate the observed fuel failure modes for the various fuel designs that have been used in these tests.
INTRODUCTION
The behaviour of nuclear fuel subjected to a short duration power pulse is of relevance to LWR and CANDU reactor safety. Reactivity Initiated Accidents (RIA) in LWR’s would subject fuel to a short duration power pulse of large amplitude, whereas in CANDU a large break Loss of Coolant Accident (LOCA) would subject fuel to a longer duration, lower
amplitude power excursion. The energy generated in the fuel during the power pulse is a key parameter governing the fuel response.
This paper reviews the various power pulse tests that have been conducted in research reactors over the past three decades and summarizes the fuel failure modes that that have been observed in these tests. A simple analytical model is developed to characterize fuel behaviour under power pulse conditions and the model is applied to assess the experimental data from the power pulse tests. It is shown that the simple model provides a good basis for establishing criteria that demarcate the observed fuel failure modes for the various fuel designs that have been used in these tests. Theses criteria are developed into a generalized failure map applicable to zircaloy clad uranium dioxide fuel. In addition, it is shown that the analytical model provides a basis for application of the available experimental data to quantify the behaviour of CANDU-type fuel.
SUMMARY OF RIA EXPERIMENTAL DATA
Since the early 1990’s a significant amount of data on RIA tests performed on LWR, VVER and CANDU-type fuels in various research reactors has become available in the open literature. The tests are briefly summarized below [1].
LWR-Type Fuel
Some of the earliest RIA tests were performed in the Special Power Excursion Reactor Test (SPERT) program conducted in the Capsule Driver Core (CDC) facility [2]. These tests were performed at atmospheric pressure, ambient temperature conditions, stagnant water coolant conditions and zero initial power representing zero power cold startup conditions in a BoilingWater Reactor (BWR). Fuel burnup ranged from 0 GWd/tU (fresh) to approximately 33 GWd/tU (792 MWh/kgU). These tests indicated rapid fuel dispersal (fragmentation) occurring at radial fuel enthalpy in excess of 275 cal/g (1150 kJ/kg).
A series of RIA tests were performed in the Power Burst Facility (PBF) at Idaho Falls [2]. The tests employed three different designs of Pressurized Water Reactor (PWR) fuel at zero irradiation and burnup of approximately 5 GWd/tU (120 MWh/kgU). Conditions in the tests simulated zero power, hot startup in a BWR (coolant temperature of 538oK, coolant pressure of 6.45 MPa and flow of 85 cm3/s). Fuel failures involving fuel framentation due to gross fuel melting were observed in a number of instances at radial average fuel enthalpies in the range 277 cal/g to 285 cal/g. Failures due to Pellet Clad Mechanical Interaction (PCMI) was also observed for some of the irradiated fuel rods. Typical half-height width of the pulse in the SPERT and PBF tests is approximately 4 ms which is narrower than typical LWR RIA pulse widths of
approximately 20ms and is more than two orders of magnitude narrower than CANDU LOCA power pulses. A very large number of RIA tests have been conducted in the Nuclear Safety Research Reactor (NSRR) test program of the Japan Atomic Energy Research Institute (JAERI). The NSSR is a modified TRIGA-ACPR (Annular Core Pulse Reactor) with a flexible pulse shaping control system and high pulse power capability. In excess of 1200 tests have been performed to date [4-16] covering a wide range of fuel designs, fuel burnup, coolant conditions and power transient characteristics. However, as is the case with the majority of pulse reactors high energy deposition levels are achieved only
with short pulse widths. As in the SPERT and PBF tests typical half-height pulse width in these tests is of the order of 3 to 4ms. Separate effects tests in NSRR have investigated a wide range of factors [4-16].
Starting in 1992 a test program involving high burnup UO2 and MOX (Mixed Oxide) PWR fuel has been conducted by the French regulator, IPSN, in collaboration with the utility, EDF [20],[21],[22]. The tests were conducted in the CABRI reactor, a low pressure liquid sodium cooled loop research reactor that is operated by the French CEA at the Cadarache Nuclear Research Centre. Pulse height widths of between 9 ms and 75 ms have been applied in the tests performed to date.
In the first test, Rep Na-1, with high burnup PWR fuel from the Graveline Unit 5 reactor, rod (element) failure occurred at a very low energy deposition level of 30 cal/g and resulted in dispersal of a significant amount of fine fuel particles. As a consequence of this test, an increased interest in RIA fuel behaviour at high fuel burnup has led to a better understanding of the factors influencing high burnup fuel performance under RIA conditions. The primary influencing factors – clad ductility deterioration due to water-side corrosion and development of a “rim” region [21],[22] at the pellet edge – are not relevant to CANDU fuel.
VVER-Type Fuel
Tests on VVER annular pellet fuel have been performed in the Impulse Graphite Reactor (IGR) is located in Semipalatinsk, Kazakstan. The test program conducted by the Russian Research Centre - Kurchatov Institute of Moscow, Russia involved RIA type tests with fresh and high burnup VVER fuel under atmospheric pressure conditions with both water and air cooling [17],[18],[19]. These tests had very wide power pulses of between 0.63 to 0.84 second half-height width, which is more typical of a CANDU LOCA power pulse. However, the VVER fuel pellets are of annular design with a hollow central region. The fuel clad was Zr-1%Nb alloy, unlike the U.S. and Japanese tests which were performed on fuels with Zr-4 cladding. The Russian Zr-1%Nb alloy has greater corrosion resistance than Zr-4 and, consequently, no significant deterioration in fuel performance was observed at high burnup in the region of 50 GWd/tU (1200 MWh/kgU).
CANDU-Type Fuel
Experimental data exists for CANDU-type fuel under power pulse conditions that are representative of large LOCA and for RIA conditions similar to those for LWR-type fuel. This data is summarized below.
The PBF-CANDU test was performed in the PBF reactor under conditions simulating a large LOCA [26]. Four test elements were used, three were pre-irradiated to 5 GWd/tU (120 MWh/kgU) in the NRX reactor at Chalk River and the fourth element was fresh. Two of the irradiated test elements were pre-pressurized to 0.44 MPa and 1.1 MPa, respectively ,and the fresh element was pre-pressurized to 0.52 MPa. Initial loop coolant water conditions were a temperature of 300oC, a pressure of 10.4 MPa and a flow per test element of 1 l/s. The test was conducted with a loop blowdown transient similar to a CANDU LOCA transient with a controlled increase in element power from approximately 53 kW/m initially to a peak of 100 kW/m in 1 second, followed by a reduction to approximately 10 kW/m in 0.5 seconds. Maximum sheath temperatures in the region of 1250oK to 1305oK were attained and temperatures were maintained at these elevated temperatures until about 105 seconds into the test, at which time quench cooldown was initiated. Two elements failed in the test. One failure was due to atypical oxidation under an imperfectly laser welded spacer pad and the second failure was due to non-uniform diametral strain that caused a small localized cracking of the sheath oxide layer.
RIA type power pulse tests have been performed in a TRIGA-ACPR (Annular Core Pulse Reactor) at the Nuclear Research Institute, Pitesti, Romania. A total of 24 tests have been performed on CANDU type fuel samples starting from zero power cold conditions in a stagnant, water-filled capsule at atmospheric pressure. The results from 12 tests are reported in the open literature [23] and an asessment of some of the tests has been published [24]. As is typical of the TRIGA-ACPR reactors, a high amplitude pulse power is achieved with short pulse width of approximately 4 to 6 ms half-height width. The energy deposition rates are two orders of magnitude more rapid than in a typical CANDU power pulse. However, this data is of relevance in comparing the behaviour of CANDU-type fuel to that of LWR- type fuel under very rapid RIA power pulses.
FUEL FAILURE MODES
The following fuel failure modes have been identified in RIA type power pulse tests (see Table 1):
Oxygen embrittlement of fuel sheaths due to Zircaloy-steam oxidation reaction followed by clad cracking on subsequent thermal quench of the test rod. This failure mode occurs well after the power pulse and is associated with energy deposition levels sufficient to induce departure from nucleate boiling (DNB) on the test rod clad.
Pellet Clad Mechanical Interaction (PCMI), which typically occurs during, or shortly after the power pulse, with the fuel sheath still relatively cool. The failure is associated with high strain rate loading of the sheath due to rapid thermal expansion or internal pressurization of the rod. Failures, such as that observed in the CABRI Rep-Na-1 test, can occur at relatively low energy deposition levels if the clad has lost ductility due to waterside corrosion effects, such as hydriding, development of thick oxide layers, and spalling of the oxide.
High temperature burst (creep strain failure) resulting in a local bulge and split in the sheath. Fuel sheath temperature in excess of the alpha-beta Zircaloy transition temperature and internal fission gas pressure higher than the external coolant pressure are pre-requisites for this failure mode to occur (i.e. to drive the rapid creep strain mechanism).
Fuel fragmentation, which can occur at high fuel enthalpy and involves extensive fuel melting and internal pressurization of the test rod prior to clad failure. Significant amounts of molten fuel can be relocated out of the failed rod and the evidence of prior melting is apparent from the spherical shape of the solidified fuel “particles” collected after the test.
Fuel dispersal, which may correspond to fuel fragmentation for fuel with burnup less than approximately 42 GWd/tU, but which is a significantly different process for high burnup LWR fuel. At high burnup (greater than 42 GWd/tU) a “rim” region develops at the outer periphery of the fuel (Ref. 22, 25), of approximately 100 µm depth, in which the fuel microstructure is significantly altered. The rim region is characterized by defect clusters of extremely tangled dislocations, loss of as-fabricated grain boundary, fine recrystallized grains of 50-200 nm size and coarsened pores surrounded by re-crystallized grains. Following sheath failure, the fuel in the rim region can be ejected and dispersed as fine fuel particles that do not present the recognizable spherical shape of prior melted fuel particles. This failure mode is not applicable to CANDU fuel since burnup is too low to give rise to a rim region
.
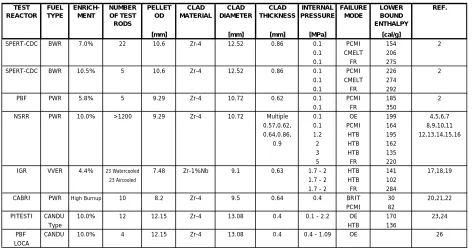
TABLE 1
SUMMARY OF RIA EXPERIMENTS
TEST REACTOR
FUEL TYPE
ENRICH-MENT
NUMBER OF TEST RODS
PELLET OD
CLAD MATERIAL
CLAD DIAMETER
CLAD THICKNESS
INTERNAL PRESSURE
FAILURE MODE
LOWER BOUND ENTHALPY
REF.
[mm] [mm] [mm] [MPa] [cal/g]
SPERT-CDC BWR 7.0% 22 10.6 Zr-4 12.52 0.86 0.1 PCMI 154 2 0.1 CMELT 206
0.1 FR 275
SPERT-CDC BWR 10.5% 5 10.6 Zr-4 12.52 0.86 0.1 PCMI 226 2 0.1 CMELT 274
0.1 FR 292
PBF PWR 5.8% 5 9.29 Zr-4 10.72 0.62 0.1 PCMI 185 2 0.1 FR 350
NSRR PWR 10.0% >1200 9.29 Zr-4 10.72 Multiple 0.1 OE 199 4,5,6,7 0.57,0.62, 0.1 PCMI 164 8,9,10,11 0.64,0.86, 1.2 HTB 195 12,13,14,15,16
0.9 2 HTB 162
3 HTB 135
5 FR 220
IGR VVER 4.4% 23 Watercooled 7.48 Zr-1%Nb 9.1 0.63 1.7 - 2 HTB 141 17,18,19
23 Aircooled 1.7 - 2 HTB 102
1.7 - 2 FR 284
CABRI PWR High Burnup 10 8.2 Zr-4 9.5 0.64 0.4 BRIT 30 20,21,22 PCMI 82
PITESTI CANDU 10.0% 12 12.15 Zr-4 13.08 0.4 0.1 - 2.2 OE 170 23,24
Type HTB 136
PBF CANDU 10.0% 4 12.15 Zr-4 13.08 0.4 0.4 - 1.09 OE 26 LOCA
ANALYSIS OF LIMITS FOR FUEL FAILURE MODES
The average fission energy generation rate (power) in the fuel pellets of a fuel element is proportional to the neutron flux,φ(t) , which for pulse type excursions can be approximated by a point kinetic equation of the form:
(
)
0
* φ φ
β ρ
ρ
φ − − +
=
l
dn feedback insertion
dt d
(1)
The Doppler feedback can be approximated by a function of the integrated power (energy deposited) in the fuel, since this quantity determines the energy stored in the fuel and hence the fuel temperature. Hence:
( )
tdt E(t)feedback ξ φ ξ
ρ =
∫
= (2)The radial power distribution in a fuel pellet of radius R can be represented by: )
( ) ( ) ,
(r t f r t
P =Κ φ (3)
Where, K = neutron flux to power conversion constant }
) ( { )
(r 0 I0 r e (r R)
f =Ψ κ +β λ − , and Ψ0 , κ, β andλ are functions of fissile enrichment and burnup.
The corresponding radial distribution of UO2 enthalpy in the fuel pellet due to a radial averaged specific energy
deposition Ea (kJ/kg) is given by:
) ( ) ( )
(r f r E h r
h = a+ i (4)
hi(r) is the initial radial distribution of enthalpy corresponding to an initial temperature distribution Ti(r). Note that the majority of RIA tests have been performed under cold zero-power initial conditions for which Ti(r) is constant and approximately equal to 20oC. The energy deposition during the short width power pulses typical of RIA tests is effectively adiabatic and the radial temperature distribution in the pellet can be evaluated from:
2 2 1
0 ( ) ( )
)} ( { )
(r g h r c ch r c hr
T = ≈ + + (5)
Where g{h(r)} is the inverse functional relationship between temperature and enthalpy of UO2 derived from the functional
relationship between enthalpy and temperature for UO2 [27],[28], namely hUO2 = H(TUO2). Limits for the various fuel failure modes observed in the RIA tests in different tests reactors can be established from fundamental consideration of the
governing physical phenomena. These limits are derived as functions of the radial averaged specific energy deposition, EDa, as follows.
Oxygen Embrittlement (OE)
The fuel clad (sheath) temperature Tc can be expressed as a function of the fuel pellet surface temperature Ts = T(R), the coolant temperature Tl , the gap conductance hg the clad thickness τ and thermal conductivity k and the coolant convective heat transfer coefficient hc according to:
c eff l c s eff c h h T h T h T + +
= with
1 1 − ⎟ ⎟ ⎠ ⎞ ⎜ ⎜ ⎝ ⎛ + = k h h g eff τ (6)
and Ts =g{h(R)}=g{f(R)EDa+hi(R)}
If the energy deposition and resultant pellet surface temperature are sufficiently large then the clad outer surface will experience departure from nucleate boiling (DNB) and subsequent film boiling. If the clad temperature increases sufficiently, then extensive oxidation can occur during the period that the deposited energy is transferred from the fuel to the surrounding coolant. Zircaloy oxidation kinetics exhibits parabolic rate behaviour in which the thickness of the Zicraloy oxide layer, δo , as a function of time, t , under isothermal conditions can be expressed as: o = Dto with
2 δ 0.00 20.00 40.00 60.00 80.00 100.00 120.00 140.00 160.00 180.00 200.00
140 160 180 200 220 240 260 280
ENERGY DEPOSITION [cal/g]
P E RCE NTAG E O F C L AD O X IDIZE D Natural 2 wt% 6 wt% 10 wt% 15 wt%
RANGE OF ENERGY DEPOSITION FOR OXYGEN EMBRITTLEMENT SHEATH FAILURE
D = C exp( B/(T + 273)) = C exp(B/T')
The Zr-4 clad oxidation kinetics parameters C and B are evaluated from the Prater-Cathcart correlation [29]. The thickness of Zircaloy consumed, δz , to produce a Zircaloy oxide layer of thickness δo is given by δo = 1.56 δz . The thickness of the oxide layer on the clad for a PWR fuel element as a function of the power pulse energy deposition (in units of cal/g) is shown in Figure 1 for different fissile enrichments in the range of the RIA tests. The calculated values of oxide thickness for the 10% enrichment are in good agreement with those measured in NSRR tests in Japan [13]. As the extent of clad oxidation increases the higher will be the thermal stresses experienced on quench cool-down and the more likely will be clad failure.
Figure 1. Percentage of Clad Oxidation vs Energy Deposition
The thermal hoop stress in the clad due to a temperature difference, ∆T, between inner and outer surfaces induced by quenching the hot clad is given by the well known relationship:
(
)
(
)
i m i R R m m m T E τ µ α σθ + = + ⎟ ⎠ ⎞ ⎜ ⎝ ⎛ − + − ∆ = 1 3 1 1 ln ) 1 ( 2 (8)Pellet-Clad Mechanical Interaction (PCMI)
The radial expansion ∆r of a UO2 fuel pellet subject to a change in temperature ∆T can be approximated as:
∆r ≈ 0.5 Dpelletα∆T (9)
Where α is the coefficient of thermal expansion of UO2. The corresponding radial strain is ε≈α∆T. Using the
relationship between fuel temperature and fuel enthalpy defined previously, the strain rate can be described by:
dt dh h g dt dT
∂ ∂ =
=α α
ε& (10)
Now the rate of change of enthalpy can be characterized by the ratio of the specific energy deposited in the power pulse, ED in units of kJ/kg, to the half height pulse width, ∆τ, yielding the following expression for strain rate,
τ α α ε
∆ ∂ ∂ =
= ED
h g dt dT
& (11)
The calculated strain rate as a function of energy deposition and half height pulse width is shown in Figure 2. Based upon the data in Table 1, PCMI failures were observed with irradiated fuel in tests with pulse widths of approximately 4 ms and fuel enthalpy values in excess of 600 kJ/kg (154 cal/g). this corresponds to a threshold strain rate of 0.5 per sec. As can be seen from Figure 2 PCMI failures are strongly dependent upon pulse width and become less likely as pulse width increases. A very low probability of PCMI failure is expected for CANDU-typical power pulses which have pulse widths of the order of 1000 ms.
1.00E-04 1.00E-03 1.00E-02 1.00E-01 1.00E+00
0 200 400 600 800 1000 1200 1400
FUEL ENTHALPY [kJ/kg]
ST
RAI
N RAT
E
[p
e
r s
e
c
o
n
d
]
4 ms 9 ms 20 ms 1000 ms
PCMI FAILURE THRESHOLD RANGE
Figure 2. Clad Strain Rate vs Fuel Enthalpy
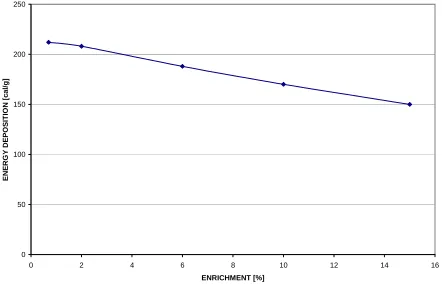
Clad Melting (CMELT)
The energy deposition values for clad melting failure are similar to those associated with oxygen embrittlement failure and the two mechanisms frequently occur together [13]. The energy deposition limits for Zircaloy melting (clad temperature of 1860oC) are shown as a function of pellet fissile enrichment in Figure 3.
0 50 100 150 200 250
0 2 4 6 8 10 12 14 16
ENRICHMENT [%]
E
N
ER
G
Y
D
E
P
O
SI
T
IO
N
[
cal
/g
]
Figure 3 Energy Deposition for Clad Melting
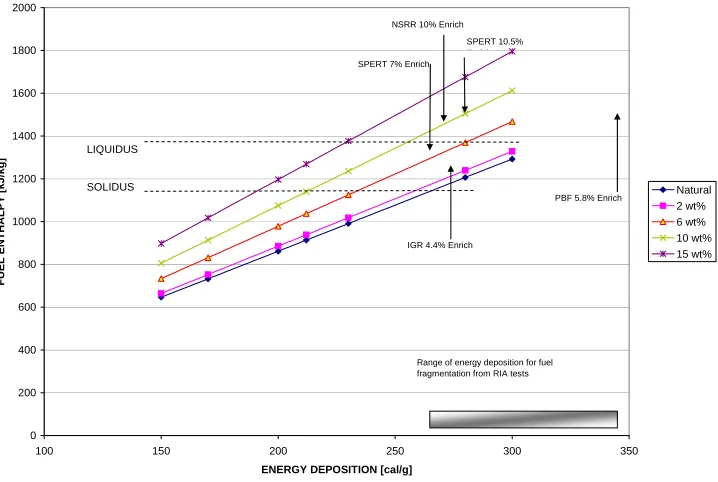
Fuel Fragmentation (FR)
Evidence from the RIA tests on fresh fuel and irradiated fuel with burnup less than 40 Gwd/tU is that fragmentation of the fuel is associated with ejection of molten material from the fuel. As shown above, the maximum fuel temperature for power pulses from cold zero-power initial conditions occurs at the surface of the fuel pellet which, in turn, is where melting is likely to first occur. The enthalpy at the surface of the pellet as a function of the radial average energy deposition is shown in Figure 4 for various fissile enrichments. Also shown is the enthalpy for liquid UO2 formation, which is the sum of the
enthalpy for onset of melting in the solidus phase plus the heat of fusion (259 kJ/kg). The lower bounds on radial average fuel enthalpy for fuel fragmentation observed in the various RIA tests are shown in Figure 4. This clearly indicates that fragmentation of fuel with ductile cladding is associated with melting at the periphery of the fuel pellet and is strongly influenced by the radial fission power distribution, as governed by the fissile enrichment in the tests.
0 200 400 600 800 1000 1200 1400 1600 1800 2000
100 150 200 250 300 350
ENERGY DEPOSITION [cal/g]
FUEL ENTHALPY
[kJ/kg] Natural
2 wt% 6 wt% 10 wt% 15 wt% SOLIDUS
LIQUIDUS
Range of energy deposition for fuel fragmentation from RIA tests SPERT 7% Enrich
SPERT 10.5% E i h NSRR 10% Enrich
IGR 4.4% Enrich
PBF 5.8% Enrich
Figure 4 Fuel Enthalpy at Pellet Surface as a Function of Energy Deposition
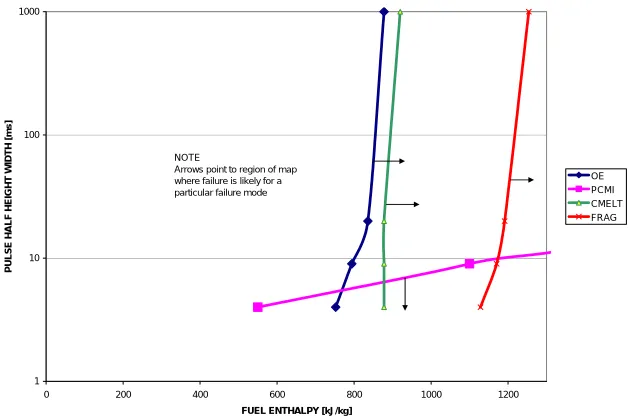
FUEL FAILURE MAP FOR POWER PULSE EVENTS
A fuel failure map for the various fuel failure modes is developed from the analytical criteria described above. For each failure mode the limiting conditions are evaluated by converting where necessary the energy deposition into an equivalent radially averaged fuel enthalpy using standard properties for UO2 and Zircaloy obtained from the literature. Adjustment to
the fuel enthalpy is made to account for the energy removal during the power pulse. For the majority of the RIA test data conducted with very short half pulse widths, this adjustment is small. The resultant failure map is plotted in Figure 5.
CONCLUSIONS
The following conclusions are drawn regarding the failure map for fuel failure modes under power pulse conditions such as RIA:
1) Threshold values of fuel enthalpy for clad melting and fuel fragmentation failures are not strongly dependent upon the power pulse width (half height width) and increase slightly with increase in pulse width due to the increased heat removed by the coolant. Clad melt failure occurs at similar, but slightly higher enthalpy values than oxygen embrittlement failure.
2) Threshold values of fuel enthalpy for oxygen embrittlement failure tend to increase with increasing pulse width due to the larger sensitivity of fuel sheath temperature to energy removed by the coolant. Fuel sheath failure mode changes from oxygen embrittlement failure, during a thermal quench, to high temperature burst as the pressure difference between the inside of the fuel element and the outside coolant increases. This was the predominant
failure mode seen in the NSRR tests with pressurized rods, the IGR tests with high burnup VVER rods and the Romanian tests with CANDU type fuel.
3) PCMI failure has a strong sensitivity to pulse width and the threshold fuel enthalpy for failure increases rapidly with increasing half height pulse width. Additionally, for this mode of failure very small gaps between fuel pellet and sheath is necessary. It is for this reason that PCMI failures have been observed in RIA tests with short pulse widths (4 ms) and irradiated fuel, while unirradiated fuel tends not to exhibit this failure mode. PCMI is an unlikely failure mode for CANDU fuel because of the long power pulse.
4) Fuel fragmentation for fresh and irradiated rods with fuel sheaths that maintained ductility (i.e. sheaths without the excessive corrosion observed on LWR high burnup fuel cladding) is associated with gross melting of the fuel.
5) Avoidance of fuel melting precludes fuel fragmentation.
1 10 100 1000
0 200 400 600 800 1000 1200
FUEL ENTHALPY [kJ/kg]
P
U
LS
E
HALF HE
IGHT WIDTH
[m
s]
OE PCMI CMELT FRAG NOTE
Arrows point to region of map where failure is likely for a particular failure mode
Figure 5. Failure Map for UO2 Fuel Subject to a Power Pulse
MISCELLANEOUS NOMENCLATURE
ρinsertion = positive reactivity insertion that initiates the power pulse,
ρfeedback = negative fuel temperature (Doppler)reactivity feedback, R*
= prompt neutron generation time
βdn = total fraction of delayed neutron precursors
φ0 = initial neutron source
to = time over which clad is oxidized. T = temperature (C)
T ‘ = temperature (K)
D = rate constant,a function of T . ED = deposited fission energy E = Young’s modulus of clad µ = Poisson ratio for clad
τm = thickness of non oxidized (metal) region of clad
REFERENCES
1. J.C. Luxat, “Fuel Behaviour During a Power Pulse: A Review and Assessment of Reactivity Initiated Accident Test Data”, Proc CNS Annual Conference, Toronto, June 2002.
2. P.E. MacDonald, S.L. Seiffert, Z.R. Martinson, R.K. McCardell, D.E. Owen and S.K. Fukuda, “Assessment of Light-Water-Reactor Fuel Damage during a Reactivity-Initiated Accident”, Nuclear Safety, Vol. 21, No.5, September-October, 1980.
3. T. Fujishiro, T. Inabe and M. Sobajima, “Fuel Behaviour During Simulated Reactivity Initiated Accidents in the NSSR Experiments and its Application”, Proc. 27th Canadian Nuclear Association Annual Conference, Saint John, New Brunswick, Canada, 1987.
4. S. Katanishi and K. Ishijima, “Experimental Study on Fuel Behavior During Reactivity Accident at Power Operating Conditions”, J. Nucl. Sci. and Tech., Vol. 32, No. 11, November 1995.
5. T. Fujishiro, K. Yanagisawa, K. Ishijima and K. Shiba, “Transient Fuel Behavior of Preirradiated PWR Fuels under Reactivity Initiated Accident Conditions”, J. Nucl. Mat., 188, 1992.
6. K. Yanagisawa, “ A Study on the Behavior of Pressurized Hollow UO2 Fuel under Reactivity Initiated Accident
Conditions”, Nucl. Eng. Des., 116, 1989.
7. K. Ishijima and T. Nakamura, “Transient Elongation of a Fresh Fuel Rod under Reactivity Initiated Accident Conditions”, J. Nucl. Sci. and Tech., Vol. 33, No.3, March 1996
8. S. Saito, K. Ishijima, S. Shiozawa and K. Iwata, “ Effects of Rod Pre-Pressurization on Light Water Reactor Fuel Behavior during Reactivity Initiated Accident Conditions”, J. Nucl. Sci. and Tech., Vol. 19, No.4, April 1982 9. T. Abe, N. Nakae, K. Kodato, M. Matsumoto and T. Inabe, “Failure Behavior of Plutonium-Uranium Mixed Oxide
Fuel under Reactivity Initiated Accident Conditions”, J. Nucl. Mat. , 188, 1992.
10. S. Yanagihara and S. Shiozawa, “Cladding Embrittlement and Fuel Rod Failure Threshold under Reactivity Initiated Accident Conditions”, J. Nucl. Sci. and Tech., Vol. 24, No.11, November 1987
11. S. Shiozawa, S. Saito and S. Yanagihara, “ Zircaloy-UO2 and Water Reactions and Cladding Temperature Estimation for Rapidly-Heated Fuel Rods under an RIA Condition”, J. Nucl. Sci. and Tech., Vol. 19, No.5, May 1982
12. T. Fujishiro, M. Hirose, S. Kobayashi and S. Tanzawa, “Effects of Coolant Flow on Light Water Reactor Fuel Behaviors during Reactivity Initiated Accident”, J. Nucl. Sci. and Tech., Vol. 18, No.3, March 1981
13. T. Fuketa, K. Ishijima and T. Fujishiro, “Hydrogen Generation during Cladding/Coolant Interactions under Reactivity Initiated Accident Conditions”, J. Nucl. Sci. and Tech., Vol. 33, No.1, January 1996
14. NSRR Experimental Research Results, 16th NSRR Technical Review Meeting, Reactivity Accident Laboratory, JAERI, Nov. 2-3, 1992.
15. T. Sugiyama and T. Fuketa, “Mechanical Energy Generation during High Burnup Fuel Failure under Reactivity Initiated Accident Conditions”, J. Nucl. Sci. and Tech., Vol. 37, No.10, October 2000.
16. T. Fuketa and T. Fujishiro, “Generation of Destructive Forces during Fuel/Coolant Interactions under Severe Reactivity Initiated Accident Conditions”, Nucl. Eng. Des., 146, 1994.
17. L. Yegorova, “Data Base on VVER High Burn-up Fuel Rods under RIA Conditions: Final Report”, COG Report COG-96-548, Vols. 1 & 2, October 1996.
18. V. Asmolov and L. Yegorova, “Development and Performance of a Research Program for the Analysis of High Burn-up Fuel Rod Behavior under RIA Conditions in the IGR Pulse Reactor”, Proc. CSNI Spec. Mtg. On Transient behavior of High Burnup Fuel, Cadarache, France, September 12-14, 1995.
19. V. Asmolov and L. Yegorova, “Results of Reactor Tests to Investigate VVER Fuel Element Behavior under RIA Conditions”, COG Report COG-97-290-E, June 1996.
20. J. Papin, M. Balourdet, F. Lemoine, J.M. Frizonnet and F. Schmitz, “French Studies on High Burnup Fuel Transient Behavior under RIA Conditions”, Nuclear Safety, Vol. 37, 1996.
21. J. Papin, H. Rigat and J.P. Breton, “The Behaviour of Irradiated Fuel under RIA Transients: Interpretation of the CABRI Experiments”, Proc. CSNI Spec. Mtg. On Transient behavior of High Burnup Fuel, Cadarache, France, September 12-14, 1995.
22. F. Schmitz and J. Papin, “High Burnup Effects on Fuel Behaviour under Accident Conditions: the Tests CABRI REP-Na”, J. Nucl. Mat., 270, 1999.
23. G. Negut and M. Popov, “UO2 Fuel Behavior under RIA Type Tests”, J. Nucl. Mat. , 188, 1992.
24. G. Horhoianu, D.V. Ionescu, I. Stefan and G. Olteanu, “CANDU Type Fuel Behaviour During Rapid Overpower Transients”, Nucl. Eng. Des., 179, 1998.
25. B-H. Lee, Y-H. Koo and D-S. Sohn, “Rim Characteristics and Their Effects on the Thermal Conductivity in High Burnup UO2 Fuel”, J. Nucl. Sci. and Tech., Vol. 38, No.1, January 2001.
26. J. Adams, R.K. McCardell, P. Kalish, R. McCormick and Z. R. Martinson, “PBF-CANDU Fuel Element Loss-of-Coolant Accident Experiment Test Results Report” EG&G Idaho, Inc., EGG-2384, May 1985.
27. J.K. Fink, G.M. Chasanov and L. Leibowitz, “ Thermophysical Properties of Uranium Dioxide”, Journal of Nuclear Materials, 102, 1981.
28. J.J. Carbajo, G.L. Yoder, S.G. Popv and V.K.Ivanov, “A Review of the Thermophysical Properties of MOX and UO2 Fuels”, Journal of Nuclear Materials, 299, 2001.
29. RE.Pawel. J.V. Cathcart and R.A. McKee,” The Kinetics of Oxidation of Zircaloy-4 in Steam at High temperatures”, Journal of the Electrochemical Society, Vol. 126, 1979.