A data-driven approach to
η
and
η
Dalitz decays
Rafel Escribano1,2,
1Grup de Física Teòrica, Departament de Física, Universitat Autònoma de Barcelona,
E-08193 Bellaterra (Barcelona), Spain
2Institut de Física d’Altes Energies (IFAE), The Barcelona Institute of Science and Technology (BIST),
Campus UAB, E-08193 Bellaterra (Barcelona), Spain
Abstract. Data-driven model-independent predictions for the dilepton invariant mass spectra and branching ratios of the single and double Dalitz decaysη() → +−γand
η()→+−+−(=eorμ) are provided by means of an approach based on the use of
rational approximants applied to the available experimental data in the space-like region of theηandηtransition form factors.
1 Introduction
In this talk I have provided data-driven model-independent predictions for the dilepton invariant mass spectra and integrated branching ratios (BRs) of the single and double Dalitz decaysη()→+−γand
η()→+−+−with=eorμ. For a detailed and exhaustive analysis of all the processes considered,
including theπ0 ones not reported here, I refer to the original work in Ref. [1]. It is worth noticing that the previous analysis is the first complete work including all the possible Dalitz reactions. Our approach is based on the use of rational approximants applied to the available experimental data in the space-like region of theηandηtransition form factors (TFFs) [2]. It is defined as model independent because we are able to ascribe a conservative systematic error to our predictions. In this sense, the traditional VMD description of the TFF in terms of a monopole used commonly by experimental collaborations must be considered only as a first step in this systematic approximation. For the case of the double Dalitz decays, which demand TFFs of double virtuality not yet experimentally available, we have made use of the factorization hypothesis stating that the normalised version of the double-virtual TFFs is nothing else than the product of the two single-double-virtual TFFs.
2 Transition form factors
The energy dependence of theη andη TFFs in the time-like region required for describing these Dalitz decays has been predicted after fixing this dependence but from existing data in the space-like region reported by the CELLO [3], CLEO [4], L3 [5], andBABAR[6] collaborations. A more precise determination of these TFFs could have been obtained here taking into account in addition the recent data in the time-like region coming from the NA60 [7] (η → μ+μ−γ), A2 [8, 9] (η →
0.0 0.1 0.2 0.3 0.4 0.5
1.0 5.0 2.0 3.0 1.5 7.0
s GeV
F
2 Η NA60
A2 QED PadéP22
PadéP15
Taylor expansion
0.0 0.2 0.4 0.6 0.8 1.0
0.5 1.0 5.0 10.0 50.0 100.0
s GeV
F Η' 2 QED BESIII PadéP11
PadéP1 6
Taylor expansion
Figure 1. Modulus square of the normalised time-likeη(left) andη(right) TFF as a function of the invariant dilepton mass, √s ≡m. The predictions are compared to the experimental data fromη→e+e−γ[9] (black
circles),η→μ+μ−γ[7] (green squares) andη→e+e−γ[10] (black circles).
sets of time-like data was studied in Refs. [11] and [12], for theη andηcases, respectively. The application of Padé approximants (PAs) in the space-like is safe and reliable since the TFFs do not contain singularities in this region. The TFFs are expected to be well-behaved analytical functions except for a cut starting at theππthreshold. The PAs, being rational functions and thus containing only poles by construction, are not sensitive to this unitary cut belonging to the time-like region. Therefore, one could think that PAs cannot be applied to this time-like region. However, it was shown in Ref. [12] that the effect of this unitary cut is minor and then one needs only to worry about the appearance of possible poles on the real (energy) axis that would prevent PAs from being used from that singularity on. Such poles could be understood as the projection on the real axis of resonance poles (or a combination of them) in the complex plane. For theη, the first pole encountered is well beyond the region of available phase-space and therefore its TFF is well established. For the η, instead, the first pole appears in the upper part of the phase-space, somewhere inside the resonance region attributed to the lowest-lying vector mesons. For that reason, we match theηTFF predicted by PAs to the more common VMD description to be able to predict the integrated BRs of theη Dalitz decays (see Ref. [1] for details). In Fig. 1, our predictions for the the time-like region energy dependence of theη(left)andη(right)TFFs are shown. We display the predictions for two different types of PAs, those with a single pole in the denominator, P1L, motivated by the likely dominance of resonances, and those diagonal,PNN, where the high-energy behaviour of the TFF predicted by perturbative QCD is imposed1. The QED prediction (pointlike TFF) and the Taylor
expansion including the slope and the curvature of the TFF are also included for comparison in each case. The error bands incorporate not only the statistical but also the systematic error associated to our approach. Higher the order of the PA is, smaller the systematic error is. In this line, the corresponding systematic uncertainty of a VMD description (monopole FF) is much bigger than ours. As seen, the agreement between our predictions for the two TFFs and the experimental data is remarkable, making the whole approach trustworthy.
3 Single Dalitz decays
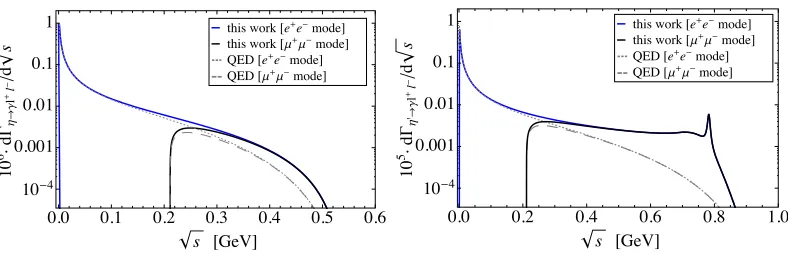
For the numerical computations, we have employed the PDG fitted valuesΓη→γγ = 0.516(18) keV andΓη→γγ =4.35(14) keV [13]. In Fig. 2, we display the decay rate distributions forη() →e+e−γ
1The fits in the space-like region were performed toQ2|F
0.0 0.1 0.2 0.3 0.4 0.5 0.6 10-4
0.001 0.01 0.1 1
s @GeVD
10
6ÿ
d
GhØg
l
+l
-ê
d
s
QED@m+m-modeD
QED@e+e-modeD
this work@m+m-modeD
this work@e+e-modeD
0.0 0.2 0.4 0.6 0.8 1.0
10-4
0.001 0.01 0.1 1
s @GeVD
10
5ÿ
d
Gh'Øg
l
+l -êd
s
QED@m+m-modeD
QED@e+e-modeD
this work@m+m-modeD
this work@e+e-modeD
Figure 2. Decay rate distributions forη()→e+e−γ(blue solid curves) andη()→μ+μ−γ(black solid curves).
The corresponding QED estimates are also displayed (grey dotted and long-dashed curves, respectively).
Table 1.Branching ratio predictions forη→+−γ(=e, μ) and their comparisons with experimental measurements and previous theoretical calculations.
Source BR(η→e+e−γ)×103 BR(η→μ+μ−γ)×104
QED 6.38 2.17
This work (P5
1) 6.60+−0.500.47 3.25+−0.400.36
This work (P2
2) 6.61+−0.530.49 3.30+−0.650.56
PDG [13] 6.9±0.4 3.1±0.4 H. Berghauseret al.[8] 6.6±0.4stat±0.4syst
WASA-at-COSY Coll. [14] 6.72±0.07stat±0.31syst
QED [16] 6.38 2.18
FF 2,3 [17] 6.57 3.05
FF 4 [17] 6.53 2.87
LFQM [18] 6.95 2.94
Hidden gauge [19] 6.57±0.03 3.05±0.04 Modified VMD [19] 6.55±0.03 2.97±0.05
(blue solid curves) andη() →μ+μ−γ(black solid curves). The non-pointlike behaviour of the TFFs
is notably seen in the upper part of the spectra, being its numerical effect (in the integrated BRs) much bigger in the dimuon case than in the dielectron one for obvious phase-space reasons. Our BR predictions forη() → +−γ( =e, μ) and their comparisons with experimental measurements
Table 2.Branching ratio predictions forη→+−γ(=e, μ) and their comparisons with experimental measurements and previous theoretical calculations.
Source BR(η→e+e−γ)×104 BR(η→μ+μ−γ)×104
QED 3.94 0.38
This work (P61) 4.42+−0.350.39 0.81+−00.13.16 This work (P1
1) 4.35+−0.290.27 0.74±0.06
PDG [13, 15] 1.08±0.27
BESIII Coll. [10] 4.69±0.20stat±0.23syst
Hidden gauge [19] 4.62±0.17 0.98±0.05 Modified VMD [19] 4.53±0.17 0.90±0.05
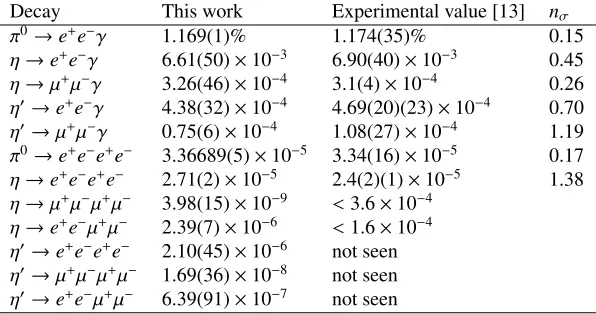
Table 3.Central final branching ratio predictions as a combined weighted average of the results presented. Errors are symmetrised.nσstands for the number of standard deviations the measured results are from our
predictions.
Decay This work Experimental value [13] nσ
π0→e+e−γ 1.169(1)% 1.174(35)% 0.15
η→e+e−γ 6.61(50)×10−3 6.90(40)×10−3 0.45
η→μ+μ−γ 3.26(46)×10−4 3.1(4)×10−4 0.26
η→e+e−γ 4.38(32)×10−4 4.69(20)(23)×10−4 0.70
η→μ+μ−γ 0.75(6)×10−4 1.08(27)×10−4 1.19
π0→e+e−e+e− 3.36689(5)×10−5 3.34(16)×10−5 0.17
η→e+e−e+e− 2.71(2)×10−5 2.4(2)(1)×10−5 1.38
η→μ+μ−μ+μ− 3.98(15)×10−9 <3.6×10⁻⁴
η→e+e−μ+μ− 2.39(7)×10−6 <1.6×10⁻⁴
η→e+e−e+e− 2.10(45)×10−6 not seen
η→μ+μ−μ+μ− 1.69(36)×10−8 not seen
η→e+e−μ+μ− 6.39(91)×10−7 not seen
4 Double Dalitz decays
For the double Dalitz decays,η() → +−+−with=eorμ, we will mostly use the factorisation
ansatz for the energy dependence of the doubly-virtual TFFs. However, bivariate approximants named Chisholm (CAs) can also be used. In these, besides the constraints imposed by perturbative QCD, one can implement OPE constraints as well. In both cases, the numerical predictions are indistinguishable. Again, the effect of the energy dependence of the TFFs is much bigger for the dimuon states, and in particular for theη channels. Our predictions for theηandηBRs involving two dielectron, two dimuon, and one dielectron and one dimuon final states are shown in the lower part of Table 3. Only the decayη → e+e−e+e−is measured at present. The other twoηdecays have upper bounds while nothing is known for theηdecays. There is some hope to measure in the near future the channels involving dielectron pairs but very unlikely for only dimuon pairs.
5 Conclusions
This work was supported in part by the Ministerio de Economía y Competitividad under grants CICYT-FEDER-FPA 2014-55613-P and SEV-2012-0234, and the Secretaria d’Universitats i Recerca del Departament d’Economia i Coneixement de la Generalitat de Catalunya under grant 2014 SGR 1450.
References
[1] R. Escribano and S. Gonzàlez-Solís, arXiv:1511.04916 [hep-ph]
[2] R. Escribano, P. Masjuan and P. Sanchez-Puertas, Phys. Rev. D89, 034014 (2014) [3] H. J. Behrendet al.[CELLO Collaboration], Z. Phys. C49, 401 (1991)
[4] J. Gronberget al.[CLEO Collaboration], Phys. Rev. D57, 33 (1998) [5] M. Acciarriet al.[L3 Collaboration], Phys. Lett. B418, 399 (1998)
[6] P. del Amo Sanchezet al.[BaBar Collaboration], Phys. Rev. D84, 052001 (2011) [7] R. Arnaldiet al.[NA60 Collaboration], Phys. Lett. B677, 260 (2009)
[8] H. Berghauseret al., Phys. Lett. B701, 562 (2011)
[9] P. Aguar-Bartolomeet al.[A2 Collaboration], Phys. Rev. C89, 044608 (2014) [10] M. Ablikimet al.[BESIII Collaboration], Phys. Rev. D92, 012001 (2015) [11] R. Escribano, P. Masjuan and P. Sanchez-Puertas, Eur. Phys. J. C75, 414 (2015)
[12] R. Escribano, S. Gonzàlez-Solís, P. Masjuan and P. Sanchez-Puertas, Phys. Rev. D94, 054033 (2016)
[13] K. A. Oliveet al.[Particle Data Group Collaboration], Chin. Phys. C38, 090001 (2014) [14] P. Adlarsonet al., arXiv:1509.06588 [nucl-ex]
[15] R. I. Dzhelyadinet al., Sov. J. Nucl. Phys.32, 520 (1980) [Yad. Fiz.32, 1005 (1980)] [16] T. Miyazaki and E. Takasugi, Phys. Rev. D8, 2051 (1973)
[17] F. Persson, hep-ph/0106130