913 | P a g e
Content Based Image Retrieval for Remote
Sensing Images
Patange Prajakta
1, Prof. Pallavi Deshpande
2Smt Kashibai Navale College of Engineering Pune.Maharashtra-413304, (India)
ABSTRACT
Remote sensing images have large data available. Manual data management is very difficult and time
consuming for large volume of data.For managing large data with high accuracy.We introduce Content Based
Image Retrieval (CBIR), relevance feedback can be reduces semantic gap between the low level features and
high level feature. We also implement four traditional feature descriptors, including color moment of the Hue,
Saturation and Value(HSV) of the image and RGB of the image, scale-invariant feature transform (SIFT) and
Gabor filter (GIST) descriptors are adopted as texture features. And for similarity matching is used to evaluate
the performance of Manhattan distance matric. Manhattan distance metric is faster than the SVM with more
accuracy.
Keywords- Content based image retrieval, color moment, Scale invariant feature transform, GIST, Manhattan distancematric method.
I. INTRODUCTION
Remote sensing image is a representation of part of the earth surface. It look like top view imagesbecause it seen from the space. The Remote sensing images is near the truth value of earth surfaces. Hence, remote sensing images are widely used in various fields for various applications at the present time, such as agriculture, military, Mineral exploration, fisheries, forestry, etc. Rapid development of remote sensing technology, the volume or size of remote sensing images has dramatically increased. Hence, automatic management of large volumes of remote sensing images has a problem to be solved as early.
Content based image retrieval for remote sensing images based on query images provided by the user, this technology is one of the most basic and challenging technology. Due to its application in remote sensing image management, creation of image classes is time consuming task when the volume of images explosively increases.Searching for similar images from the remote sensing image database. [1]. It need to develop a content based remote sensing image retrieval system that has easy to use and good performance.
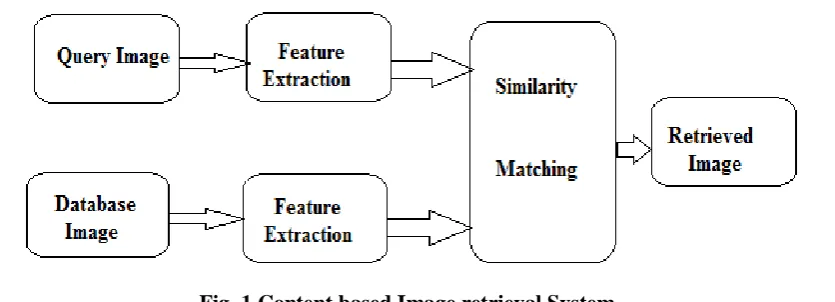
914 | P a g e Fig. 1.Content based Image retrieval System
In this paper follows the following flow structure for the content based image retrieval. Section II discusses proposed methods for image retrieval system includes feature extraction and similarity matching. Section III discusses experimental result and section IV conclusion of the study will be explained.
1.1 Objective
The main objective of this paper is given below
Manhattan take minimum time to data retrieval as compare to SVM.
Minimize the time required for data management and increase the accuracy.
II. PROPOSED METHOD
This section introduce the block diagram and the flowchart used in the CBIR system. The proposed system has been partitioned into following modules: Pre-processing, Feature extraction Module, Image Retrieval Module.
915 | P a g e 2.1 Pre-processing
Before feature extraction we applied pre-processing process on the image. Pre-processing includes image
conversion, image resize etc. Image conversion is the process to convert the one color space to another required
color space such as RGB to gray or RGB to HSV. And in the image resize we need to resize the image 256 * 256.
2.2. Feature Extraction 2.2.1. Color Moments
In the content based remote sensing images for avoiding the quantization, we use the color moment feature extraction approach. Color moments are one of the statistical moment for the probability distribution of colors. Hence,color moment have been efficiently used in image retrieval system. The mean and standard deviation have been very effective in representing color distribution [4] of images. In this project we used color feature extraction by using color moment method. This method is more robust than the others methods. We are extracting 12 color features for CBIR. We have used two features color mean, color standard deviation for RGB and HSV color channel.
Mean
The first order color moment is the Mean. It can be interpreted as the average color in the image, and it can be
calculated by using the following formula
(1)
Where,
N = the number of pixels in the image and is the value of the j-th pixel of the image at the i-thcolor channel.
Standard Deviation
The second order color moment is the standard deviation, it can be calculated by taking the square root of the variance of the color distribution.
= (2)
Where is the mean value, or first color moment, for the i-thcolor channel of the image.
2.2.2. SIFT (Scale Invariant Feature Transform)
Scale Invariant Feature Transform (SIFT) [3] isused to detect and describe the local image feature more efficiently and more accurately.
The SIFT algorithm have four main major steps: 1. Scale-space extrema detection
2. Key-point localization 3. Orientation assignment 4. Key-point descriptor.
A. Scale-space extrema detection
difference-of-916 | P a g e Gaussian function that are invariant to scale and orientation. The scale space of an image L(x, y, σ), this function is produced from the convolution of a variable-scale Gaussian G(x, y, σ), with an input image I(x, y) as shown in Eq.3 and Eq.4:
L(x,y,σ)=G(x,y,σ)∗I(x, y) (3)
Where ∗ = the convolution operation in x and y and
G(x, y, σ)= (4)
To distinguish stable keypoint area in scale space, Scale space used in Difference of Gaussian (DoG) function convolved with the image D(x, y, σ ) which can be processed from the difference of two nearby scaled images isolated by a multiplicative figure k as Eq. 5:
D(x, y, σ) = (G(x, y, k σ) - G(x, y, σ)) ∗ I(x,y)
= L(x, y, k σ) - L(x, y, σ) (5)
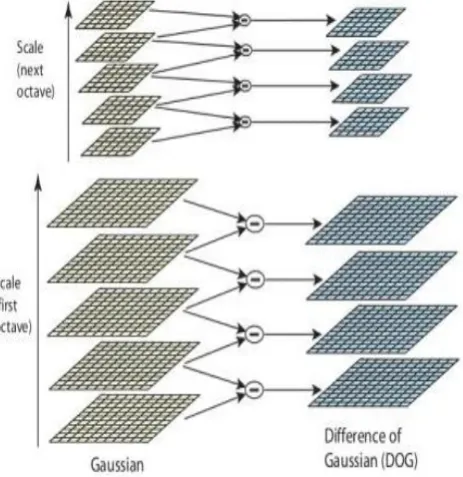
For scale space feature description this function computes a smoothed image L. D is computed by image subtraction. An example of blurred images at different scale is shown in Fig. 1. The initial image is each time convolved with Gaussian to produce the set of scale space images for every octave of scale space, as shown in fig. on the left. The DoGimages is obtained by subtracting adjacent Gaussian images shownon the right. The down-sampling of Gaussian image is done by a factor of 2 after each octave, and the process goes on.
Fig.3.Example blurred images at different scale
After the completion of the octave, the Gaussian image achievestwice the initial value of σ byas each row and column has every second pixel.
B. Keypoint localization
917 | P a g e translation. For fit determination of location, scale and contrast of every candidate location a detailed model is required. Stability measures decides the keypoints. Keypoint at the location and scale of the central sample point were simply located by Lowe [10]. For characterizing the image at each keypoint location, the smoothed image is processed to extract image gradient and orientations.
C. Orientation assignment
On the basis of local image properties each keypoint location gets one or more orientation. For every feature,the future operations are done as per the relative assigned to orientation, scale and location by providing invariance to the transformation. Using scale of the keypointthe Gaussian smoothed image L is selected, near the closest scale, as the computations are done in a scale-invariant manner. Pre-calculation of gradient magnitude m, and orientation .Ө, is done by pixel differences for each image sample, Lx, y:
m=
Ө = (6)
From the gradient orientations at all sample points within a circular window around the keypoint we get orientation histogram
D. Keypoint descriptor
As per the selected scale in the region around everykeypoint measurement of the local image gradient is done and converted into a representation that allows for local shape distortion and change in illumination. Fig.3.3 gives the illustrationfor the computation of the keypoint descriptor as described in [7]. A Gaussian weighing function with σ equal to one half the width of the feature-vector window is used for assigning a weight to the magnitude of every sample point as shown in Fig.3.2 on left side.
Fig.4. The computation of the keypoint descriptor.
918 | P a g e fig where the length of each arrow corresponds to the addition of the gradient magnitudes near that direction within the region. Adescriptor array of 2x2 is calculated from an 8x8 set of samples as shown in Fig3.3, while the experiments in [10] use 4x4 descriptors calculated from a 16x16 sample array.
2.2.3. GIST Feature Extraction
To describe the spatial structure of the image, GIST feature [2] is proposed to use a set of perceptual dimensions (naturalness, openness, roughness, expansion, and ruggedness). Firstly built a Gabor filter with fixed parametersand then filter the image and partition image into grid cells where orientation histograms are extracted. More specifically, Whereas Gabor filters are able to capture texture properties at different scales and orientations to a close-to complete degree. Consequently we adopt Gabor filters to depict the image texture information in our approach.
GIST feature is extracted in the following steps:
• Build up a series of Gabor filters with specific parameters. • Whole image is filtered and then cells segmented into grid.
• Concatenate the response of Gabor filers on each grid cells into GIST feature.
2.3 Similarity Matching A) Manhattan Distance
To find similar images to the query image from the database, the extracted feature of the query image needs to be compared with the extracted features of the images in the database. This can be done by using the distance equations such as Manhattan distance. [8]. after the color and texture feature extracted from an image, these features encoded into a feature vector. Two feature vectors, and , a distance function computes the difference between them. This difference will accurately measure the similarity between the images. The minimum distance, the high the similarity. Distance function Manhattan distance (also called as city block metric). The Manhattan distance have the following mathematical expression:
(7)
Where , are the coordinates where two pixels p1 and p2 are located. Algorithm
Training Phase: Input: Image dataset.
Step1: Different Feature extract for every image, like color moment, SIFT, GIST.
Step2: On the basis of extracted features, differentiate all these images into number of clusters. Step3: Store all feature values for matching with query image.
Testing Phase:
Step1: Accept Query image
Step 2: Extract different features of images that we have extracted at the time of Training Phase. Step3: Match query image feature with values from dataset.
919 | P a g e Flowchart
Fig. 5. Flowchart for CBIR System.
Database
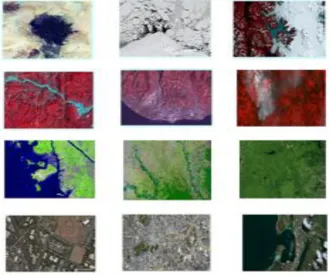
We can create our own database of 400 images. This image database is prepared of 4 different categories. The 4 different classes we used are sea, forest, hills, and city.
920 | P a g e III. EXPERIMENTAL RESULTS
The experimentation of proposed approach based on feature extraction methods and minimum distance method such as color moment, GIST, SIFT and Manhattan distance is carried out over a 400 images database. This image database is prepared of 4 different categories. The 4 different classes we used are sea, forest, hills, and city. Here, we are finding output result by using precision and recall.
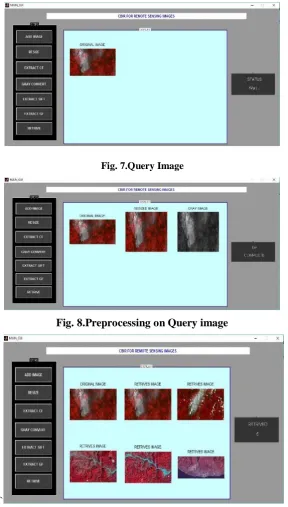
Fig. 7.Query Image
Fig. 8.Preprocessing on Query image
`
Fig. 9.Retrieved images using multiple features Precision=
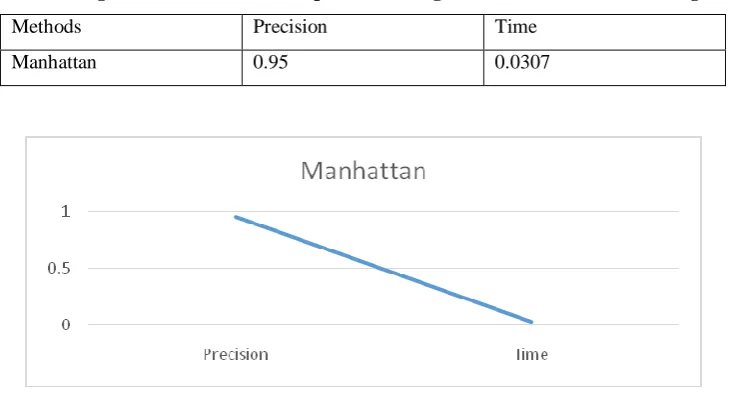
921 | P a g e Table: Average Precision and Time required for image retrieval on 4 different categories.
Methods Precision Time
Manhattan 0.95 0.0307
Fig. 10. Average Precision for Manhattan when the top 5 images are retrieval.
By using Precision and recall, we have calculated the final results of all methods. Precision is defined as the fraction of number of relevant images retrieved to total number of image retrieved. In contrast, recall measures the fraction of the number of relevant images retrieved to total number of relevant images.
IV. CONCLUSION
In this paper, we have discussed the results obtained by several feature methods such as color moment, SIFT and GIST along with Manhattan distance for remote sensing images retrieval. In this approach, Manhattan distance work faster than the SVM classifier. In the future work, we will do more research on remote sensing image classification to increase the speed up the search process and to increase the search accuracy.
V. ACKNOWLEDGMENT
I am thankful to Prof.Pallavi Deshpande for her complete support, co-operation, and support during the tenure of the project.
REFERENCES
[1] BegümDemir and Lorenzo Bruzzone, “A Novel Active Learning Method in Relevance Feedback for Content-Based Remote Sensing Image Retrieval” IEEE Transaction on geoscience and remote sensing, 0196-2892, 2014.
[2] Yi Yang and Shawn Newsam, “Comparing SIFT descriptors and Gabor texture for classification of remote sensed imagery” IEEE Electrical Engineering and Computer Science University of California Merced, CA 95344, 2008.
[3] Suraya Abu Bakar, Muhammad SuzuriHitam, Wan NuralJawahirHj Wan Yussof, “Content-Based Image Retrieval using SIFT for Binary and Greyscale Images” IEEE International Conference on Signal and
922 | P a g e [4] Fan-Hui Kong, “Image Retrieval using both color and texture features” IEEE Proceedings of the Eighth
International Conference on Machine Learning and Cybernetics, Baoding, 12-15 July 2009.
[5] M. M. Crawford, D. Tuia, H. L. Yang, “Active Learning: Any Value for Classification of Remotely Sensed Data?” Proceeding of the IEEE March 27, 2013.
[6] Yi Yang, Shawn Newsam, “Geographic Image Retrieval Using Local Invariant Features” IEEE Transaction on geoscience and remote sensing, 2012.
[7] Marin Ferecatu and NozhaBoujemaa, “Interactive Remote Sensing Image Retrieval Using Active Relevance Feedback” IEEE Transaction on geoscience and remote sensing (DRAFT).
[8] Gunjan Khosla, Dr.NavinRajpal and Jasvinder Singh, “Evaluation of Euclidean and Manhattan Metrics in Content Based Image Retrieval System” Int. Journal of Engineering Research and Applications, Vol. 4,