Volume 8, No. 5, May-June 2017
International Journal of Advanced Research in Computer Science RESEARCH PAPER
Available Online at www.ijarcs.info
ISSN No. 0976-5697
Dbscan Based Seed Initialization of K-Means Algorithm
Sameer kaul
Department of Computer Applications Islamia College of Science & Commerce
Jammu &Kashmir ,India
Abstract: This paper proposes effective approach to overcome the problem of finding initial number of clusters for Supervised Data mining algorithms. We present critical review of various approaches that finds the optimal number of clusters for clustering algorithms. In this paper we have used Dbscan algorithms to obtain initial seeds for basic k-means algorithm. To evaluate the proposed approach we have used iris data set, liver disorder dataset and seed dataset.
Keywords: Gap statistics; silhouette; jump method ;centroids; k means;euclidean distance; density reachable; Dbscan
I.INTRODUCTION
Clustering is an important tool for a variety of applications in data mining, statistical data analysis, data compression, and vector quantization. The goal of clustering is to group data into clusters such that the similarities among data members within the same cluster are maximal while similarities among data members from different clusters are minimal. Clustering algorithms can be broadly classified into hierarchical and non-hierarchical clustering algorithms. In cluster analysis, a fundamental problem is to determine the best estimate of the number of clusters, which has a deterministic effect on the clustering results. Choosing an appropriate clustering method is another critical step in clustering. K-means clustering is one of the most popular clustering techniques used in practice. K-Means algorithm is the most well known and fast method in non-hierarchical clustering algorithms. Because of the simplicity of K-means algorithm, it is used in various fields. K-Means is a partitioning clustering method that separates data into k mutually exclusives groups. Through such the iterative partitioning, k-means algorithm minimizes the sum of distance from each data to its clusters. K-Means algorithm is very popular because of its ability to cluster a kind of huge data, and also outliers, quickly and efficiently. However, K-Means algorithm is very sensitive to the designated initial starting points as cluster centers. K-Means does not guarantee unique clustering because we get different results with randomly chosen initial clusters. The final cluster centroids may not be optimal ones as algorithm can converge into local optimal solutions. Therefore it is very important for K-Means algorithm to have good initial clusters.
II.LITERATURESURVEY
Several methods have been proposed to solve the cluster initialization for K-Means algorithm like [1],[2],[3] . Some of the contributions have been discussed as under:
Reference [4] proposed the refinement algorithm that builds a set of small random sub-samples of the data, then clusters data in each sub-samples by K-Means. All centroids of all subsamples are the clustered together by K-Means using the k-centroids of each sub-sample as initial centers. The centers
phase terminates when level 0 is reached. The centers at this level are then inverse quantized to obtain the final centers. The performance of this method degrades with increasing dimensionality.
Reference [9] first calculates K Independent Components (ICs) of X and then chooses the i-th (iε 2 {1, 2,. . . ,K}) center as the point that has the least cosine distance from the i-th IC.The rest of the paper is organized as follows: In section III we present basic K-Means algorithm and DBscan algorithm. In section IV, algorithms are tested on various data sets. In section V, we present various ways for finding optimal number of clusters. Conclusion follows in section VI.
III. CLUSTERINGALGORITHMS
The proposed strategy is based on well-known k-means algorithm. However, the algorithm requires number of clusters present in the dataset as a priori information. We propose use DBScan algorithm to provide information on number of clusters present in the given dataset. K Means is a classic clustering method and is summarized below:
A. K-means algorithm
K Means is a classic clustering method that has been widely adopted in numerous engineering applications. Its popularity is supported by the simplicity of the algorithm, as well as the fast convergence rate especially in high-dimensional problems. K-Means is a method to partition a given set of N data points into K groups (called clusters) in D-dimensional Euclidean space. The partitioning in the space is based on certain similarity metrics which is usually Euclidean distance. The objective of the partitioning process is to minimize the error, generally expressed as the mean squared error (MSE), in approximating each data point with its nearest centroid.
─ Steps:
Input: k: the number of cluster D: a data set containing n objects. Output: A set of k clusters.
Method:
1.Arbitrarily choose k objects from D as initial cluster centers:
2.Repeat.
3.(re)assign each object to the cluster to which the object is the most similar, based on the mean value of the object in the cluster;
4.Update the cluster means ,i.e., calculate the mean value of the objects for each cluster;
5.Until no change. ─ Performance analysis
a) Advantages:
K-Means is a classical algorithm to resolve clustering problems simplify and quickly and it is easy to implement and understand. Better efficiency in clustering high dimensional data.
Complexity of K-Means algorithm is O(ntk) where n is the number of objects is number of iterations and k is number of clusters.
b) Disadvantages
K-Means only can be used under the situation that the average value has been defined .This may not suit some
applications, such as mobile objects clustering, data concerned about classified attributes. In K-Means algorithms user needs to specify the number of clusters that is k. It is sensitive to the initial centroids and change in initial centroids can lead to different clustering results with different initial value-Means is not fit to non-convex cluster, or big difference on size. Besides, it’s sensitive to noisy data and isolated points data, a little data like this can make huge effect on average values. In other way we can say K-Means algorithm is unable to handle noisy data and outliers.
B. DBScan Algorithm
The density based clustering algorithms are designed to discover clusters of arbitrary shape in databases with noise. A cluster is defined as a high density region partitioned by low density region in data space. DBScan is typical density based clustering algorithm. It did clustering through growing high density area, and it can find any shape of clustering. In this paper we have used DBScan algorithm as a starting step for K-means finding initial number of clusters K. After using DBScan algorithms for finding K, this k is then fed to K-Means. DBScan algorithms require two parameters: epsilon (eps) and minimum points (minpts).it starts with an arbitrary starting point that has not been visited. It then finds all the neighbor points within distance eps of the starting point. If the number of neighbors is greater than or equal to minpts, a cluster is formed. The starting point and its neighbors are added to this cluster and the starting point is marked as visited. The algorithm then repeats the evaluation process for all the neighbors’ recursively. If the number of neighbors is less than minpts, the point is marked as noise. If cluster is fully expanded (all points within reach are visited) then the algorithm proceeds to iterate through the remaining unvisited points in the dataset.
─ Steps of DBScan Algorithm 1) For each o ε D
2) If o is not yet classified then If o is a core object then
Collect all object density reachable from o and assign them to a new cluster Else
Assign o to noise
In next section we have done critical analysis of various cluster initialization techniques like: Randomly choosing initial clusters, choosing initial data points as initial clusters and user specified initialization. In user specified initialization we can use any method for finding initial number of clusters and then use it as input to K-Means algorithm e.g. : density based initialization, PCA, ROBIN, hierarchical initialization etc. In this paper we have used density based algorithm Dbscan for cluster initialization.
IV. PERFORMANCEEVALUATION
For review process we have chosen three approaches for initialization and tested it on three different databases: Iris database, seed database and liver disorder database:
3. User defined initialization(DBSCAN based)
Table 1. RANDOM INITIALIZATION FOR IRIS DATASET
No.of clusters
Cluster1 Cluster2 Cluster3 Cluster4 Cluster5
3 4 5 97 31 32 32 47 40 21 23 28 - 49 18 - - 32
Table 2. CHOOSING INITIAL DATA POINTS FOR IRIS DATASET
No.of clusters
Cluster1 Cluster2 Cluster3 Cluster4 Cluster5
3 4 5 44 35 32 56 45 41 50 44 22 - 26 27 - - 28
Table 3. USER SPECIFIED INITIALIZATION FOR IRIS DATASET
No.of clusters
Cluster1 Cluster2 Cluster3 Cluster4 Cluster5
3 4 5 66 70 22 39 38 32 45 42 30 - 26 32 - - 34
Table 4. RANDOM INITIALIZATION FOR SEED DATASET
No.of clusters
Cluster1 Cluster2 Cluster3 Cluster4 Cluster5
3 4 5 61 60 37 74 58 45 75 63 16 - 29 67 - - 32
Table 5. CHOOSING INITIAL DATA POINTS FOR SEED DATASET
No.of clusters
Cluster1 Cluster2 Cluster3 Cluster4 Cluster5
3 4 5 62 61 31 73 64 55 75 55 38 - 30 38 - - 48
Table 6. USER SPECIFIED INITIALIZATION FOR SEED DATASET
No.of clusters
Cluster1 Cluster2 Cluster3 Cluster4 Cluster5
3 4 5 55 70 25 75 62 55 80 48 36 - 30 38 - - 56
Table 7. RANDOM INITIALIZATION FOR LIVER DISORDER DATASET
No.of clusters
Cluster1 Cluster2 Cluster3 Cluster4 Cluster5
3 4 5 251 93 77 76 187 59 18 12 12 - 53 158 - - 39
Table 8. CHOOSING INITIAL POINTS FOR LIVER DISORDER DATASET
No.of clusters
Cluster1 Cluster2 Cluster3 Cluster4 Cluster5
3 4 5 76 90 61 251 53 30 18 12 11 - 190 64 - - 179
Table 8. USER SPECIFIED INITIALIZATION FOR LIVER DISORDER DATASET
No.of clusters
Cluster1 Cluster2 Cluster3 Cluster4 Cluster5
3 4 5 95 87 55 220 53 40 30 27 12 - 190 64 - - 174
V.FINDINGOPTIMALNUMBEROFCLUSTERS
Results evaluation clearly suggests that finding optimal number of clusters greatly influences the performance of clustering algorithms. There are numerous methods which have been developed to accomplish this task but very few methods have actually showed considerable results. In this section we have suggested some of the efficient methods for finding optimal number of clusters:
A. Gap Statistics
Gap statistics technique uses the output of any clustering algorithm, comparing the change in within-cluster dispersion with that expected under an appropriate reference null distribution. Simulation study shows that the gap statistics usually outperforms other methods that have been proposed in the literature. Simulation results reported by [10] indicated that the gap method is a potentially powerful approach in estimating the number of clusters for a data set. However, recent studies have shown that there are situations where the gap method may perform poorly. For example, when the data contain clusters which consist of objects from well separated exponential populations. Gap statistics works as follows:
For each i form 1 up to maximum number of clusters, 1) Run a K-means algorithm on the original dataset to find
i clusters, and sum the distance of all points from their cluster mean. Call this sum the dispersion.
2) Generate a set of reference data sets (of the same size as the original).one simple way of generating a reference dataset is to sample uniformly from the original dataset‘s bounding rectangle; a more sophisticated approach is to take into account the original dataset’s principal components.
3) Calculate the dispersion of each of these reference datasets, and take their mean.
4) Define the ith gap by: log (mean dispersion of reference datasets) - log (dispersion of original dataset).
5) Once we have calculated all the gaps, we can add confidence intervals as well and then we can select the number of clusters to be the one that gives the maximum gap, by using the formula.
Smallest K such that:
GAP(K)≥ GAP(K+1)
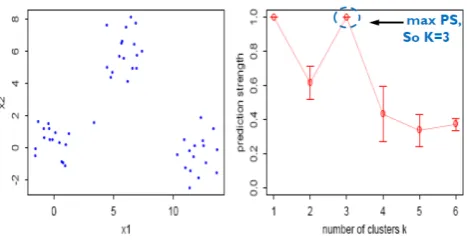
B. Prediction strength method
Prediction strength method takes a more machine learning viewpoint, since it’s formulated as a supervised learning problem validated against a test set [11]. It works as follows: To calculate prediction strength, for each i from 1 up to some maximum number of clusters:
1) Divide the dataset into two groups, a training set and a test set.
2) Run a K-means algorithm on each set to find i cluster. 3) For each test cluster, count the proportion of pairs of
points in that cluster that would remain in the same cluster, if each were assigned to its closest training cluster mean.
4) The minimum over these proportions is the prediction strength for i clusters.
[image:4.595.317.556.57.165.2]5) Once we have calculated the prediction strength for each number of clusters, we select the number of clusters to be the maximum I such that the prediction strength for i is greater than some threshold.
Fig. 2. Prediction Strength Method
C. Silhouette statistics
Silhouette refers to a method of interpretation and validation of clusters data [12]. The technique provides a succinct graphical representation of how well each object lies within its cluster.
For each pattern in class
a (i)=average distance to all other patterns in
b (i) =average distance to all other patterns in other clusters
S(i)=1- a(i)/b(i), if a(i) <b(i)
If a(i)=b(i)
b(i)/a(i)-1, if a(i)>b(i)
From the above definition: -1≤s(i)≤
Sil=1: good assignment Sil=-1: wrong assignment Sil=0: don’t know
[image:4.595.336.550.252.339.2]Mean (sil) reflects the within-cluster compactness and between-cluster separation of the resulting clusters. The best K maximizes means (sil).
Fig. 3. Silhouette Method
Apart from these there are several other techniques for finding optimal number of clusters e.g.: Jump method, Calinski and Harabasz method, Hartigan method, Krzanowski and Lai method etc. After evaluation of the performance of all of these methods we have following statistics:
Fig. 4. Evaluation Of all Methods
VI. CONCLUSION
The performance of most of the clustering algorithms greatly depends on initial cluster centers and optimal number of cluster selection. Selection of appropriate value of K and cluster center objects is a challenging issue. Lot of research has been already done on it and much more is yet to be done. The proposed techniques can help in choosing better values of K which in turn results in better clustering. In this paper we have tried to critically analyze all the technique. Results suggest that performance of a method may depend on both the clustering algorithm and the given data set. From this analysis Gap statistic method and silhouette method performed well for almost all types of data. However none of the studied methods performed well for all the data and the entire clustering algorithm.
REFERENCES
[1] K. Mumtaz et al. ,”A Novel Density based improved k-means Clustering Algorithm-Dbkmeans,” International Journal on Computer Science and Engineering,” ISSN : 0975-3397 213 Vol. 02, No. 02, 2010, 213-218.
[2] Kalpana D. Joshi et al,” Modified K-Means for Better Initial Cluster Centres,”International Journal of Computer Science and Mobile Computing Vol.2 Issue. 7, July- 2013, pg. 219-223.
[3] Riyaz, R., & Wani, M. A.,”An Efficient Framework for
Clustering Data Based on Dbscan and K-Means
Algorithms”. International Journal of Advanced Research in
Computer Science and Software Engineering,
[4] Bradley, P. S., & Fayyad, U.,” Refining initial points for k-means clustering,” In: Proc. of the 15th int. conf. on machine learning (pp. 91–99), 1998.
[image:4.595.44.278.286.407.2][5] Likas, Aristidis, Nikos Vlassis, and Jakob J. Verbeek. ,"The global k-means clustering algorithm," Pattern recognition
[6] S.S. Khan, A. Ahmad, “Cluster center initialization algorithm for K -Means clustering,” Patter Recognition Letters 25 1293– 1302, 2004.
36.2
(2003): 451-461.
[7] Su, Ting, and Jennifer G. Dy. "In search of deterministic
methods for initializing K-means and Gaussian mixture clustering," Intelligent Data Analysis
[8] Lu, J. F., Tang, J. B., Tang, Z. M., & Yang, J. Y. “Hierarchical initialization approach for k-means clustering,” Pattern Recognition Letters, 29(6), 787–795, 2008.
11.4: 319-338, 2007.
[9] Onoda, T., Sakai, M., & Yamada, S. Careful seeding method based on independent components analysis for k-means
clustering. Journal of Emerging Technologies in Web Intelligence, 4(1), 51–59, 2012.
[10] R. Tibshirani, G. Walther, and T. Hastie. “Estimating the number of data clusters via the gap statistic”. Journal of the Royal Statistical Society B, 63:411423, 2001.
[11] Tibshirani, Robert, and Guenther Walther. "Cluster validation by prediction strength." Journal of Computational and Graphical Statistics
[12] Peter J. Rousseuaw, "Silhouettes: a Graphical Aid to the Interpretation and Validation of Cluster Analysis". Computational and Applied Mathematics, 20:53– 65, 1987.