IJEDR1402183
International Journal of Engineering Development and Research (www.ijedr.org)2437
A Comparative Analysis of Wavelet Transform &
PCA Image Fusion Techniques
Rakesh Aditya Mitra Hirve
MTech. (SIT) Student Spatial Information Technology
School of Electronics, DAVV Indore (M.P.), INDIA [email protected]
________________________________________________________________________________________________________
Abstract – This paper describes the comparison between Principal Component Analysis (PCA) and Wavelet Transform image fusion technique. Many different image fusion techniques have been developed but more efficient and robust methods are needed. In remote sensing applications, the increasing availability of space borne sensors gives a motivation for different image fusion algorithms. Several situations in image processing require high spatial and high spectral resolution in a single image. Most of the available equipment is not capable of providing such data convincingly. Image fusion techniques allow the integration of different information sources. The fused image can have complementary spatial and spectral resolution characteristics. However, the standard image fusion techniques can distort the spectral information of the multispectral data while merging.
Keywords – Image Fusion, Wavelet Transform, Principal of Component Analysis
________________________________________________________________________________________________________
I. INTRODUCTION
The term fusion means in general an approach to extraction of information acquired in several domains. The goal of image fusion (IF) is to integrate complementary multisensor, multitemporal and/or multiview information into one new image containing information the quality of which cannot be achieved otherwise. The term quality, its meaning and measurement depend on the particular application.
In computer vision, Multisensor Image fusion is the process of combining relevant information from two or more images into a single image.[1] The resulting image will be more informative than any of the input images.[2] In satellite imaging, two types of images are available. The panchromatic image acquired by satellites is transmitted with the maximum resolution available and the multispectral data are transmitted with coarser resolution. This will usually be two or four times lower. At the receiver station, the panchromatic image is merged with the multispectral data to convey more information.
II. PRINCIPALCOMPONENTANALYSIS
Principal of Component Analysis
PCA is an unsupervised dimension reduction technique in which we seek an orthonormal basis function W = (w1,w2,. . . ,wd)
with d <<MN, such that each individual image can be adequately represented as a linear combination of this basis. This requires that the error obtained when the input vector a is reconstructed from its low dimensional representation
a
is minimal. We achieve this goal as follows. Given a training set of K input vectors ak, k ∈ {1,2, . . .,K}, we seek directions which have the largestvariances in the MN dimensional input space. The sub-space is reduced to a low dimension d by discarding those directions along which training vectors have a small variance.
Principal component analysis (PCA) [3] seeks an orthonormal basis function W = (w1,w2, . . . ,wd) with d << MN, such that
each individual image can be adequately represented as a linear combination of this basis. Thus in face recognition, we seek the orthonormal vectors wdwhich best account for the distribution of face images within the entire image space. These vectors define
a sub-space of face images which we call “face space”. Each of the vectors is of length MN, describes an M×N image and is a linear combination of the original face images. Because these vectors are the eigenvectors of the covariance matrix corresponding to the original face images, and because, after rearranging back into a rectangular image they are face-like in appearance, they are often referred to as “eigenfaces”.
The orthonormal vectors wi, i ∈ {1,2, . . . ,d}, are found using a set of training images as follows: Let Ak,k ∈{1,2, . . . ,K},
define a training set of face images each of size M×N. We suppose the images Ak are all spatially aligned and radiometrically
calibrated[4]. We rearrange the pixels in Akinto a column vector ak, where
ak= (ak(1)ak(2) . . .ak(MN))T .
Then, the orthonormal vectors wi, i ∈ {1,2, . . .}, are defined as the eigenvectors of the covariance matrix C, where
1
1
(
)(
)
K
T
k k
k
C
K
IJEDR1402183
International Journal of Engineering Development and Research (www.ijedr.org)2438
11
Kk k
K
a
and
Cwi =
iwiSince the column vectors ak are of length MN, then C is a MN×MN matrix. In practice MN is so huge that eigenvector
decomposition is computationally impossible. An alternative way to calculate the eigenvectors is as follows. Let X = ((a1 -
), (a2 -
), . . . , (aK -
))If viis the ith eigenvector of the matrix XTX:
XTX vi =
ivithen pre-multiplying both sides of the equation with X, we obtain
X XTX vi = CD vi =
i X viThis means that if vi is an eigenvector of the K ×K matrix XTX, then wi= Xvi is an eigenvector of the MN ×MN covariance matrix
C = XXT. This is known as the Turk-Pentland algorithm.
PCA Fusion
Most of the information in the input images Ak,k ∈ {1,2, . . . ,K}, is present in the first eigenvector w1. The first eigenvector w1 (also known as the first principal component image) may therefore be regarded as the optimal fusion of the Akinto a single image.
In general the fused image will be of less quality than any of the originals because we are only selecting the highest eigenvalue and therefore some of the structural patterns in the original images are lost. In order for PCA to be used effectively there needs to be a strong correlation between the original image data and the fused image data. An important PCA fusion technique is PCA pan-sharpening. Pan-sharpening is concerned with fusing a panchromatic image with a high spatial resolution with a multi-spectral image with a low spatial resolution.
In the traditional PCA pan-sharpening algorithm, we replace the first principal component image with the panchromatic image. The reason for this choice of component is that, by definition, the first principal component has the largest variance and therefore contains the most information. Before the first principal component is replaced by the panchromatic image, the panchromatic image is histogram matched to the first principal component image. The remaining principal components (eigenvectors) are considered to have band-specific information and are left unaltered. The inverse PCA is performed on the modified PAN image and the principal components to obtain a high-resolution pan-sharpened image.
An improved PCA pan-sharpened image may be obtained by optimally choosing which principal component to replace. We replace the principal component which has the highest correlation with the panchromatic image.
Fig. 1 Ground truth color image Fig. 2 (a) (b) Color images to be fused III. WAVELETTRANSFORM
In multi-resolution analysis (MRA) we decompose an input image I into sequence of images Il, l ∈{1,2, . . . ,L}, each of which
captures the information present in I at a given scale and orientation. Graphically, we may picture the Il arranged in a pyramid
(Fig. 3). At the bottom of the pyramid is the image I0 which is identical to the input image I. At each successive level l the image Il is recursively constructed by low pass filtering and sub-sampling the image Il-1. Given the approximation images Il we create a
sequence of detail images by interpolation of the approximation image Il and subtraction of the outcome from its predecessor Il-1.
By choosing appropriate low-pass filters we are able to select the change in resolution between the images Il. In this thesis we
shall assume dyadic MRA in which Il has double the resolution of Il+1. Formally we define MRA as the mapping
1 2
IJEDR1402183
International Journal of Engineering Development and Research (www.ijedr.org)2439
Fig 3 pyramid representation of the multi-resolution analysis of an input image
Fig. 3 Shows the pyramid representation of the multi-resolution analysis of an input image I. At the base of the pyramid is the
M ×N input image I. As we move up the pyramid, successive approximation images have an increasing coarser spatial resolution. At the lth level, the approximation image measures M/2l ×N/2l.
where ylis the detail image at level l and ILis the approximation at the coarsest resolution level L. The input image I may be
recovered by applying the inverse MRA transformation:
1
1 2
( ,
,...,
L,
L)
I
MRA
y y
y I
Discrete Wavelet Transform
A special case of MRA is the discrete wavelet transform (DWT) decomposition in which the filters are specially designed so that successive layers of the pyramid only include details which are not already available at the preceding levels. The DWT uses a cascade of special low-pass and high-pass filters and a sub-sampling operation.
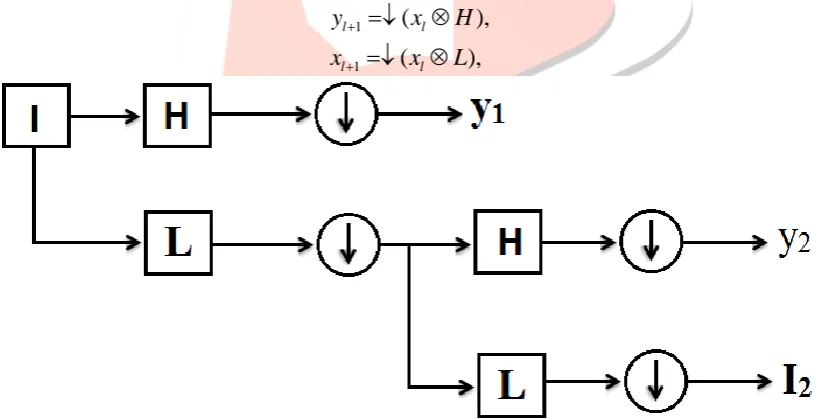
We consider the decomposition of a one-dimensional signal x. The process of applying the DWT to x can be represented as a bank of filters, as in Fig. 4. At each level of decomposition, the signal xlis split into a high-frequency component yl+1 and low-frequency component xl+1. The low-frequency component xl+1 is then further decomposed until the desired resolution is reached. Mathematically, the DWT decomposition of a one-dimensional signal xlat level l is:
1
1
(
),
(
),
l l
l l
y
x
H
x
x
L
Fig. 4 a two-level one-dimensional discrete wavelet transform
Fig. 4 shows a two-level one-dimensional discrete wavelet transform. Input is a one –dimensional signal I. L and H denote, respectively, the low and high pass filters. ↓ denotes the operation of down-sampling by a factor of two. yl and Il are, respectively,
the detail and approximate signals at the lth decomposition level.
where ↓ (xl ⊗H) and ↓ (xl ⊗L) denote, respectively, the convolution of xlwith the high-pass and low-pass filters H and L
followed by sub-sampling the result by a factor of two.
The above procedure can be easily extended to a two-dimensional image as follows: Given a M×N input image I we generate two(M/2)×N images, IL and IH, by separately filtering and down-sampling the rows in I using a low-pass filter L and a high-pass
filter H. We repeat the process by filtering and down-sampling the columns in IL and IH using the filters L and H. The output is
four (M/2)×(N/2) images ILL, ILH, IHL and IHH, where ILL is a low-frequency approximation of I, and ILH, IHL and IHH are
IJEDR1402183
International Journal of Engineering Development and Research (www.ijedr.org)2440
Fig 5 M×N input image I
Fig. 5 Shows a M×N input image I decomposed into three (M/2)×(N/2) detail images ILH, IHLand IHHand one (M/2)×(N/2)
approximation image ILL. The image ILLis further decomposed into three (M/4)×(N/4) detail images
I
LH
,
I
HLandI
HHand one (M/4)×(N/4) approximation imageI
LL.Wavelet Fusion
The basic idea of wavelet fusion is as follows: Given a set of input images I(k) we decompose them into L detail images
( ) ( ) ( )
1
,
2,...,
k k k
L
y
y
y
and a single residual (approximation) imageI
L( )k :(1) (2) ( ) ( )
2
(
y
k,
y
,...,
y
Lk,
I
Lk)
UDWT I
( )
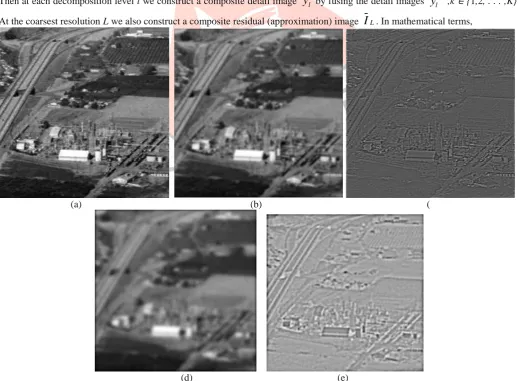
Then at each decomposition level l we construct a composite detail image
y
l by fusing the detail imagesy
l( )k ,k ∈ {1,2, . . . ,K}. At the coarsest resolution L we also construct a composite residual (approximation) imageI
L. In mathematical terms,
(a) (b) (
(d) (e)
IJEDR1402183
International Journal of Engineering Development and Research (www.ijedr.org)2441
(1) (2) ( )
(1) (2) ( )
(
,
,...,
),
(
,
,...,
),
k
l l l l
l
k
L L L L
y
f y
y
y
I
g I
I
I
where fl and g are appropriate fusion operators.
Given the composite detail images
y
l , l ∈ {1,2, . . . ,L}, and the composite residual (approximation) imageI
L, we obtain thefused image I by applying the inverse UDWT transformation to
( ,
y y
1 2,...,
y
L,
I
L)
:1
1 2
(
,
,...,
L,
L)
I
UDWT
y y
y
I
This scheme was used to fuse together an electro-optical image and an infrared image with the same spatial resolution.
IV. CONCLUSION
This paper has attempted to evaluate the performance of different image fusion techniques and algorithms, including Wavelet Transform and Principal of Component Analysis (PCA). Although selection of fusion algorithm is problem dependent but this review results that spatial domain provide high spatial resolution. But spatial domain have image blurring problem. The Wavelet transforms is the very good technique for the image fusion provide a high quality spectral content. But a good fused image have both quality so the combination of DWT & spatial domain fusion method (like PCA) fusion algorithm improves the performance as compared to use of individual DWT and PCA algorithm. Finally this review concludes that a image fusion algorithm based on combination of DWT and PCA with morphological processing will improve the image fusion quality and may be the future trend of research regarding image fusion.
V. ACKNOWLEDGEMENT
It gives me a great pleasure to thank Dr. Jyoti Sarup, Associate Professor in Dept. of Civil Engineering, MANIT Bhopal for encouragement. I am thankful to Dr. Raj Kamal, Dr. Abhay Kumar and Mrs. Pratibha M. Umale for permitting me to carry out Project in MANIT Bhopal.
REFERENCES
[1] Haghighat, M. B. A., Aghagolzadeh, A., & Seyedarabi, H., “Multi-focus image fusion for visual sensor networks in DCT domain”, Computers & Electrical Engineering Volume 37, Issue 5, Pages 789–797, September 2011.
[2] Haghighat, M. B. A., Aghagolzadeh, A., & Seyedarabi, H., “A non-reference image fusion metric based on mutual information of image features”, Computers & Electrical Engineering Volume 37, Issue 5, Pages 744–756, September 2011.
[3] Jolliffe, I.T.: Principal Component Analysis, 2nd edn. Springer, Heidelberg (2002).
[4] Belhumer, P.N., Hespanha, J.P., Kriegman, D.J.: Eigenfaces vs. Fisherfaces: recognition using class specific linear projection. IEEE Trans. Patt. Anal. Mach. Intell. 19(9), 711–720 (1997).
[5] Mitchell, H.B.: Image Fusion Theories, Techniques and Applications, Springer, Heidelberg (2010). [6] Harrison, S.: Standardized principal component analysis. Int. J. Remote Sens. 6, 883–890 (1985).
[7] Eklundh, L., Singh, A.: A comparative analysis of standardized and unstandardized principal component analysis in remote sensing. Int. J. Remote Sens. 14, 1359–1370 (1993).
[8] Park,M.S., Na, J.H., Choi, J.Y.: Feature extraction using class-augmented principal component analysis (CA-PCA). In: Kollias, S.D., Stafylopatis, A., Duch, W., Oja, E. (eds.) ICANN 2006. LNCS, vol. 4132, pp. 606–615. Springer, Heidelberg (2006).
[9] Park, M.S., Choi, J.Y.: Theoretical analysis on feature extraction capability of class augmented PCA. Patt. Recogn. 42, 2353–2360 (2009).
[10] VPS Naidu, “Discrete Cosine Transform-based Image Fusion”, Special Issue on Mobile Intelligent Autonomous System, Defence Science Journal, Vol. 60, No.1, pp.48-54, Jan. 2010.
[11] N. Ahmed, T. Natarajan and K.R.Rao, “Discrete Cosine Transform”, IEEE Trans. On Computers, Vol.32, pp.90-93, 1974.
[12] VPS Naidu and J.R. Raol, ”Pixel-Level Image Fusion using Wavelets and Principal Component Analysis – A Comparative Analysis” Defence Science Journal, Vol.58, No.3, pp.338-352, May 2008.
[13] Shutao Li, James T. Kwok and Yaonan Wang, “Combination of images with diverse focuses using the spatial frequency”, Information fusion, 2(3), pp.167-176, 2001.
[14] Zhijun Wang, Djemel Ziou, Costas Armenakis, Deren Li, and Qingquan Li, “A Comparative Analysis of Image Fusion Methods”, IEEE TRANSACTIONS ON GEOSCIENCE AND REMOTE SENSING, VOL. 43, NO. 6, JUNE 2005. [15] V.P.S. Naidu and J.R. Raol,” Pixel-level Image Fusion using Wavelets and Principal Component Analysis”, Defence
Science Journal, Vol. 58, No. 3, May 2008.
[16] Al-Wassai Firouz Abdullah, Al-Zuky Ali A, Kalyankar N.V. (2011), „The IHS Transformations Based Image Fusion‟, International Journal of Advanced Research in Computer Science,Volume 2, No. 5.
[17] Allah Osama S. Farag, El-Rabaie S., Metwalli Mohamed R. and Nasr Ayman H. (2009), „Image Fusion Based on Principal Component Analysis and High-Pass Filter‟ 978-1-4244-5844-8/09/$26.00 ©2009 IEEE.