Scholarship@Western
Scholarship@Western
Electronic Thesis and Dissertation Repository
6-26-2017 12:00 AM
Design and Implementation of Smart Sensors with Capabilities of
Design and Implementation of Smart Sensors with Capabilities of
Process Fault Detection and Variable Prediction
Process Fault Detection and Variable Prediction
An He
The University of Western Ontario
Supervisor Dr. Jin Jiang
The University of Western Ontario
Graduate Program in Electrical and Computer Engineering
A thesis submitted in partial fulfillment of the requirements for the degree in Master of Engineering Science
© An He 2017
Follow this and additional works at: https://ir.lib.uwo.ca/etd
Part of the Controls and Control Theory Commons, Electrical and Electronics Commons, and the Process Control and Systems Commons
Recommended Citation Recommended Citation
He, An, "Design and Implementation of Smart Sensors with Capabilities of Process Fault Detection and Variable Prediction" (2017). Electronic Thesis and Dissertation Repository. 4687.
https://ir.lib.uwo.ca/etd/4687
This Dissertation/Thesis is brought to you for free and open access by Scholarship@Western. It has been accepted for inclusion in Electronic Thesis and Dissertation Repository by an authorized administrator of
Abstract
A typical sensor consists of a sensing element and a transmitter. The major functions of a transmitter are limited to data acquisition and communication. The recently developed transmitters with ‘smart’ functions have been focused on easy setup/maintenance of the transmitter itself such as self-calibration and self-configuration. Recognizing the growing computational capabilities of microcontroller units (MCUs) used in these transmitters and underutilized computational resources, this thesis investigates the feasibility of adding additional functionalities to a transmitter to make it ‘smart’ without modifying its foot-print, nor adding supplementary hardware. Hence, a smart sensor is defined as sensing elements combined with a smart transmitter. The added functionalities enhance a smart sensor with respect to performing process fault detection and variable prediction.
This thesis starts with literature review to identify the state-of-the-arts in this field and also determine potential industry needs for the added functionalities. Particular attentions have been paid to an existing commercial temperature transmitter named NCS-TT105 from Microcyber Corporation. Detailed examination has been made in its internal hardware architecture, software execution environment, and additional computational resources available for accommodating additional functions. Furthermore, the schemes of the algorithms for realizing process fault detection and variable prediction have been examined from both theoretical and feasibility perspectives to incorporate onboard NCS-TT105. An important body of the thesis is to implement additional functions in the MCUs of NCS-TT105 by allocating real-time execution of different tasks with assigned priorities in the real-time operating system (RTOS). The enhanced NCS-TT105 has gone through extensive evaluation on a physical process control test facility under various normal/fault conditions. The test results are satisfactory and design specifications have been achieved. To the best knowledge of the author, this is the first time that process fault detection and variable prediction have been implemented right onboard of a commercial transmitter. The enhanced smart transmitter is capable of providing the information of incipient faults in the process and future changes of critical process variables. It is believed that this is an initial step towards the realization of distributed intelligence in process control, where important decisions regarding the process can be made at a sensor level.
Acknowledgments
I would like to express my sincere gratitude to my supervisor, Dr. Jin Jiang, for his motivation, expertise, immense knowledge, patience, and dedication. His guidance and inspiration helped me in the research and methods of studying. It was a grateful journey to learn from him and improve myself. I would further like to thank Dr. Xinhong Huang for her insightful guidance, encouragement, commitment and friendship. Without her support, this thesis would never have reached this stage.
I also feel very grateful to Dr. Vijay Parsa, Dr. Lyndon Brown, and Dr. Ahmed Hussein for their valuable courses. Leveraging the knowledge I learned from the course, I was able to realize my research and made rapid progress in my study.
I would also like to thank Dr. Mehrdad R. Kermani, Dr. Ilia Polushin, and Dr. Rajni Patel for letting me auditing their courses. The crossed knowledge broadened my views and inspired my ideas.
I have deep gratitude to thank the Natural Sciences and Engineering Research Council of Canada (NSERC), and University Network of Excellence in Nuclear Engineering (UNENE) for providing financial support throughout my graduate program.
I would also like to thank the generous support of transmitter implementation platform from Microcyber Corporation. I would also like to acknowledge the cooperation and technical support from Dr. Hong Wang, Mr. Jianwei Wei, Mr. Dekui Ning, and Mr. Zuye Yang from Microcyber Corporation; and Dr. Aidong Xu from Shenyang Institute of Automation Chinese Academy of Sciences. Without their support, I would not have achieved the accomplishment on practical application.
I feel very lucky that I have a wonderful research team. I am grateful to my colleague, Dr. Sungwhan Cho for his expertise and research suggestions; Dr. Ataul Bari for giving generously of his time offering help in the lab; Dr. Drew J. Rankin, Dr. Dennis Michaelson, Xirong Ning, and Syed Ahmed Raza for advices, discussions, and conversations.
This thesis is dedicated to my parents
for their love, endless support,
Table of Contents
Abstract ... ii
Acknowledgments ... iii
Table of Contents ...v
List of Tables... ix
List of Figures ... xi
List of Abbreviations ...xiv
Nomenclature ... xviii
Chapter 1 ...1
1 Introduction ...1
1.1 Overview of Industrial Smart Sensors ...2
1.1.1 Brief Review of Industrial Sensors ...2
1.1.2 Composition of Smart Transmitter ...4
1.2 Shortcomings of Existing Smart Sensors and Potential Solutions ...6
1.2.1 Shortcomings of Existing Smart Transmitters ...6
1.2.2 A New Generation of Smart Sensors...7
1.2.3 Potential Solutions through Integrating Data Analysis ...7
1.3 Research Objectives, Methodologies, and Scope ...9
1.3.1 Objectives ...9
1.3.2 Methodologies ...9
1.3.3 Scope ... 10
1.4 Contributions of the Thesis ... 11
1.5 Organization of the Thesis ... 11
Chapter 2 ... 13
2.1 Review of Existing Smart Sensors ... 13
2.2 Existing Fault Detection Techniques ... 15
2.2.1 Classification of Fault Detection Methods ... 16
2.2.2 Residual Generation by Model-based Methods ... 18
2.2.3 Residual Evaluation for Fault Detection... 20
2.3 Existing Techniques for Prediction of System Responses ... 21
2.3.1 Models with and without Exogenous Variables... 21
2.3.2 Model-based Prediction Methods ... 24
2.4 Real-time Operating Systems in Transmitters ... 28
2.5 Summary ... 29
Chapter 3 ... 30
3 Introduction of a Platform for Smart Sensor Implementation ... 30
3.1 Functionalities of NCS-TT105 ... 30
3.2 Hardware and Software ... 31
3.2.1 Hardware ... 31
3.2.2 Software ... 34
3.3 Standards of Compliance and Specifications of the Platform ... 35
3.3.1 Standards followed by NCS-TT105 ... 35
3.3.2 Specifications of NCS-TT105 ... 38
3.4 Summary ... 39
Chapter 4 ... 40
4 Investigation of the Algorithms for Smart Functions ... 40
4.1 Goals and Specifications ... 40
4.1.1 Process Fault Detection Smart Function... 40
4.2 Algorithms for Process Fault Detection ... 43
4.2.1 ARX and EWRLS for Residual Generation ... 43
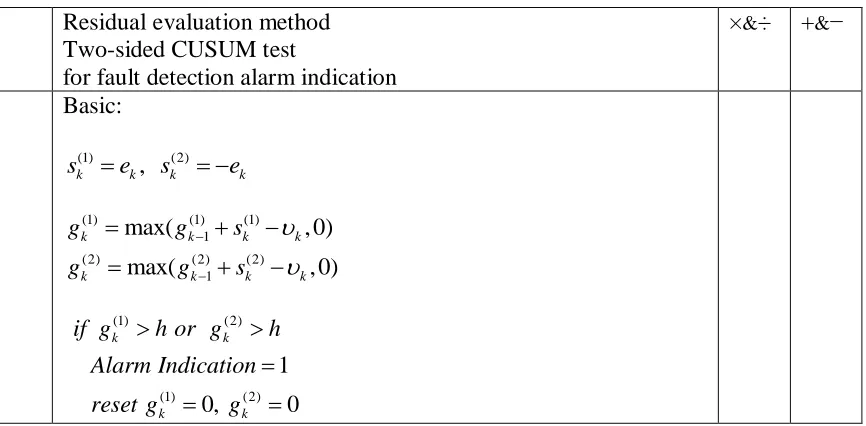
4.2.2 CUSUM for Residual Evaluation ... 48
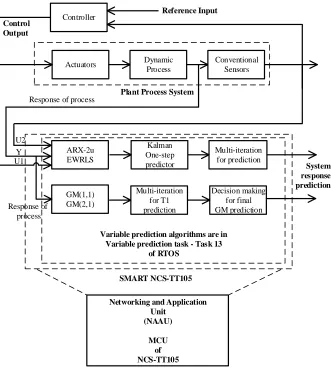
4.3 Algorithms for Variable Prediction ... 52
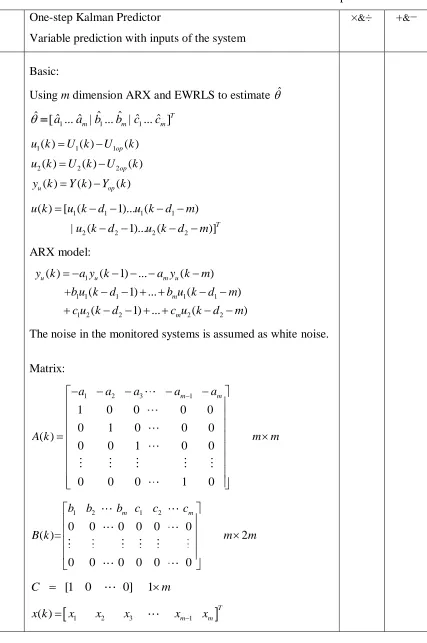
4.3.1 Kalman Predictor Prediction ... 52
4.3.2 Grey Model Prediction ... 55
4.4 Summary ... 64
Chapter 5 ... 65
5 Implementation of Smart Functions in Real-time Operating System ... 65
5.1 The Process Fault Detection Task ... 65
5.1.1 EWRLS for Residual Generation ... 66
5.1.2 CUSUM for Residual Evaluation ... 69
5.2 The Variable Prediction Task ... 72
5.2.1 Kalman Predictor ... 73
5.2.2 Grey Model ... 78
5.3 The Bidirectional Communication Task ... 84
5.4 Implementation of Multitasking in the Real-time Operating System ... 86
5.4.1 Configuration of Multitasking Scheduling with RMS Rules ... 87
5.4.2 Implementation of Three Tasks in Nucleus RTOS ... 92
5.5 Instructions of using the Designed Smart Sensor ... 96
5.6 Summary ... 100
Chapter 6 ... 102
6 Verification and Validation of the Smart Sensor ... 102
6.1 Introduction to the Test Environment ... 102
6.1.2 Introduction of the DCS Systems ... 104
6.2 Verification to Communication Channels in Smart Sensors ... 107
6.3 Offline Validation of Smart Functions in MATLAB... 109
6.3.1 Process Fault Detection ... 110
6.3.2 Variable Prediction ... 116
6.4 Online Validation ... 125
6.4.1 Multitasking in RTOS ... 126
6.4.2 Process Fault Detection ... 129
6.4.3 Variable Prediction ... 138
6.5 Summary of the Designed Smart Sensor... 146
6.6 Summary ... 147
Chapter 7 ... 148
7 Summary and Conclusions ... 148
7.1 Summary ... 148
7.2 Conclusions ... 149
7.3 Future Works ... 150
References ... 152
Appendices ... 160
Appendix A: Standards for Sensing in NCS-TT105 ... 160
Appendix B: Introduction of PROFIBUS-PA ... 162
Appendix C: Introduction of Nucleus RTOS ... 166
List of Tables
Table 2.1: Classification of Fault Detection Methods [54][55] ... 16
Table 3.1: NCS-TT105 Basic Technical Specifications [94] ... 38
Table 3.2: RTD and TC Specifications of NCS-TT105 [94] ... 39
Table 4.1: Specifications of Process Fault Detection Smart Function ... 41
Table 4.2: Specifications of Variable Prediction Smart function... 43
Table 4.3: Matrix Dimension List of Kalman Predictor ... 54
Table 4.4: Algorithms Summary of Process Fault Detection and Variable Prediction ... 64
Table 5.1: The procedure of EWRLS Parameter Estimation for Residual Generation ... 68
Table 5.2: The Procedure of Two-sided CUSUM for Residual Evaluation ... 70
Table 5.3: The Procedure of the Kalman Predictor and Multistep Iteration ... 75
Table 5.4: The Procedure of Grey Model Prediction ... 78
Table 5.5: List of Communication Interface of PROFIBUS-PA in NCS-TT105 ... 85
Table 5.6: Three Tasks for Integration in RTOS ... 93
Table 5.7: Implementation Summary of Three Tasks ... 96
Table 5.8 The Summary of Setting for Process Fault Detection Function ... 97
Table 5.9 The Summary of Setting for Variable Prediction Function ... 98
Table 6.1: Essential Equipment in Primary Water Loop Subsystem of the NPCTF... 104
Table 6.2: Four Essential Variables for the Algorithms in SMART NCS-TT105 ... 107
Table 6.4: Result of Offline Validation of Fault Detection Test... 116
Table 6.5: Scenarios of Offline Variable Prediction Test ... 116
Table 6.6: Comparison of Prediction by Grey Model and Combined Method ... 120
Table 6.7: Validation Results of Offline Prediction Test ... 124
Table 6.8: Validation Results of Execution Time of Three Tasks ... 128
Table 6.9: Validation Results of Period Time of Three Tasks ... 128
Table 6.10: Simulated Faults in Primary Water Loop System for Online Validation .... 130
Table 6.11: Online Validation Results of Fault Detection Test ... 138
Table 6.12: Scenarios of Online Variable Prediction Test ... 140
Table 6.13: Online Validation Results of Prediction Test ... 145
Table 6.14: Performance of Designed Smart Functions in the Smart Sensor ... 146
Table 6.15: Summary of V&V Test ... 147
Table B.1: The Specifications of PROFIBUS-PA [100] ... 163
Table C.1: Execution Time and Period Time of Tasks in Scenario-1 ... 167
Table C.2: Analysis of Three Tasks in Scenario-1 ... 169
Table C.3: Execution Time and Period Time of Tasks in Scenario-2 ... 169
List of Figures
Figure 1.1: Overview of a Typical Industrial Sensor and Smart Sensor ...2
Figure 1.2: Siemens SITRAN TF Functions Diagram [12] ...3
Figure 1.3: Smart Transmitter Architecture ...4
Figure 2.1: Model-based Fault Detection Framework [52] ... 17
Figure 2.2: Illustration of a Prediction with Known Inputs [70] ... 22
Figure 2.3: Illustration of a Prediction with Unknown Inputs [70] ... 22
Figure 2.4: Diagram of Grey Model and ARX Model for Prediction ... 26
Figure 2.5: One-step Prediction Using Kalman Filter [51] ... 27
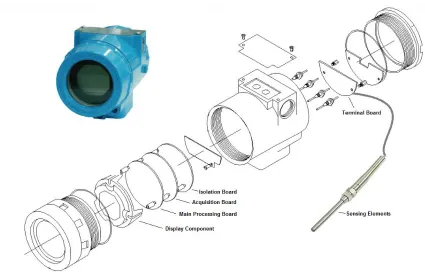
Figure 3.1: Assembly Structure of NCS-TT105 with a Sensing Element [94]... 31
Figure 3.2: Schematic Diagram of a NCS-TT105 Sensor [94] ... 32
Figure 3.3: A Typical PROFIBUS-PA Architecture [99]... 36
Figure 3.4: Block Structure of a PA devices Profile [100] ... 37
Figure 4.1: Parameter Estimation using ARX Model and EWRLS [51] ... 44
Figure 4.2: Relationship of Raw Data and Prediction in Grey Model ... 62
Figure 5.1: Implementation of Process Fault Detection in RTOS on NCS-TT105 ... 66
Figure 5.2: Implementation of Variable Prediction in RTOS on NCS-TT105 ... 73
Figure 5.3: Multitasking Implementation of Three Tasks in Nucleus RTOS ... 87
Figure 5.4: Timing Terminologies of a Task in an RTOS System ... 89
Figure 5.6: Program Context Refer to NU_Sleep() and Kernel Tick ... 95
Figure 5.7: Overview of the Multitasking Implementation in Nucleus RTOS ... 101
Figure 6.1: Primary Water Loop Subsystem of the NPCTF ... 103
Figure 6.2: DigiVis HMI Graphic of NPCTF System ... 105
Figure 6.3: Schematic Diagram of Validation System for SMART NCS-TT105 ... 106
Figure 6.4: Verification of Communication Channels of SMART NCS-TT105 ... 109
Figure 6.5: Diagram of Smart Functions Offline Validation ... 110
Figure 6.6: Overview of Variables in MATLAB for Fault Detection Validation... 112
Figure 6.7: Residual Generation and Evaluation for Fault Alarm ... 115
Figure 6.8: Overview of the Process Changes for Prediction Validation ... 118
Figure 6.9: Offline T1 Prediction by the Grey Model Prediction ... 120
Figure 6.10: Offline (T2-T1) Prediction by Kalman Predictor and Multi-step Iteration 122 Figure 6.11: Offline T2 Prediction Validation for Combined Prediction ... 123
Figure 6.12: Offline T2 Prediction Validation for Combined Shifted Prediction ... 124
Figure 6.13: Diagram of Smart Functions Online Validation ... 126
Figure 6.14: The Method of Computing Execution Time of a Task ... 127
Figure 6.15: The Method of Computing Period Time of Three Tasks ... 127
Figure 6.16: Validation of Process Fault Detection in SMART NCS-TT105 ... 129
Figure 6.17: Validation Picture of Fault Detection Graphic in WinCC ... 130
Figure 6.19: Fault Detection Validation of Cooling System Fault ... 132
Figure 6.20: Fault Detection Validation of Pipeline Plug Fault ... 133
Figure 6.21: Fault Detection Validation of F1 Loss Fault ... 134
Figure 6.22: Fault Detection Validation of T1 Loss Fault ... 135
Figure 6.23: Fault Detection Validation of Pipeline Leak Fault ... 136
Figure 6.24: Effects of Alarm Indication by CUSUM ... 137
Figure 6.25: Validation of Variable Prediction in SMART NCS-TT105 ... 139
Figure 6.26: Validation Picture of Prediction Graphic in WinCC ... 140
Figure 6.27: T2 Prediction Validation with the Changes of Flow Rate F1 ... 141
Figure 6.28: T2 Prediction Validation with the Changes of Heater Control Signal C2 .. 142
Figure 6.29: T2 Prediction Validation with Heater Shutdown ... 143
Figure 6.30: T2 Prediction Validation with Chiller Shutdown ... 145
Figure B.1: Block Structure of a PA devices Profile [101] ... 164
Figure B.2: Internal Diagram of a Temperature Transducer Block [102] ... 165
Figure B.3: Internal Diagram of an Analog Input Function Block [102] ... 165
Figure C.1: Task Flow of Multitasking Scheduling in Scenario-1………..168
List of Abbreviations
AR Auto Regressive
ARMA Autoregressive Moving Average
ARIMA Autoregressive Integrated Moving Average
ARX Auto-Regression with Exogenous Inputs
ARMAX Auto Regressive Moving Average with Exogenous Inputs
ADC Analog-to-Digital Converter
AGO Accumulating Generator
ATC Auto Target Compensation
APU Application Processing Unit
BCU Bidirectional Communication Unit
CUSUM Cumulative Sum
DCS Distributed Control System
DSP Digital Signal Processor
EWRLS Exponentially Weighted Recursive Least Squares
ELS Extended Least Squares
EMF Electromotive Force
FB Function Block
FFT Fast Fourier Transform
GCD Greatest Common Divisor
GLR Generalized Likelihood Ratio
GM Grey Model
IAGO Inverse Accumulating Generator
IC Integrated Circuit
IIoT Industrial Internet of Things
ISP Intelligent Signal Processing
ISR Interrupt Service Routine
IWSN Industrial Wireless Sensor Network
LS Least Squares
LPWAN Low-Power Wide-Area Network
MAPE Mean Absolute Percentage Error
MBP Manchester Encoded and Bus Powered
MCU Microcontroller Unit
MEMS Micro-Electro-Mechanical System
NCS-TT105 Transmitter using as the implementation platform
NPCTF Nuclear Power Control Test Facility
PB Physical Block
PCA Principal Component Analysis
PROFIBUS-PA An Industrial Fieldbus Technology
PSD Power Spectral Density
PLS Partial Least Square
PNO PROFIBUS Nutzerorganisation
RDE Riccati Difference Equation
RTD Resistance Temperature Detector
RTOS Real-Time Operating System
RLS Recursive Least Squares
RMS Rate Monotonic Scheduling
SEU Sensing Elements Unit
SJF Shortest Job First
SMART NCS-TT105 NCS-TT105 with Smart Functions
SoC System-on-Chip
SPRT Sequential Probability Ratio Test
SPU Signal Processing Unit
SRT Shortest Response Time
STM Statistical Process Monitoring
TB Transducer Block
TC Thermocouple
V&V Verification and Validation
WPAN Wireless Personal Area Networks
Nomenclature
y Measured system output
ˆ
y Estimated system output
r Residual between the measured output and estimated output
m
a Parameters of system responses in ARX and ARMAX model
m
b Parameters of system inputs in ARX and ARMAX model
m
c Parameters of second inputs in ARX or noise in ARMAX model
p The steps of prediction
p
y The redicted response variable
t
R Resistance at the temperature t.
0
R Resistance at the temperature t0C
U Input of the system used in ARX model
Y Output of the system used in ARX model
op
U Input value U k( ) on operating point value
op
Y Output value ( )Y k on operating point value
u The system inputs eliminated with operating point value
u
y The system response eliminated with operating point value
S
d Discrete dead-time of the process variables
avg
Exponential forgetting factor for computing average value
var
Exponential forgetting factor for computing variance value
1st
T Time constant of the first order system
ˆ
Estimated parameter vector
T
Data vector including y ku( )and ( )u k
w
P Inverse correlation matrix of EWRLS
w
Exponential forgetting factor of EWRLS
I Identity matrix
m Orders of EWRLS
e Residual of EWRLS
r Residual for the inputs of two-sided CUSUM
Drift threshold of two-sided CUSUM
h Alarm threshold of two-sided CUSUM
(1)
g Positive cumulation of two-sided CUSUM
(2)
g Negative cumulation of two-sided CUSUM
v
K Ratio parameters for dynamic drift threshold
h
x Signal value, state in state-space equations ˆ
Estimated mean value
2
s Sample variance
e
Exponential forgetting factor for recursively computing mean and
sample variance
k Discrete time index
A Process matrix of State-space matrix
B Control matrix of State-space matrix
C Measurement matrix of State-space matrix
z
Sensor measurements in state-space equations
w Process noise in state-space equations
v Measurement noise in state-space equations
Q Process noise covariance
R Measurement noise covariance
P Covariance matrices of the estimation error in Kalman predictor
K Kalman filter gain
KP
P The steps of prediction via Kalman predictor and multi-step
iteration
KF
M The dimension of Kalman predictor
KP1st
(0)
x Raw data in grey model
(0)
X A sequence of the raw data
(1)
x The value calculated by the first-order accumulating generator
(1)
X A sequence of the first-order accumulating generator
(1) (0)
x
The value calculated by the first-order inverse accumulating
generator
(1) (0)
X
A sequence of the first-order inverse accumulating generator
(1)
Z Adjacent neighbor means of the sequence
n The length of sequence in grey model
11 ˆ
GM
Parameters of grey model GM(1,1)
21 ˆ
GM
Parameters of grey model GM(2,1)
(0) ˆ
x Restored value of grey model
(0) ˆp
x Predicted value of grey model
(0) p
X Prediction sequence of grey model
( ) dco k
Development coefficient of grey model GM(1,1)
GM
W Weight value of combined prediction of GM(1,1) and GM(2,1)
11
G
M The length of GM(1,1)
21
G
KPp
Y The prediction via Kalman predictor and multi-step iteration
GM
P The steps of prediction via grey model
(0) 11 ˆGM p
x Predicted value of GM(1,1)
(0) 21 ˆGM p
x Predicted value of GM(2,1)
(0) ˆGMComp
x Predicted value of weighted between the prediction from GM(1,1)
and GM(2,1)
e
T Execution time of a task in RTOS
p
T Period time of a task in RTOS
r
T Response time of a task in RTOS
d
T Deadline of a task in RTOS
int
T Serving interrupts time of a task in RTOS
ever
T Event response time of a task in RTOS
Tick
T Kernel tick time of RTOS
Tick
N Number of kernel ticks
WL Microprocessor workload for running tasks
1
T Water temperature at inlet of the heater
2
T Water temperature at outlet of the heater
T
C2 Control signal for the current power to the heater
Chapter 1
1
Introduction
It is well known that sensors are the essential devices in condition monitoring and control systems. A typical sensor consists of a sensing element and a transmitter. Nowadays, advanced functionalities are embedded into the transmitters which are combined with signal processing unit, data computing unit and communication unit, enabling the transmitters to be smart transmitters. Therefore, the sensing elements and a smart transmitter are combined as known a ‘smart sensor’ [1][2]. The major functions of
mainstream smart sensors mostly focus on accurately measuring data and transmitting the measurement via network.
In industrial applications, data analysis functions in condition monitoring systems are often performed and are in the form of central monitoring stations in large plants such as power plants, chemical plants, and petrol plants [3][4]. These functions can collect interactive data to provide valuable information of equipment health status [5]. However, many small to medium sized systems such as standalone machinery systems often lack of conditions and funds to apply such large and costly central monitoring systems [5]. Therefore, it is imperative that such useful functions to be decentralized into field devices to achieve cost-effective and easy-to-use data analysis functions for serving unit systems.
1.1
Overview of Industrial Smart Sensors
1.1.1 Brief Review of Industrial Sensors
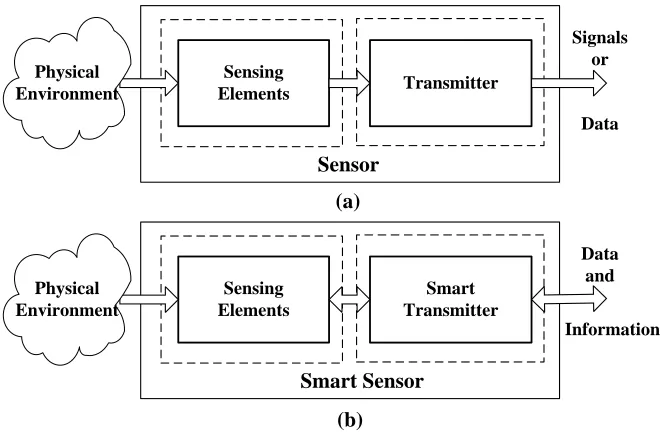
Sensor is an electronic device for resonding stimulus from physcial environment and transferring stimulus into signals or data [7][8]. A typical industrial sensor consisits of two parts: a sensing element and transmitter, which is shown in Figure 1.1 (a). The sensing element is used for sensing the physical enviroment, while the transmitter is used for signal conversion, filtering, and trasmitting the signals or data to orther systems. In comparison, a smart sensor is combined with sensing elements and a smart transmitter, which is shown in Figure 1.1 (b).
Signals or
Data Sensing
Elements Transmitter
Physical Environment
Sensor
Data and
Information Sensing
Elements
Smart Transmitter Physical
Environment
Smart Sensor (a)
(b)
Figure 1.1: Overview of a Typical Industrial Sensor and Smart Sensor
Figure 1.2: Siemens SITRAN TF Functions Diagram [12]
Mainstream smart transmitter in industrial verticals are mostly designed to focus on features including accurate measurement, self-diagnostic such as sensing elements break or short-circuit, self-calibration, self-configuration, and wired or wireless
communications [13][14][15]. Some well-known brands are Rosemount, Siemens, Honeywell, Endress+Hauser, KROHN, and Yokogawa. For instance, Siemens SITRANS TF [12] series sensors offer high-accuracy measurement with less than 0.05 % absolute accuracy, as well as self-diagnostic, linearization, calibration functions, and Profibus-PA and Foundation Fieldbus communication. Honeywell SmartLine ST800 pressure sensors can provide up to 0.0375% accuracy for static pressure measurement through internal temperature compensation [16]. As shown above, the essential features of mainstream industrial smart transmitters are high-accuracy measurement, easy set-up and
maintenance, and communication.
With the technological advances and pull of application demands, innovative transmitters with on-board signal processing and data analysis functions have emerged in recent years [17]. One pioneer in this field is the OPTISWIRL 4070C flowmeter [18] offered by KROHN, which is integrated with the Intelligent Signal Processing (ISP) function. The ISP can eliminate unwanted noise and external perturbations for measurement via its signal processing unit, so that users can read the stable flow results of either liquids or vapors without any impacts from fluctuating pressures and temperatures. Another
Monitoring (SPM) functions, can analysis data for indicating abnormal process status such as cavitation and flame instability.
The above examples demonstrate signal processing and analysis functions which are integrated in smart transmitters. Even through there are only handful smart transmitters with built-in functions in market, they shows a trend that smart transmitters provide not only accurate measurement, but also signal processing and data analysis functions.
1.1.2 Composition of Smart Transmitter
To integrate data analysis functions into smart transmitter, two major components are required, which are the hardware and software system of smart transmitters, respectively.
A. Hardware components in a smart transmitter
The hardware components of a smart transmitter could be composed with three main parts, including signal processing unit (SPU), application processing unit (APU), and bidirectional communication unit (BCU), as shown in Figure 1.3. Benefiting from the development of embedded systems and integrated circuits technology, those three parts and sensing elements unit (SEU) can be integrated into one chip, or grouped into
different components based on different application scenarios. In addition, some auxiliary parts such as power units, communication antenna, electric isolation circuits, and display units are also basic components in a smart transmitter.
Sensing Elements Unit (SEU)
Signal Processing Unit (SPU)
Application Processing
Unit (APU)
Bidirectional Communication
Unit (BCU)
Network
Smart Sensor
Thesis focuses: Algorithms embedded
Smart Transmitter
Signal Processing Unit: SPUs play the role of translating analog signals into digital signals. Components such as signal conditioners, analog-to-digital converters (ADCs), and sometimes signal processing processors are in this unit. SPUs connect with SEUs and transfer SEU signals into digital output. The digital output so called raw data are then used for further processing. Moreover, if signal processing processors are involved, the signal processing functions, such as signal compensation, calibration, digital filters, drift testing, and fast Fourier transform (FFT), can be integrated in this unit.
Bidirectional Communication Unit: BCUs serve as bridges, exchanging data for smart sensors with outside network. BCUs allow the smart transmitters to exchange data with other systems or devices, such as upper lever controllers, actuators, or other sensors. Applying standard communication protocols in BCUs is an efficient approach to achieve unification on communication and accelerates the progress of smart sensors for various networking applications.
Application Processing Units: APUs are the pools for organizing and running
embedded algorithms for different applications. To execute complex algrithms, powerful MCUs need to be assigned to APUs. Furthermore, to achieve multiple tasks and real-time operation, RTOS needs to be applied for a microcontroller. An MCU with a RTOS is an excellent combination for APU. This allows APU to be integrated with algorithms to realize data analysis functions. Therefore, the algorithms and functions in this thesis are implemented in this unit.
B. RTOS for smart transmitters
To process various smart functions within a deterministic response time, RTOS is commonly involved in smart transmitters [20]. A task, which includes an application program code and works independently from other tasks, is dispatched by the RTOS kernel’s scheduler [20]. The preemptive kernel, which is the core of RTOS, is used for
designated as an indenpendent loop, memory resources, and priority. The algorithms and functions in the tasks can be organized flexibly and scheduled in real-time.
1.2
Shortcomings of Existing Smart Sensors and Potential
Solutions
Smart sensor has become a fashionable word in contemporary technological among industrial circles. However, there are still some shortcomings in the existing smart transmitters.
1.2.1 Shortcomings of Existing Smart Transmitters
A. Lack of data analysis functions
So far, there are very few analysis functions in existing smart transmitters. The computing processors in the conventional smart transmitters are used to compute
calibration and linearization for accurate measurement. Communication is responsible for transmitting measured data to other systems. Even though powerful computing
processors are embedded, the main task of conventional smart transmitters mainly focuses on measurement and data transmission. By leveraging powerful computing capacity, smart transmitters can be integrated with data analysis functions beyond providing measurement.
B. Lack of information extracted from data
1.2.2 A New Generation of Smart Sensors
As previously discussed, integrating functions to provide valuable information is the key feature to potentially enhance the existing smart transmitters. The smart sensors
combined with smart transmitters can be described as following:
A smart sensor is a multi-capabilities, algorithms embedded device in which measuring, analyzing, collaborating, and self-governing can be integrated to convert physical variables into accurate data, process data and extract valuable information, and utilize comprehensive information to provide decision-making suggestions.
From above concepts, the embeded algorithms play key roles to allow smart transmitters to extract valuable information from collected data. Moreover, the platform of the
embedded algorithms can be realized by embedded RTOS to enable customized functions to be integrated into smart transmitters.
1.2.3 Potential Solutions through Integrating Data Analysis
To overcome the shortcomings of conventional smart transmitters, smart transmitters can be embedded algorithms to realize data analysis functions. The improved smart
transmitters should extract valuable information from the collected data instead of just sending measurement.
A. Realizing data analysis for process condition monitoring
The data analytical functions for analyzing the status of industrial process and facilities are commonly realized by condition monitoring systems. The typical form of condition monitoring system is a central management software system. For instance, Emerson AMS Suite provides a software solution named Essential Asset Monitoring [23] to analyze collected data to alert operators for any process faults, such as fouling and plugging problems in heat exchanger systems, or pump shutdown in cooling systems. Siemens Condition Monitoring Library [24] in its Distributed Control System (DCS) PCS 7 systems can analyze the health status of centrifugal pump damage, valve wear, process steady state, and any pressure loss. Another example is Process and Equipment
system is integrated with preprogrammed first-principles models, which include a pump, compressor, heat exchanger, and turbine models, can be used for predicting the status in either the process or the equipment.
The widespread applications of these systems demonstrate the usefulness of the data analysis functions in condition monitoring systems are used for industrial process systems. However, to employ and operate such central monitoring systems, the users need to design the monitoring systems, prepare central rooms and computers for the software, and spend time to attend the professional trainings for learning the operations.
Generally, small to medium sized systems are often lack of conditions and funds to apply such large and high-cost centralized monitoring systems [5]. Realizing data analysis functions at sensor level rather than employing centralized monitoring systems is cost-effective way to equip analytical systems for small and medium sized systems. Since smart sensors are broadly used small and medium sized systems, integrating data analysis functions into existing smart transmitters without adding extra cost, allows the status of facilities monitored and the process data can be analyzed in a cost-effective way.
B. Providing information of process fault detection and variable prediction
Faults detection information and variable prediction information are two kinds of process information which are provided by process fault detection function and variable
prediction functions respectively in condition monitoring systems. The process fault detection function can monitor the health of the process and alert faults. The detected faults information in incipient period means that the faults are detected before they developed into deterioration or failure. The incipient fault detection can be used to prevent serious failures in process or esstential equipment and to avoid deterioration. Equally important, the prediction function can predict process variables to foresee the future changes of the vital variables. The predicted information allows controllers and engineering teams to take early actions rather than simply passively waiting for
The implementation of process fault detection and variable prediction functions in smart transmitters can enable smart sensors to provide information of process faults and
variable prediction. Smart transmitters can be embedded with algorithms to achieve such functions to overcome the shortcomings of existing smart transmitters.
1.3
Research Objectives, Methodologies, and Scope
1.3.1 Objectives
To enable smart transmitters to perform fault detection and variable prediction functions, the objectives of this thesis include the following two aspects:
A. Investigating the feasibility of adding smart functions in smart transmitters
The methods which can realize the smart functions of process fault detection and variable prediction and suitable to be applied into smart transmitters are investigated.
Furthermore, the hardware capability of the MCU in the transmitter implementation platform and its RTOS software system are studied. Based on the investigated methods and studied capability of the transmitter, the specific algorithms for realized process fault detection and variable prediction are designed.
B. Implementing the algorithms of the smart functions into a smart transmitter
The algorithms which can realize fault detection and variable prediction are implemented in MCU of the transmitter. The added smart functions enable the implemented smart transmitter to extract the process information of fault detection and variable prediction from collected data, using its the underutilized computational resources without adding extra expense.
1.3.2 Methodologies
1) The feasibility of integrated functions and embedded algorithms for realizing fault detection and variable prediction in smart transmitter are investigated. The capabilities and specifications of the implementation transmitter are studied.
2) The algorithms for realizing fault detection and variable prediction are implemented in MCU of the transmitter. The algorithms are organized in independent tasks and
scheduled in real-time by RTOS of the transmitter. The RTOS multitasking
configuration, which includes the consideration of task priority, event response time, and processor workload, are discussed and implemented.
3) The enhanced smart sensor are verified in a semi-practical test facility. The designed process fault detection and variable prediction functions are validated both in offline and online test. The multitasking design of three tasks in RTOS of smart transmitters are also validated.
1.3.3 Scope
The scope of this thesis mainly focuses on integrating fault detection and variable prediction functions into the smart transmitters of the smart sensors. The procedures of investigating feasible methods and algorithms for realizing the targeted functions, implementation of the algorithms, and V&V test, are three main tasks in this research, which provide a demonstration for further functions and algorithms to be integrated into transmitters. Therefore, not all the data analysis functions of condition monitoring systems are involved. The faults which are demonstrated in the test environment for the validation are only the typical faults, and will not cover all the faults in the test facility.
1.4
Contributions of the Thesis
This thesis has made three major contributions:
A. Investigating the feasible methods and algorithms to embed into smart transmitter
Based on the capabilities and specification of the transmitters, the feasible methods and algorithms of process fault detection and variable prediction are investigated. The algorithms are embedded into a commercial transmitter and scheduled by its RTOS successfully.
B. Improving capabilities of the existing sensors with data analysis capabilities
The integrated smart functions improve the capabilities of the existing transmitter. The data analysis functions which include process fault detection and variable prediction enable smart sensors to analyze process data locally, allowing the small and middle sized system can be economically deployed with process fault detection and variable
prediction.
C. Demonstrating the feasibility of integrated smart functions into existing transmitter
The successful implementation of the feasible methods and algorithms of fault detection and variable prediction functions demonstrates the procedures of the implementation of the smart functions in a transmitter hardware platform. The procedure such as methods survey, algorithms implementation, and V&V test can be referenced for further functions integration.
1.5
Organization of the Thesis
The thesis consists of seven chapters. The remainder six chapters are organized as follows:
The progress of smart sensors are reviewed, while the existing methods for targeted smart functions including fault detection and prediction are surveyed in Chapter 2. The
Chapter 4, the specifications of the designed functions are proposed, and algorithms of process fault detection and variable prediction are investigated. Furthermore,
implementation of algorithms and multitasking design are discussed in Chapter 5. In Chapter 6, the verification and validation of smart functions in smart transmitter are carried out on a physical test environment. Finally, summary, conclusions, and future work are presented in Chapter 7.
Chapter 2
2
Literature Review
The literature of smart sensors can be traced back to thirty years [1][2]. The development of smart sensors over this time can be classified into following four phases, i.e. Data acquisition, integration of hardware and software, communication, and information. As the software system of the smart transmitters, RTOS is the important compositions in smart sensors for organization various programs. Furthermore, to extract information from measurement data in smart sensors, algorithms which is embedded in transmitters paly the key role. Therefore, it is necessary to review the appropriated algorithms to implement process fault detection and variable prediction functions.
2.1
Review of Existing Smart Sensors
A. Data acquisition from physical world
In order to provide accurate measurement, the smart sensors are integrated with microprocessors in their transmitters to realize digital signal processing and data
computing. According to Schödel [26], smart sensors are described as a microprocessor device with filtering and other signal processing and data computing functions.
Comparing with the traditional analog circuit design, the digital microprocessors such as MCUs and Digital Signal Processors (DSP) are integrated into smart sensors [1]. MCUs are commonly used for data processing such as calibration, linearization, and
compensation for accurate measurement [27]. The typical MCU chips are Texas Instruments MSP430 [28], and LPC4000 series from NXP [29]. DSP is ultilized for signal processing in smart sensors [30], such as FIR/IIR filtering, and Fourier transforms.
B. Integration of hardware and software
and integrated into a single processor chip [11][34][35]. The high integration allows sensors to be more compact in size, multiple sensing integrations, and lower power consumption.
Typical hardware and software integration technologies used in smart sensors are Micro-Electro-Mechanical Systems (MEMS) and System-on-Chips (SoCs) [33][36]. MEMS uses microfabrication technology to make miniaturized mechanical and electro-mechanical elements in electronics and microscopic devices [37]. Owing to its micro-embodiment, MEMS technology can integrate a large number of sensing elements into one chip [33]. SoC enables signal conditioning parts and other circuits to be integrated together. SoC is integrated circuit (IC) system which is designed for integrating
microsystems and multiple technologies, such as CMOS, MEMS, microprocessors, RT transceivers [36] that allow digital circuits, analog circuits, memories, ADCs, and microprocessors to be integrated into one chip and enable smart transmitter as a small foot-print[38][39].
C. Data transfer via communication
Thanks to the digitization and integration development in phase 1 and phase 2, smart sensor have become powerful sensing and measurement devices. However, the
conventional analog transmission such as 4-20mA or 0-10v remains as bottlenecks for allowing smart sensors to exchange more data with other systems. As sensors combining with bus interface [2] and communicating with host systems [40], network functions become the essential capabilities of smart sensors. With wired and wireless network technologies, transmission barriers of smart sensors have been broken through.
D. From data to information
Benefited from the rapid development of sensing, microelectronics, and communication technologies, smart sensors have become essential devices for collecting rich data in various networks. However, a challenge of rich data but poor information has been found in many industries. The valuable information allows people, control systems to make effective decisions, and to be used as reference for preventing accidents, foreseeing the problem, improving productivity [46]. Therefore, extracting valuable information from the collected data in smart sensors is imperative.
In order to extract valuable information from data, the embedded algorithms play the key roles. In early stages, smart sensors are incorporated with dedicated signal processing algorithms [47], such as power spectral density(PSD) and FFT, to provide frequency analysis information. Further progress on the development and implementation of fault detection and diagnosis [48], and artificial neural network functions [49] have allowed smart sensors to be information providers. For instance, leveraging image identification algorithms, smart cameras BOA [50] can identify the broken bottles in production line.
In the industrial field, the process information of the process faults and the future changes of the essential variable is valuable for users. The detected faults information in the process systems can be used to guide the planned maintenance, prevent deterioration, and to avoid serious accidents and failure in the process system. The predicted information can be used to guide timely preventive actions rather than simply passively waiting for system to go worse. To realize fault detection and prediction information to be provided in field level, process fault detection and variable prediction functions can be integrated into smart transmitters as smart functions in smart sensors. Therefore, the appropriated methods and algorithms to implement fault detection and variable prediction functions in smart transmitters are reviewed in the later sections.
2.2
Existing Fault Detection Techniques
[3]. Faults may cause a decline in or even total loss of the designed capability in process systems. Unmonitored faults pose a significant risk to the safety of a plant or a machine system, and can lead to serious consequences for industrial production. Fault detection methods which can be used to extract faults information from the collected data of sensors are reviewed. Moreover, as a smart functions which is integrated into smart transmitter, the selected fault detection method must be applicable for embedded system. The computational complexity and operability of the algorithms should be feasible to be used in smart transmitter.
2.2.1 Classification of Fault Detection Methods
Many different approaches to monitor and detect imminent faults have been developed and discussed over the last thirty years [51][52][53]. Fault detection methods can be classified into two main groups: model-free methods and model-based methods [54][55]. An overview table of different fault detection methods is shown in Table 2.1.
Table 2.1: Classification of Fault Detection Methods [54][55]
Model-free methods can be further broken down into signal-based methods and data-driven methods [55]. Neither of these methods utilizes a mathematical model of the objects. Signal-based methods mostly use signal spectrum analysis tool and are normally applied for rotating machine fault detection via analysis of vibration and noise. This method requires analytical devices with high-frequency capabilities [3], which means that the transmitters are needed to be configured with high-frequency data acquisition
Signal-based Data-driven
Parameter estimation Correlation Artificial neural networks (ANN)
Observers Time-Frequency analysis Principal component analysis (PCA)
Parity equations Spectrum analysis Partial least squares (PLS)
Kalman filter Wavelet analysis Multivariate state estimate technique (MSET)
Classification of Fault Detection Methods
Model-based
hardware. Data-driven methods use multivariate statistical methods via plenty of historical data and complex matrix computing. For instance, the typical data-driven methods are Principal component analysis (PCA) and Partial least squares (PLS) [56]. PCA and PLS methods are usually applied in central supervision systems [56][57]. Although model-free fault detection methods do not need the prior knowledge of
mathematical model, due to the requirements of high computational complexity and large capacity storage space for the long-term data archiving, this kind of methods is hard to be broadly applied in transmitter devices.
Model-based methods need to use explicit mathematical models of the monitored process to represent the relationship between manipulated variables and controlled variable [3]. model-based fault detection methods have been tested and verified in many industrial applications such as actuators, sensors, machines and plants [58][59]. A diagram of this framework is shown in Figure 2.1 [52]. The inputs and outputs of a system are the data source of Model-based methods, allowing model-based methods to be feasible for implementation in the devices [3].
Controller
Actuators Dynamic
Process Sensors
Faults
Plant
Reference Input Control
Output
Models & Parameters
Residual Generation
Residual Evaluation
Faults Alerts
Figure 2.1: Model-based Fault Detection Framework [52]
Residual generation is produced by the different model-based methods such as parameter estimation, observers, and parity equations [51][57], while residual evaluation involves making decisions on fault alarms using thresholds or statistical tools [60]. Based on the different application scenarios, the different combination of residual generation and residual evaluation methods could be applied. Since the model-based fault detection methods are suitable to be implemented in devices, therefore, the model-based methods are selected to be used in the smart transmitters.
2.2.2 Residual Generation by Model-based Methods
Residuals represent the deviation between the observed variables and the analytical output values of the mathematical model [60]. As illustrated in Figure 2.1, the residual is generated from a residual generation block. One straightforward method for calculating residuals is the difference between the measured output ( )y t from detected system output and an estimated output ˆ( )y t from the system model, as
ˆ
( ) ( ) ( )
r t y t y t (2.1)
The three major model based methods to generate residuals via estimating output ˆ( )y t
As shown above, both observer and parity equation methods rely on known mathematical matrix and equations. However, the prior matrix and equations are hard to derive in some systems and are scarcely possible to be preprogrammed with amount of models into smart sensors for various process systems, allowing the methods which require specific mathematical matrix and equations are hardly to be used in smart transmitter. Contrarily, parameter estimation methods can estimate the parameters of the model. Only structure of the models need to be determined. The determination of model structure is easier than the determination of both structure and parameters of model. Leveraging parameter estimation, the modeling system can learn the parameters of model with the determined structure of the model. This strategy without intervention allows parameters estimation methods to be broadly used, and enabling parameter estimation methods to be suitable for embedded devices integration. Therefore, parameter estimation methods are selected for integrating into smart transmitters.
Among parameter estimation methods, the Least Squares (LS) and its recursive algorithms are commonly utilized [51]. The basic LS algorithms is batch processing algorithm, which need to be recomputed with all the data in matrix and matrix inverse computation [62]. Comparing with LS, Recursive Least Squares (RLS) reduces the computational effort. Leveraging recursive strategy, RLS has been widely used for system identification and adaptive filter domain [63][64]. With fast convergence performance and recursive as well as adaptive features, RLS is broadly used for online parameter estimation both in open-loop and closed-loop [63]. However, the original RLS is suitable for estimating the parameters which are stable or time invariant [51]. To estimate the parameters in a time-varying system, the alternative algorithms named Exponentially Weighted Recursive Least Squares (EWRLS) with a forgetting factor can be used [51]. Since the process system working around operating point can be described as linear dynamic models [3], this algorithm is suitable for identifying parameters in process system.
Smart transmitters are the embedded system which is a system of unattended, and limited computation. The adaptive and recursive algorithms of parameter estimation can
efficiently. Therefore, to online estimate the parameters of process system working around operating point, EWRLS are suitable to be used in smart transmitters. The more details of algorithms to implement recursive parameters estimation are discussed in section 4.2.
2.2.3 Residual Evaluation for Fault Detection
After the residuals are generated, the residual evaluation is used to examine the faults occurrence. Residual evaluation is a procedure for using residual and validation technologies to make decisions about the faults detection [53]. The residual evaluation manners can be grouped into two paradigms which are threshold approaches and statistical tools, respectively [65][60].
The basic idea of threshold approaches is to validate residual deviation from normal values [66]. Once sensors, actuators, or equipment faults occur, residuals will deviate from zero. If the amplitude of residuals changes is larger than the threshold, the evaluation test will consider faults occurred. In practical applications, the residuals are corrupted by unknown disturbances, process noises, and uncertainties in the system model. Leveraging threshold method alone could miss the false or generate wrong fault alerts. Therefore, statistical tools methods of residuals evaluation could be involved to overcome the influences from disturbances and noises when evaluating residuals changes.
Three well-known statistical tools for residuals change detection are Sequential Probability Ratio Test (SPRT), Generalized Likelihood Ratio (GLR) Test, and
for online fault detection in devices, CUSUM is suitable to be used as statistical tool of residual changes evaluation for fault detection in smart transmitters.
In summary, the parameter estimation and CUSUM methods can be considered to be combined as fault detection functions in smart sensors. In practice, the industrial process system model is often unknown or hard to be derived in most cases. The parameter estimation method is suitable for industrial users in such situations. Adaptive algorithms and recursive computing solutions are suitable for online parameter estimation in smart sensors. Moreover, considering the performance and computational complexity, the two-side CUSUM as residual evaluation tool can be employed. A detailed algorithms and implementation for fault detection function are introduced in Chapter 4 and 5.
2.3
Existing Techniques for Prediction of System
Responses
To predict the responses of a system, the system model play significantly roles [69][70]. Besides model, the responses of the system which are needed to be predicted should be measured or known, while the leading forces (inputs) of the system can be known or unknown [70]. Based on different scenarios of leading forces which are either known or unknown, the different prediction models and prediction methods can be applied. Moreover, as a smart functions which is integrated into smart transmitter, the selected prediction algorithms must be applicable for embedded system and should be feasible to be used in smart transmitter.
2.3.1 Models with and without Exogenous Variables
motor is controlled by manipulated voltage. Involving exogenous inputs, prediction by the models with exogenous variables can be proactive and accurate. Therefore, the models with exogenous variables are suitable to describe the input-explicit system.
The diagrams to illustrate the prediction system considering without known inputs and with known inputs are shown in Figure 2.2 and Figure 2.3, respectively.
Model
System being monitored
Modeling and parameter estimation
subsystem
Prediction subsystem
Prediction with exogenous inputs
Parameters
Output response of system
Predicted output & response Known
inputs
Figure 2.2: Illustration of a Prediction with Known Inputs [70]
Model
System being monitored
Modeling and parameter estimation
subsystem
Prediction subsystem
Prediction without exogenous inputs
Parameters
Output response of system
Predicted output & response unknown
inputs
A. Models without exogenous variables
In models without exogenous variables, only observed response of the system is used. The common used models without exogenous variables are Auto Regressive (AR) model [71], Autoregressive moving average (ARMA) model [69], Autoregressive integrated moving average (ARIMA) model [69][72], and grey model [73]. AR model is often used as linear prediction models for the stochastic process in statistical and signal processing field [71]. Although the AR is simple and widely used, if the noise and disturbances are unaccounted, the prediction derived from AR model may be less accurate [69][71]. ARMA and ARIMA shows better performance since the noise structure and integrated noise structure are considered in two models. However, the parameters estimation for high orders coefficient of these two models is high computational complexity [69][71]. The industrial process includes obvious disturbance, while huge computing tasks are not suitable to be embedded into smart transmitters. Therefore, the model which have robust performance and moderate computational complexity are suitable to be used in smart transmitters for implementing prediction function.
Grey model shows good and robust performance in uncertainty and noise condition [74]. grey model are proposed from grey system theory [73]. This methodology focuses on modeling the system with small data samples, and extracting useful information from uncertain systems [75][76]. The typical popular GM(1,1) model which is used for modeling monotonic data series only needs two coefficients to be estimated, whereas GM(2,1) which is used for modeling none monotonic data series needs three coefficients to be estimated. Since the estimated coefficients only have two or three matrices, the straightforward Least Square (LS) parameter estimation can be involved [74]. Leveraging these two model and using n length of data series, the data series can be modeled easily, and the further ahead steps of data can be predicted iteratively. Using grey model, the performance and computational complexity can be balanced. Therefore, GM(1,1) and GM(2,1) models can be the model without exogenous variables for implementing prediction in smart transmitters for the input-implicit process.
Different from models without exogenous variables, the model with exogenous variables involved the leading forces (inputs) of system response. Considering the impacts of system inputs and known output response, the prediction can be proactive and accurate. According to [69][77][63], the Auto Regression with exogenous inputs (ARX) model and Auto Regressive Moving Average with exogenous inputs (ARMAX) are well-known models with exogenous variables. Involved with inputs U k( )and system response ( )y k , ARX model can be described as equation (2.2) in which the parameters amand bmwith m
order can be estimated via parameter estimation method, i.e., LS or RLS. Comparing with ARX, ARMAX which is shown in the equation (2.3) is added with moving average. The
parameters am,bmand cmwith m order can be estimated via Extended Least Squares (ELS) method [63].
1 1
( ) ( 1) ... ( )
( 1) ... ( ) ( )
m m
y k a y k a y k m
bU k b U k m n k
(2.2)
1
1 1
( ) ( 1) ... ( )
( 1) ... ( ) ( ) ( 1) ... ( )
m
m m
y k a y k a y k m
bU k b U k m n k c n k c n k m
(2.3)
where ( )n k is assumend to be white noise sequence.
Even through ARMAX can be more precise to describe a dynamic system compared to ARX [78], the computation for parameters estimation are more complicated. On the contrary, because of the simplicity of the parameters estimation for ARX, this model is often used for industrial system identification [79]. Considering the performance and complexity of ARX and ARMAX, ARX can balance the precise and complexity for modeling a system, and suitable to be applied in embedded systems. Therefore, ARX is suitable to be used in smart transmitters to model the process system when exogenous variables should be considered in the process model.
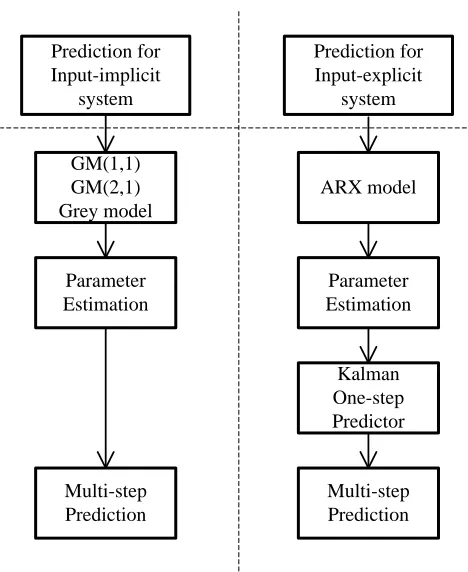
2.3.2 Model-based Prediction Methods
output response can be used to predict the response of the input-implicit process, while utilizing ARX model, the known inputs and output response of the system can be used together to predict the response of the input-explicit process.
To achieve multi-step prediction, the one-step prediction and multi-step iterative computation are commonly combined together. During the multi-step iteration, if the prediction error exist in every prediction step, the error in multi-step prediction results is cumulated. This will result in lower prediction accuracy for further steps ahead
prediction. To accurately predict variables for multi-step ahead, the effective solutions to reduce the effects of noise and disturbance in multi-step prediction need to be selected. Otherwise, the noise and error will be amplified via multi-step ahead iteration.
Considering the robust performance of grey model in uncertainty and noise condition, GM(1,1) and GM(2,1) are used for the multi-step iterative prediction directly.
Comparatively, since there is no disturbance term described in ARX model[77], the error in the initial iterative prediction step will be accumulated after multi-step iterative
ARX model
Kalman One-step Predictor GM(1,1)
GM(2,1) Grey model
Parameter Estimation Prediction for Input-implicit
system
Prediction for Input-explicit
system
Parameter Estimation
Multi-step Prediction
Multi-step Prediction
Figure 2.4: Diagram of Grey Model and ARX Model for Prediction
A. Kalman filter for ARX one-step prediction
Kalman filter is a well-known estimator for solving linear-quadratic problem and has been extensively used in the engineering field [80]. The property of Kalman filter is a minimum mean-square estimator of the state of a determined linear state-space model in a Gaussian environment [62]. A set of recursive discrete-time equations enables this method to be computed very efficiently. The diagram of one-step states predictor [62] [81] derived from Kalman filter is shown in Figure 2.5. This one-step states predictor from Kalman filter is called Kalman one-step predictor in this thesis.
Leveraging the results from Kalman one-step predictor, the further steps prediction of states which represents the response of system can be achieved accurately.
Figure 2.5: One-step Prediction Using Kalman Filter [51]
B. Repeat iteration for multi-step ahead prediction
To predict multi-step ahead response of the system, the one-step ahead prediction can be derived combined with the observed input and output variables of the system firstly. Then using predicted value from the last step, the multi-steps ahead prediction can be
calculated iteratively. For instance, using ARX model and m numbers of past response variable, after p times of iteration, p-step ahead predicted response variable y kp( p) could be derived interactively using equation (2.4).
1 +1
1 2
( ) ( 1) ... ( 1) ( )
( 1) ( ) ( 1) ... ( 1)
m m
p m
y k a y k a y k m a y k m
y k a y k a y k a y k m
b U
b U
1
( ) ( 1 ) ... ( )
p p m
y kp a y k p a y k m p b U
In summary, to predict the response of an input-implicit process, grey model can be used to construct a model without exogenous variables, and repeat iteration method can be utilized for multi-step ahead prediction. To predict the response of an input-explicit process, ARX is suitable to describe a model with an exogenous variables, and Kalman predictor and repeat iteration method can be combined for multi-step ahead prediction.
2.4
Real-time Operating Systems in Transmitters
RTOS has been used as reliable software system for real-time processing multiple tasks in embedded systems [83][84]. RTOS is also broadly used in the transmitter of the sensors [2], such as wireless sensors [85], vibration sensors [86]. The mainstream RTOS includes VxWorks [87], Nucleus RTOS [88][89], ARM mbed [90], MicroC/OS [91], FreeRTOS [92] and so on. Leveraging RTOS, the multiple tasks can be scheduled by the kernel in real-time. This will enable users to focus on the development of function instead of multitasking scheduling. The RTOSs allow the development of functions in embedded system to be more efficient and reliable.
To realize multitasks scheduling for achieving task period time and response deadlines, the preemptive schedulers are commonly employed in RTOS. The different preemptive scheduling policies can be realized in the RTOS by different parameters setting.
The priority-based preemptive static scheduling policies are the main scheduling policies used in RTOS [87]. Using the preemptive static scheduling policies, the task which is assigned with highest static priority and positioned in the ready queue is to be prioritly executed. Therefore, the assignment of static priority for the tasks plays the key role in priority-based preemptive static scheduling policies. Some popular static priority assignment schemes under the umbrella of priority-based preemptive static scheduling policies including Rate Monotonic Scheduling (RMS), Shortest Job First (SJF)
scheduling, Shortest Response Time (SRT) scheduling [87]. Considering RMS is optimum scheduling solutions among the others and is widely applied by RTOS
![Figure 2.2: Illustration of a Prediction with Known Inputs [70]](https://thumb-us.123doks.com/thumbv2/123dok_us/1960985.1258464/45.612.181.465.463.669/figure-illustration-prediction-known-inputs.webp)
![Figure 2.5: One-step Prediction Using Kalman Filter [51]](https://thumb-us.123doks.com/thumbv2/123dok_us/1960985.1258464/50.612.159.495.130.344/figure-one-step-prediction-using-kalman-filter.webp)
![Figure 3.4: Block Structure of a PA devices Profile [100]](https://thumb-us.123doks.com/thumbv2/123dok_us/1960985.1258464/60.612.154.489.325.603/figure-block-structure-pa-devices-profile.webp)