University of South Carolina
Scholar Commons
Theses and Dissertations
5-8-2015
Applications of Organic Probes for Imaging and
Analysis of Different Cancer Cell Models
Hong Guan
University of South Carolina - Columbia
Follow this and additional works at:https://scholarcommons.sc.edu/etd Part of theOrganic Chemistry Commons
This Open Access Dissertation is brought to you by Scholar Commons. It has been accepted for inclusion in Theses and Dissertations by an authorized administrator of Scholar Commons. For more information, please [email protected].
Recommended Citation
Guan, H.(2015).Applications of Organic Probes for Imaging and Analysis of Different Cancer Cell Models.(Doctoral dissertation).
A
PPLICATIONSO
FO
RGANICP
ROBESF
ORI
MAGINGA
NDA
NALYSISO
FD
IFFERENTC
ANCERC
ELLM
ODELSby
Hong Guan
Bachelor of Science Tsinghua University, 2005
Master of Science
Medical College of Wisconsin, 2009
Submitted in Partial Fulfillment of the Requirements
For the Degree of Doctor of Philosophy in
Chemistry
College of Arts and Sciences
University of South Carolina
2015
Accepted by:
Qian Wang, Major Professor
John H. Dawson, Committee Member
Stephen L. Morgan, Committee Member
Guiren Wang, Committee Member
Dedication
This dissertation is dedicated to my loving, optimistic and supportive husband,
my cute smart little boy and girl, and to my always supportive and faithful parents and
Acknowledgements
Great appreciation and sincere thanks for the suggestions and support are
present here to the following persons who have made this dissertation possible.
Dr. Qian Wang, my advisor and my life guider, his suggestions and
foresights have been beneficial not only to my research, but also to my life and my
future career. I am deeply indebted to his stimulating motivation and valuable ideas
which help to make this work possible. His patience and kindness have been with
me for each moment in the life. His caring and support are also extended to my
family. He is a great supervisor for us in every field.
Dr. Xinrui Duan, I would like to thank him for his innovation and patience
with me. He has taught me how to think critically and scientifically. His curiosity
and enthusiasm in science lead me to enjoy every day working.
I would like to thank my fellow lab members for their valuable comments
and suggestions, including Dr. Honglin Li, Dr. Jun Hu and Dr. Yuping Shan for
sharing their expertise in organic chemistry and analysis chemistry, as well as their
constructive discussion and valuable comments on my research. Thanks to my lab
member Xia Zhao who has been with me and engaged me with scientific talking.
Dr. Chang-UK Lim and Dr. Udai Singh, their helps in performing and
appreciated. Their instructions and suggestions on cell analysis and sorting provided me
invaluable experience.
I greatly appreciate helps and suggestions from fellows of Dr. Hexin Chen’s lab,
including graduate student Yogin Patel, and Dr. Shou Liu. Their suggestions and help in
cell culturing and signaling pathway analysis in Chapter 1, 2 and 4 have expanded my
knowledge.
I also owe thanks to Dr. Franklin G. Berger, Dr. Daping Fan for their helps on
searching for proper cell lines. I would like to extend my gratitude to Dr. Andrew
Greytak and Yi Shen for their collaboration in synthesis DBCO-Quantum dots in Chapter
3.
Great gratitude and sincere thanks to Dr. John H. Dawson, Dr. Stephen L. Morgan,
Dr. Guiren Wang, my committee members, for reviewing and evaluating this dissertation
and their invaluable suggestions and kind help throughout my graduate study.
I would like to thank my family and friends for their endless love and supports.
My classmates and friends from University of South Carolina, especially Jie Gao’s
family and Chao Li, they always stand by me and are willing to help. I would like to
extend my appreciation to my friends Yuwei Kan and Xiaofang Zhang, for being my best
friends and sharing their life with me. My parents in law and my sister in law have been
with me for each happy moment. Their encouragement and good wishes are meaningful
to me.
I owe great appreciation and love to my special one, my husband Xiaoguang Ma, for
grateful to have you two in my life. You cute faces are source of my happiness and
strength.
Special thanks to my brother for sending his love over the phone. His love has
securely protected me. Lastly, I would like to express my enormous thanks to my
dear parents for their dedication, their hard working and their endless love. They are
my source of strength, wisdom and inspiration. I am forever grateful for being their
Abstract
Novel techniques for better studying cancer cell behavior and progression are
extremely important. Our lab is interested in synthesizing specifically designed organic
reagents and applying them in the studies of cancers. In this dissertation, we used organic
probes to investigate cancer cells in the following topics: determination of amino acid
concentration in different types of cancers, tumor toxicity of organic probes towards
HER2 positive breast cancer cells, glycoproteins identification in breast cancer cells and
development of enzyme activity assay for colon cancer cells.
The first chapter was focused on the determination of cysteine/homocysteine
concentrations using turn-on sensors in cancer cells. Traditional methods such as HPLC
are time consuming and cumbersome. DCP family probes were synthesized by our group
previously, of which three probes reacted with cysteine/homocysteine specifically. To
test the reactivity, the sensors were reacted with different substrates, including amino
acid, nucleotides and proteins. All three sensors showed great selectivity towards cysteine
and homocysteine. We confirmed the correlation between fluorescence intensity and
cysteine concentration. Then liver cancer cell model which was previously reported with
different intracellular cysteine concentration was used to test the sensitivity of sensor 2
inside live cells. The staining results from the liver cancer cells pretreated with 400 μM
To study cysteine/homocysteine concentration in breast cancer cells, we used sensor
2 to stain genetic modified breast cell line MCF10A Vector and MCF10A HER2, which
could mimic normal breast cells and breast cancer cells. MCF10A HER2 had higher
cysteine/homocysteine level than MCF10A Vector.
Besides being good fluorescent probes, DCP family probes may also work as
anti-tumor drugs. To study the toxicity of DCP family probes, we have performed cell
viability assay to screen possible probes targeting the breast cancer marker HER2 in
Chapter 2. Several probes were selected and the HER2 downstream signaling pathways
were further studied. It was found that sensor 3 may be further modified for HER2
specific drugs to treat breast cancer.
In Chapter 3, we used bioorthoganol probes and correlating reporters to develop
protocols for cell imaging and enrichment of glycoproteins. Using two different
fluorescent reporters, we addressed the total glycosylation level as well as cell surface
specific glycosylation in three different breast cell lines. We also confirmed that breast
cancer cells had elevated the level of glycosylation compared to the normal breast cells in
this chapter. To enrich glycoproteins, our lab modified a silicone bead with disulfide
bond and triple bond at the end of surface chain. The triple bond could react with azide
and be used to fish labeled proteins while the disulfide bond could be cleaved to release
the proteins after enrichment. Using this probe, we tried different methods for
glycoprotein purification. Unfortunately, we were not able to develop a protocol to enrich
In the last Chapter, we moved to the enzyme activity detection in colon cancer cell
line. A fluorescent sensor named RSAAA was synthesized specifically targeting on
mitochondria and might be worked potentially as substrate for aldehyde dehydrogenase 2
(ALDH2). We tested the efficiency of this sensor working as substrate for ALDH2.
Based on the results, we developed a protocol to stain cells and isolated populations with
different ALDH2 activity. To study the role of ALDH2 in cancer stemness, ALDH2 high
and ALDH2 low cell populations were isolated using the protocol set up in this chapter.
The tumorigenicity of two populations was studied to identify the enrichment of cancer
stem cells. In HCT15, ALDH2 high cells had more cancer stem cell population and were
more malignant compared to the ALDH2 low population.
Specific designed probes could be powerful tools in the study of biological progress.
We have devoted to the application of multiple probes to better understand and study
cancer cells. Good communications between chemistry and biology help to support the
translation from basic organic chemistry to the applications in biological fields. The
emerging field of studies would be greatly appreciated in the development of new
Table of Contents
Dedication ... iii
Acknowledgements ... iv
Abstract ... vii
List of Tables ... xii
List of Scheme ... xiii
List of Figures ... xiv
List of Abbreviations ... xiv
CHAPTER 1 Highly Selective Fluorescence Turn-on Sensors for Cysteine/Homocysteine for Live Cell Imaging ... 1
1.1 Introduction ... 1
1.2 Results and Discussion ... 9
1.3 Conclusion ... 24
1.4 Experimental Section ... 25
CHAPTER 2 Cell Toxicity of DCP Family Probes ... 28
2.1 Introduction ... 28
2.2 Results and Discussion ... 29
2.3 Conclusion ... 36
2.4 Experimental Section ... 37
CHAPTER 3 Surface Glycan Localization and Purification ... 39
3.1 Introduction ... 39
3.2 Results and Discussion ... 48
3.3 Conclusion ... 62
CHAPTER 4 Assessment of Aldehyde Dehydrogenase 2 (ALDH2) in Live Cells ... 70
4.1 Introduction ... 70
4.2 Results and Discussion ... 76
4.3 Conclusion ... 95
4.4 Experimental Section ... 96
List of Tables
Table 3.1. Buffers used in enrichment of glycoprotein with Si-beads ... 59
Table 4.1. Human ALDH family proteins ... 71
List of Scheme
Scheme 1.1. Proposed mechanism of the oxidative SNArH and the following SNAripso
List of Figures
Figure 1.1. Structures of thiol containing molecules and fluorescence sensors. ... 2
Figure 1.2. Schematic illustration of the cysteine metabolism pathways. ... 3
Figure 1.3. HER2 signaling pathway. ... 8
Figure 1.4. Absorption (a) and fluorescence (b) spectra changes of 20 μMsensor 1 in CH3CN from 0 to 80 min upon addition of 100 μM cysteamine. ... 11
Figure 1.5. Fluorescence selectivity of cysteine sensor 1-3. ... 14
Figure 1.6. Quantification of cysteine in vitro. ... 15
Figure 1.7. Fluorescent images (a, c) and overlay image with bright field (b, d) of HCT116 cell lines stained with 50 µM sensor 1 (upper level) and sensor 2 (lower level) for 0.5 h. ... 19
Figure 1.8. Fluorescence (a-c, d-g) and bright field images (d, h) of live Hepg2/C3A. ... 20
Figure 1.9. Sensor 2 indicated intracellular cysteine concentration in live cells. ... 21
Figure 1.10. Sensor 2 indicated intracellular cysteine concentration in live cells. ... 22
Figure 2.1. Structure of DCP and its derivatives tested in our study. ... 30
Figure 2.2. Toxicity of DCP family probes in different breast cell lines. ... 32
Figure 2.3. HER2 activation upon treating with DCP derivatives. ... 34
Figure 2.4. Cell signaling targeted by DCP candidates. . ... 35
Figure 3.1. Different type of glycosylation. ... 40
Figure 3.2. Schematic figure of protocol for glycoprotein purification using azide-alkyne cycloaddition reaction. ... 42
Figure 3.3. Bioorthogonal reactions for proteins labeling. . ... 44
Figure 3.5. Structures of fluorescent probes for labeled glycoproteins. . ... 49
Figure 3.6. The schematic illustration of metabolic labeling and detection of glycoproteins with fluorescent probes. . ... 50
Figure 3.7. Staining of glycoprotein using DBCO-FL. ... 53
Figure 3.8. Staining of glycoprotein using DBCO-FL. ... 54
Figure 3.9. Staining of glycoprotein using DBCO-QT. ... 56
Figure 3.10. Schematic pictures to show the synthesis and characterization of Si-beads. 57 Figure 3.11. Stability of S-S bonds in buffer 7. ... 58
Figure 3.12. Purification control for the enrichment of glycoproteins. . ... 61
Figure 3.13. Enrichment of glycosylated protein using Si-Alkyne beads: choice of lysis buffer. ... 63
Figure 3.14. Enrichment of glycosylated protein using Si beads-choice of lysis buffer. . 64
Figure 3.15. Enrichment of glycoprotein using Si beads-choice of protein releasing methods. ... 65
Figure 4.1. Cancer stem cell models. ... 73
Figure 4.2. Aldefluor Assay. ... 74
Figure 4.3. Structures of RSAAA and RSACOOH probes and their possible conversion pathways in cells. ... 77
Figure 4.4. Schematic mechanism of assay for ALDH2 activity. ... 79
Figure 4.5. Fluorescent property and cell retention of RSAAA and RSACOOH. . ... 80
Figure 4.6. Expression of ALDH2 in colon cancer cells. . ... 82
Figure 4.7. Enzyme activity of ALDH2 in different cell lines. . ... 83
Figure 4.8. Organic probes as ALDH2 substrates. ... 84
Figure 4.9. Inhibitors of ALDH2. . ... 86
Figure 4.10. Cell co-staining of organic probes and MitoTracker. ... 87
Figure 4.11. Cell co-staining of organic probes and LysoTracker. . ... 88
Figure 4.13. Gating of “Fluo Low”, “Fluo Medium” and “Fluo High” population. ... 91
Figure 4.14. Tumorgenicity of AAA sorting populations. ... 93
List of Abbreviations
ABC ... ATP-binding cassette
ALDH ... Aldehyde dehydrogenase
BAA- ... BODIPY-aminoacetate
BAAA ... BODIPY-aminoacetaldehyde
Bcl-2 ... B-cell lymphoma 2
CSC ... Cancer stem cell
Cys ...Cysteine
DEAB ...Diethylaminobenzaldehyde
ELISA ... Enzyme-linked immunosorbent assay
ErbB ... Epidermal growth factor receptor
FBS ... Fetal bovine serum
FGFR... Fibroblast growth factor receptor
GAPDH ... Glyceraldehyde 3-phosphate dehydrogenase
GCL... Glutamate-cysteine ligase
GSH... Glutathione
Hcy ... Homocysteine
HER2... Human epidermal growth factor receptor 2
HPLC ... High performance liquid chromatography
Mcl-1 ... Myeloid cell leukemia sequence-1
PBS ... Phosphate buffered saline
CHAPTER 1 Highly Selective Fluorescence Turn-on Sensors for
Cysteine/Homocysteine for Live Cell Imaging
1.1 Introduction
1.1.1 The concentrations of thiol containing molecules are tightly controlled in cells
There are many different thiol containing molecules in cells, including cysteine,
homocysteine and glutathione (Fig. 1.1.a), which play essential roles in human
physiology [1].
Cysteine (Cys) is a sulfur-containing amino acid that can be endogenously
synthesized in human cells. The cysteine metabolism is showed in Fig. 1.2. Besides
supporting protein synthesis, it is also the precursor for many biomolecules like
glutathione, hypotaurine, taurine and inorganic sulfates [2]. The concentration of
cysteine is tightly controlled in cells. While low cysteine levels might be associated
with cardiovascular disease [3] and hematopoiesis decrease [4], high concentration
of cysteine was toxic to cells. For example, high levels of intracellular cysteine
could induce DNA damage by driving the Fenton reaction [5]. In addition, high
plasma concentration of cysteine was associated with development of rheumatoid
arthritis [6], Parkinson’s disease [7], Alzheimer disease [8].
Homocysteine (Hcy) is another sulfur-containing amino acid. Compared to
cysteine (193 µM), homocysteine (9.3 µM) is almost negligible in cells [9]. Similar
.
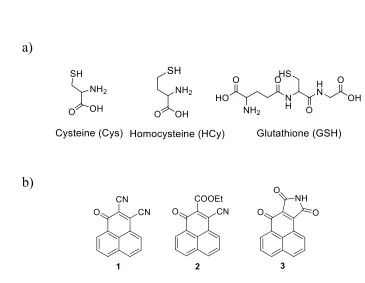
Figure 1.1. Structures of thiol containing molecules and fluorescence sensors. a)
Structures of cysteine, homocysteine and glutathione. b) Structures of three fluorescence turn-on sensors used in this research.
a)
Alzheimer’s disease [12]. Furthermore, total homocysteine concentration in plasma is
related to birth defects and cognitive impairment in old people [13].
Glutathione (GSH) is the most abundant intracellular nonprotein-thiol (1.0-15.0 mM
[14, 15]). It plays a pivotal role in maintaining a reducing environment in cells [16],
acting as the redox regulator [17] and regulating the expression of different genes [18,
19]. A redox homeostasis exists between sulfhydryl and disulfide forms for GSH [19].
Glutathione has also been reported to be involved in many diseases, including cancer
[20], Alzheimer’s [21], and cardiovascular disease [22, 23].
Cysteine, homocysteine and glutathione metabolisms are closely correlated as
shown in Fig. 1.2. For example, homocysteine is the precursor of cysteine [24], while
cysteine is the precursor for the synthesis of glutathione and the rate determine reagent
[25]. The enzyme, glutamate-cysteine ligase (GCL), catalyzes the synthesis of GSH from
cysteine and glutamate [26]. It has been known that the Km of GCL from rat liver is 0.1
mmol/L, which makes glutathione synthesis extremely sensitive to the intracellular
cysteine concentration. This process is reversible when cysteine concentration is low [2].
The relations between these three thiol-containing molecules imply important roles of
cysteine in disease development, progression and treatment [10, 12, 27-29].
1.1.2 Cysteine concentration changes during diseases development
Changes of intracellular and extracellular cysteine concentrations could both work
as signals for cellular responses such as gene expression, protein synthesis and oxidative
stress relief [25, 30]. Recent study had demonstrated that cysteine availability inside cells
homeostasis [31]. Several studies showed cysteine availability from neighbor cells
was essential for cell survival and scavenge of oxidative stress [30, 32].
Cysteine concentration can be modulated by the transportation [33, 34] and
metabolism [2] of cysteine or cystine. Cystine is the oxidized form of cysteine. Once
cystine is imported into cells, it will be reduced to cysteine in a short time [35].
Mutations of key genes in cysteine metabolism pathways were correlated with
abnormal cysteine concentration [30], which might be correlated with disease
development and progression. For example, mice with a knockout in EAAC gene,
which was known to be cysteine transporter in central neuron system, would
develop a mental retardation syndrome similar to Parkinson disease [36]. Similarly,
silencing of cystathionine -lyase led to lower cysteine concentration and mediated
neuro-degeneration in Huntington’s disease mouse model [37].
Because neurodegenerative diseases such as Parkinson disease had a low
glutathione concentration in the plasma [38], it was difficult to track disease
progression using glutathione sensor. In this case, the intracellular level of cysteine
should provide information about signal transduction, nutrition availability and
anti-oxidant effect during disease progression.
1.1.3 Methods to determine cellular cysteine concentration
Several methods have been developed for the measurement of cysteine
concentration, including high performance liquid chromatography (HPLC) [39],
capillary gas chromatography-mass spectrometry [40], capillary electrophoresis
are highly dependent on equipment and hard to be processed in high throughput within a
short timeframe [43]. Thus great efforts have been contributed to the development of
selective fluorescence probe for cysteine detection inside cells recently [44, 45].
Tanaka et al. reported a fluorescence turn-on cysteine sensor in 2004 [44]. However,
the dye had a maximum emission wavelength at 380 nm, which was not within the visible
region and could not be tracked by a regular microscope. Another turn-on
cysteine/homocysteine sensor was developed by Zhang et al. in 2007 to detect the
intracellular cysteine/homocysteine concentration [45], nevertheless the feasibility of the
usage of this dye in live cells staining was questionable.
In 2014, Dr. Honglin Li from our lab published a paper to correct the structure of
cysteine sensor that was reported in Zhang et al.’s paper [46]. Based on this corrected
core structure, we synthesized a family of new probes with turn-on fluorescence property
when reacting with cysteine and homocysteine. In this chapter, the application of these
dyes to detect cysteine/homocysteine in live cells was presented. Since intracellular
cysteine concentration was significantly higher than homocysteine [9, 47], we
hypothesized that the fluorescent signals were predominantly from the reaction with
cysteine.
Cysteine/homocysteine staining protocols in live cells provided information about
cysteine/homocysteine concentration and localization. We were really interested in the
study of breast cancer, thus our methods were applied to determine cysteine
1.1.4 HER2 and breast cancer
Breast cancer is one of the most common types of cancer and a major cause of
cancer-related deaths in women [48]. Certain factors have been reported to influence
prognosis of breast cancer, including size, histological type and grade of the primary
tumor, lymph node involvement, status of estrogen and progesterone receptors and
other biomarkers [49]. Of those markers, the human epidermal growth factor
receptor 2 (HER2) is one of the well-studied ones. Overexpression and amplification
of HER2 have been shown to be correlated with increased disease recurrence as well
as poor prognosis [50, 51].
HER2 is a member of the epidermal growth factor receptor (ErbB) [52]. The
ErbB family includes four members of plasma membrane bound receptor tyrosine
kinases [53]. All four members contain an extracellular ligand binding domain, a
transmembrane domain and an intracellular domain [54]. HER2 could form
heterodimers with any other three receptors [55], of which dimerization would
induce the auto-phosphorylation of tyrosine residues within the intracellular
domains and initiated various downstream signal pathways leading to cell survival
and cell proliferation (Fig. 1.3). Since overexpression of HER2 occured in 15-30%
of breast cancer, drugs targeting HER2 could be used as potential cancer treatment
for HER2 positive patients [50, 51].
HER2 expression levels might be related to intracellular cysteine level. For
example, it was reported that the expression of micro RNA miR-26b, which targeted
a subunit of cystine transporter-SLC7A11 [56], was significantly reduced in HER2+
To study the correlation between HER2 expression and cysteine level, we used
MCF10A cell lines which have been programmed to over express control vector or
HER2 (denoted as MCF20A vector and MCF10A HER2). MCF10A cell line has
low expression of HER2 [58] and does not introduce genetic interference from other
oncogene mutations. Overexpression of HER2 can consistently activate cell survival
and proliferation pathways, which lead to higher tumorigenicity of this breast
epithelial cell line [58]. Thus, MCF10A vector and MCF10A HER2 cell lines could
be used as models for normal breast cells and HER2+ breast cancer cells.
1.2 Results and Discussion
1.2.1 Design of fluorescence turn-on sensors
As showed in Fig. 1.2, a series of fluorescent probes with 1-oxo-1H
-phenalene-2,3-dicarbonitrile core structure have been synthesized in our lab. A unique sensing
mechanism was proposed for this type of sensors (Scheme 1.1): the intramolecular
base promoted oxidative SNArH (nucleophilic substitutions of aromatic hydrogen)
reaction combined with an intramolecular displacement SNAripso (nucleophilic
aromatic substitution) of thiol group by amino groups (Scheme 1.1). All three
sensors react quickly with thiols in the presence of base and much slower under
neutral condition (unpublished data). The absorption spectrum and fluorescence
spectrum of reaction were measured on Varian Cary Eclipse Fluorescence
Spectrophotometer. The maximum absorption peak of sensor 1 was centered at 430
nm (Fig. 1.4.a). Upon reaction with simple thiol-containing compounds, the
Scheme 1.1. Proposed mechanism of the oxidative SNArH and the following SNAripso reaction between sensor 1 and cysteine
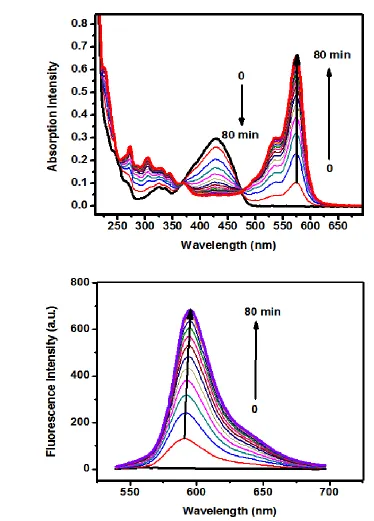
Figure 1.4. Absorption (a) and fluorescence (b) spectra changes of 20 μMsensor 1 in CH3CN from 0 to 80 min upon addition of 100 μM cysteamine.
a)
when reacted with amino acid. The fluorescence spectrum of reaction products showed
peaks centered at 582 nm for simple thiol and 592 nm for amino acid. Due to the lack of
neighboring amino group, such rearrangement reaction would not take place when the
probes reacted with GSH. Instead, the probes could only react slowly with GSH through
a direct thiol-substitution reaction. Because sensors 1-3 nearly showed no fluorescence,
their turn-on property (Fig 1.4.b) and peak shift of fluorescence allowed them to be good
candidates for intracellular cysteine/homocysteine sensing.
1.2.2 Sensing specificity for cysteine
To test the specificity of these turn-on sensors, different substrates including amino
acids, thiol containing molecules (GSH, N-acetyl cysteine), dNTP and protein (bovine
serum albumin) were incubated with sensors for 2 hours to allow reactions processing in
phosphate buffered saline (PBS) (Fig. 1.5. a). The fluorescence was recorded on MDS
SpectraMax M2 microplate reader in 96-well microtiter plates. The folds changes of
fluorescence: (I-I0)/I0(I: fluorescence intensity of indicated solution; I0: fluorescence
intensity of background.) did not change for more than 1 for most substrates (at the range
of -0.45 ~ 0.42). This indicated that all three sensors had comparable low backgrounds in
fluorescence when were incubated with those substrates.
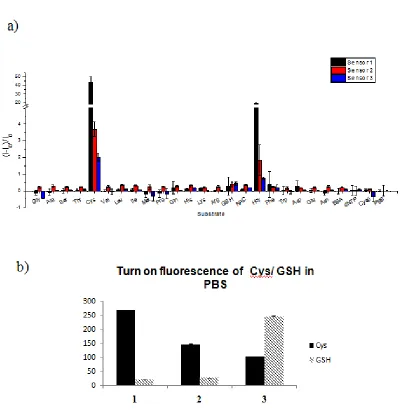
Conversely, the fluorescent intensity of sensor 1 increased for 43.8 ± 6.6 times when
incubated with cysteine. Around 3.7 ± 0.4 and 2.0 ± 0.2 fold increase in fluorescence was
observed for sensor 2 and 3. The fluorescence “turn-on” fold was also observed when
treating with homocysteine, but it was much less profound, i.e. 19.1 ± 0.5 folds increase
Although the sensitivity of sensor 1 was much higher than sensor 2 and 3 on the
detection of cysteine/homocysteine, the standard deviation was also much bigger for
sensor 1 (Fig. 1.5).
The intracellular concentration of GSH was very high and around 1-10 mM
[14, 15], while the intracellular concentration of cysteine was relatively low and
around 50-200 µM [2, 47]. Although we had confirmed that the fluorescent signal
was comparable to background when incubating the sensors with 50 µM GSH, it
might not be the same when GSH concentration was within the intracellular range,
which might be 200 fold higher. To identify the potential interference from high
concentration GSH, we incubated those sensors with either 200 µM cysteine or 5
mM GSH for 2 hours. The fluorescence signals for cysteine/GSH/background were:
sensor 1 (267.5/19.6/4.2), sensor 2 (144.9/26.3/19.1) and sensor 3 (101.3/244.3/34),
respectively (Fig. 1.5.b). This result confirmed the feasibility of using these sensors
for intracellular cysteine detection.
1.2.3 Quantitation of cysteine in vitro
Before using our designed sensors to quantify cysteine, the relationship
between cysteine concentration and fluorescence intensity needed to be
demonstrated. Titrations of cysteine concentration against fluorescence intensity
were performed for all three sensors in DMEM and the standard curves were
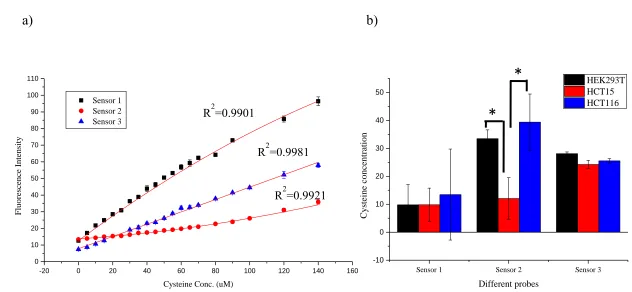
generated (Fig. 1.6.a). Three calibrations were quadratic with coefficients of
determination (R2) value around 0.99. This reliable relation between fluorescent
Figure 1.5. Fluorescence selectivity of cysteine sensor 1-3. a) Fluorescence intensity on different substrate in PBS. All substrate: 50 µM. Gly: Glycine; Ala: Alanine; Ser: Serine;
Thr: Threonine; Cys: Cysteine; Val: Valine; Leu: Leucine; Ile: Isoleucine; Met: Methionine; Pro: Proline; Gln: Glutamine; His: Histidine; Lys: Lysine; Arg: Arginine;
GSH: Glutathione; NAC: N-Acetylcysteine; Hcys: Homocysteine; Phe: Phenylalanine;
Figure 1.6. Quantification of cysteine in vitro. a) Standard curve of sensor 1 (black square), 2 (red circle) and 3 (blue triangle). The polynomial fit of each sensor was showed in red line. b) Quantification of cysteine in cell culture medium. Sensor concentration for a) and b): 1 (10 µM) 2 (10 µM), 3 (50 µM). * indicate p < 0.05.
a)
b)
-20 0 20 40 60 80 100 120 140 160
0 10 20 30 40 50 60 70 80 90 100 110 Sensor 1 Sensor 2 Sensor 3 Fluore sce nc e Inte nsit y
Cysteine Conc. (uM)
Sensor 1 Sensor 2 Sensor 3
-10 0 10 20 30 40 50 Cystein e con centration Different probes HEK293T HCT15 HCT116
*
*
R2=0.9901
R2=0.9981
R2=0.9921
quantify cysteine concentration.
To evaluate the potential application of cysteine sensors in vitro, the concentration
of cysteine in cancer cell conditional medium was measured using this method.
Conditional medium from HEK293T, HCT15 and HCT116 were collected as described
in the experimental section. The medium was incubated with sensors for 0.5 hour and the
fluorescence was recorded. Cysteine concentrations in the medium were calculated from
the calibration. As showed in Fig.1.6.b, the cysteine concentrations in all three cell
culture mediums were around 10 µM measured by sensor 1 and around 25 µM by sensor
3. The reading of concentration for three cell lines was different from sensor 2, i.e.
HEK293T and HCT116 medium were 33.5 ± 3.1 µM and 39.4 ± 10.0 µM while HCT15
was 12.1 ± 7.5 µM respectively. There was no cysteine but only cystine in prepared
mediums for HEK293T, HCT116 and HCT15. While cells were cultured in those
mediums, they could uptake cystine and converted it to cysteine, which were then
released to the mediums and might be used by other cells. From this experiment we found
all three cell types could uptake cystine and convert it to cysteine. The cysteine
concentrations in cell conditional medium were around 40 µM and might be varied
among cell lines.
1.2.4 Cell compatibility of cysteine sensors
After confirming the in vitro application of these sensors, the cell compatibility of
those sensors for live cell imaging was investigated. Sensor 1 and 2 were used to stain the
cells and confocal images were taken to track their fluorescence. Sensor 3 was not tested
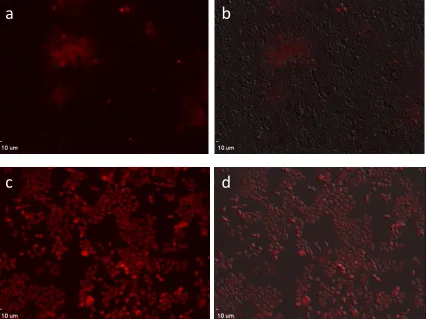
As shown in Fig. 1.7, the staining of sensor 1 was much weaker and not evenly
distributed. This might be attributed to the low solubility of sensor 1 in aqueous
solutions. Sensor 2 showed a brighter fluorescence signal and the staining was
evenly distributed among cells. Since Sensor 2 had better cell compatibility, itwas
used in the consequent live cell imaging studies.
1.2.5 Localization of cysteine/homocysteine in live cells
One advantage of our turn-on fluorescence sensors was the low background, by
which the tracking of cysteine in cells was clearer and more reliable. Cysteine is
distributed all over the cells with enrichment in certain organelles such as
mitochondria and lysosomes for their specific functions inside cells [45, 59]. Sensor
2 had shown an uneven intracellular cell staining. There were regions that had
higher fluorescence signals (Fig. 1.8.c and Fig. 1.8.g). We found that those regions
with higher fluorescence signals were co-localized with both MitoTracker Green and
LysoTracker Green (Life Science). Since intracellular homocysteine is negligible
compared to cysteine, the majority of the fluorescence signal can be attributed to the
reaction with cysteine. Although we have not performed further experiments to
study the local cysteine concentration changes inside cells, it will be extremely
interesting to know the cysteine concentration in specific localizations i.e.
mitochondria and lysosome under different stimuli, especially for cancer cells.
These cells are usually under high oxidative stress [30], which results in higher
1.2.6 Semi-quantitation of intracellular cysteine in live cells
As shown in section 1.2.3, the fluorescence intensity after incubating with sensor
was proportional to cysteine concentration. Because sensor 2 had excellent cell
compatibility, it was possible to use sensor 2 to quantify the intracellular concentration of
cysteine. The intracellular cysteine concentrations are known to be 150 µM [47]. Certain
cell lines, such as Hepg2/C3A, exhibits 3-6 fold changes in cysteine concentration when
cultured with different concentrations of cysteine in medium [11, 60]. We pretreated
Hepg2/C3A and HCT116 for 24 hours with 0 or 400 µM of cysteine in the full culture
medium before the cells were washed and incubated with sensor 2 for 0.5 hour. Confocal
images and flow cytometry were performed to track the intracellular cysteine
concentration. Images from confocal microscope (Fig. 1.9.a) showed much higher
fluorescence intensity in cells treated with 400 µM cysteine, which was further confirmed
by flow cytometry (Fig. 1.9.b). Approximately 1.7 folds increase in fluorescence signal
(Fig. 1.9.c) was observed in both cell lines (results of HCT116 were showed in Fig. 1.10)
for cells incubated with 400 µM cysteine. These staining results confirmed sensor 2’s
function on specifically indicating intracellular cysteine in live cells.
To further study the cysteine concentration in cancer cells, we chose two MCF10A
derived cell lines: MCF10A vector and MCF10A HER2. Cells were incubated with
sensor 2 for 0.5 hour and the fluorescence was tracked by confocal imaging and flow
cytometry. The fluorescence staining (Fig. 1.11) was higher for MCF10A HER2 cells and
flow cytometry results confirmed MCF10A HER2 had higher fluorescence intensity
(7279) than MCF10A vector (4380). It indicated that breast cancer cells had higher
Figure 1.7. Fluorescent images (a, c) and overlay image with bright field (b, d) of HCT116 cell lines stained with 50 µM sensor 1 (upper level) and sensor 2 (lower level) for 0.5 h.
a
b
Figure 1.8. Fluorescence (a-c, d-g) and bright field images (d, h) of live Hepg2/C3A. Upper: Hepg2/C3A was co-stained with 50 µM sensor 2 (red) and MitoTracker (green) for 0.5 h. Bottom: Hepg2/C3A was co-stained with 50 µM sensor 2 (red) and LisoTracker (green) for 0.5 h.
e
f
g
h
a
b
c
d
Figure 1.9. Sensor 2 indicated intracellular cysteine concentration in live cells.
Hepg2/C3A were pretreated with different concentration of cysteine for 24 h and then stained with 50 µM sensor 2 for 0.5 h. a) Confocal images of Hepg2/C3A pretreated with 0 or 400 µM Cysteine then stained with sensor 2 (scale bar: 10 µm). b) Flow cytometry of the Hepg2/C3A pretreated with 0 or 400 µM cysteine (yellow: 0 µM; red: 400 µM). c) Bar graphs showing the fluorescence quantification of the Hepg2/C3A treated with 0 or 400 µM cysteine.
0 µM
400 µM
a)
b)
c)
0 1000 2000 3000
0 µM 400 µM
Fluor
esce
nce
int
ensi
ty
Figure 1.10. Sensor 2 indicated intracellular cysteine concentration in live cells. HCT116 were pretreated with 0 or 400 µM cysteine cysteine for 24 h and then stained with 50 µM sensor 2 for 0.5 h. a) Flow cytometry of the HCT116 pretreated with 0 or 400 µM
cysteine then stained with sensor 2 (yellow: 0 µM; red: 400 µM). b) Bar graphs showing the fluorescence quantification of the Hepg2/C3A treated with 0 or 400 µM cysteine.
b)
a)
0 1000 2000 3000
0 µM 400 µM
Fluor
esce
nce
int
ensi
ty
Figure 1.11. Cysteine concentration in MCF10A Vector and MCF10 HER2 cell lines. a) Confocal images of MCF10A Vector and MCF10 HER2 cell lines stained with sensor 2
(scale bar: 50 µm). b) Flow cytometry of the MCF10A Vector and MCF10 HER2 cell lines stained with sensor 2 (yellow: MCF10A Vector; green: MCF10 HER2). c) Bar graphs showing the fluorescence quantification of the flow cytometry.
MCF10A
Vector
MCF10A
Her2
MCF10A
Vector
MCF10A
Her2
Overlay
a)
b)
c)
0 3000 6000 9000
MCF10A Vector MCF10A HER2
Fluor
esce
nce
int
ensi
1.3 Conclusion
Cysteine, homocysteine and GSH are major thiol-containing biomolecules in
cells. They play important roles in maintaining normal cell state. Homocysteine is the
precursor to synthesis cysteine and cysteine works as precursor for GSH synthesis.
Interferences of thiol metabolism either by mutation of key enzymes or transporters are
proved to be correlated with many diseases, including cardiovascular diseases, cancer and
neurodegenerative diseases. Current methods to measure thiol-containing molecules
include chromatography and fluorescent sensors. Protocols that can specifically assess
cysteine, homocysteine and GSH concentration in live cell are not well developed.
Our lab has synthesized a series of sensors that can selectively detect
cysteine/homocysteine. The reaction was proved to be an intramolecular base promoted
oxidative SNArH (nucleophilic substitutions of aromatic hydrogen) reaction combined
with intramolecular displacement (SNAripso) of thiol group by amino group. Three probes
(1-3) all showed good selectivity towards cysteine/ homocysteine. Standard curves of
three sensors from titration of cysteine fitted polynomial regression with R2 over 0.99.
Sensor 1 and sensor 2 both could react with intracellular concentration of cysteine
but not GSH. Thus, these two sensors were used for in vivo imaging of cysteine/
homocysteine. Because intracellular homocysteine concentration was significantly lower
compared to cysteine concentration, fluorescence was mainly from the reaction with
cysteine.
Both dyes could enter the cells (perhaps by using diffusion mechanism). Sensor 2
demonstrated that sensor 2 could be used to semi-quantify the intracellular
cysteine quantification using a hepatocellular carcinoma cell model. The live cell
imaging not just provided the localization of cysteine but also illustrated a
semi-quantification of cysteine in live cells.
We also confirmed that cysteine concentration was higher in HER2+ breast
cancer cell line: MCF10A HER2 compared to the control cell line: MCF10A Vector.
With sensors 1-3, we improved the study of changes of cysteine under different
conditions or treatments, by which the changes of cysteine levels could be measured
in the progressions of different diseases such as cancer, Parkinson’s disease and
Alzheimer disease.
1.4 Experimental Section
1.4.1 Sensing selectivity test of three sensors
Different substrates (50 µM each for final concentration) was added to 200 µL
either PBS or DMEM with indicated concentration of sensors (sensors 1: 10 µM,
sensor 2: 10 µM and sensor 3: 50 µM) in black 96 well plate with clear bottom
(Greiner 655906). Solutions were incubated for 2 hours at room temperature. The
fluorescence was recorded on a MDS SpectraMax M2 Microplate Reader with
excitation at 560 nm and emission at 600 nm.
1.4.2 Cysteine standard Curve
Different concentrations of cysteine were added to 200 µL DMEM with
50 µM) in black 96 well plate with clear bottom (Greiner 655906). Solutions were
incubated for 2 hours at room temperature. The fluorescence was read on a MDS
SpectraMax M2 Microplate Reader with excitation at 560 nm and emission at 600 nm.
1.4.3 Cell Maintenance
The Hepg2/C3A cell line was purchased from the American Type Culture
Collection (Cat No: HB/8065). Cells were maintained in sulfur amino acid-free DMEM
supplement with 10% fetal bovine serum, 2 mM glutamine, 1 mM sodium pyruvate, 0.1
mM L-methionine, 0.3 mM cysteine and 1× MEM nonessential amino acid solution. The
HCT116, MCF10A vector and MCF10A HER2 cell lines were from Prof. Hexin Chen
(University of South Carolina, Department of Biology Science). The HCT15 cell line was
from Prof. Franklin G. Berger (University of South Carolina, Center for Colon Cancer
Research). The HEK293T cell line was from Dr. Daping Fan (University of South
Carolina, Department of Biology and Anatomy). HCT116, HEK293T cells were
maintained in DMEM-high glucose medium with 10% fetal bovine serum. HCT15 cells
were maintained in RPMI1640 medium with 10% fetal bovine serum (FBS). The
MCF10A Vector and MCF10A Her2 were maintained in DMEM:F12(1:1) medium with
5% horse serum, 10 µg/mL insulin, 20 ng/mL EGF, 100 ng/mL cholera toxin, 0.5 µg/mL
hydrocortisone. Cells were passed every 2-3 days on a (1:8) ratio. All cells were in a
1.4.4 Cell culture medium collection
To determine the cysteine concentration in different conditional medium, 1 ×
106 cells/well HEK293T, HCT15 and HCT116 were seeded in 6-well plates and
allowed to adhere and grow overnight. The medium was then switched to DMEM
medium without FBS and cultured for another 24 hours. The medium was collected,
clarified by centrifugation and used immediately.
1.4.5 Confocal imaging
Confocal fluorescence imaging was performed with Olympus X81 fluorescence
microscopy. Cells were incubated with sensors and (+/-)-Verapamil Hydrochloride
(MP Biomedicals, Cat. No: 195545) for 0.5 hour at 37°C. Fluorescence imaging was
performed after washing cells three times with PBS buffer.
1.4.6 Flow cytometry
Cellular cysteine levels were quantified by flow cytometric analysis. 2 × 10⁵
cells/well HepG2/C3A cells were seed on 6-well plates two days before flow
cytometry. The condition cell mediums with different cysteine concentration were
changed one day before flow cytometry. Cells were trypsinized and 1 × 10⁶ cells
were collected for each sample as indicated. After washing two times with Assay
Buffer (PBS with 0.5% FBS and (+/-)-Verapamil Hydrochloride), cells were
incubated with 50 µM sensor 2 for 0.5 hour at 37°C. The samples were washed once
with Assay Buffer and re-suspended in 0.5 mL Assay Buffer. Stained cells were
CHAPTER 2 Cell Toxicity of DCP Family Probes
2.1 Introduction
2.1.1 DCP family may have potential cell toxicity towards cancer cells
The DCP family of probes have been reported by Dr. Xuhong Qian’s group and his
coworkers as a potential inhibitor for Fibroblast Growth Factor [61]. Using
enzyme-linked immunosorbent assay (ELISA), three compounds were found to be active in
inhibiting the activation of the Fibroblast Growth Factor Receptor 1 (FGFR1). Cell
studies also confirmed their function in anti-proliferation of tumor cells [61]. More
papers on the DCP derivatives were published in 2011 and 2013 [62, 63]. Certain DCP
analogues could specifically inhibit the activation of the B-Cell Lymphoma 2 (Bcl-2) and
Myeloid Cell Leukemia Sequence 1 (Mcl-1), thus induced apoptosis in tumor cells [62,
63].
Recently, we found the structures assigned in both Xuhong Qian and Zhichao Zhang
groups’ papers were not correct [46]. Dr. Honglin Li from our group confirmed the core
structures of the DCP family compounds as 1-oxo-1H-phenalene-2,3-dicarbonitrile. To
further investigate the potential roles as antitumor agents for these molecules, a series of
DCP derivatives were synthesized. The function of those analogues as antitumor drugs
was discussed in this chapter.
We used MCF10A cell lines that had been programmed to over express control
lines and the cell viability was tested. The related signaling pathways were also
investigated in order to discover the target of those molecules.
2.2 Results and Discussion
2.2.1 Structure of DCP derivatives
The DCP family probes were shown in Fig. 2.1. They share the same
1-oxo-1H-phenalene-2,3-dicarbonitrile core structure, with different side chains. Previous
studies from Dr. Qian’s lab showed molecules with thiol containing side chains at
position 3 could inhibit tyrosine kinase activation, including FGFR1, FGFR3 and
VEGFR1. As we known, receptor tyrosine kinases were highly conserved in their
intracellular C-terminal, which was responsible for the kinase activity. We therefore
hypothesized that DCP family derivatives, which may be an inhibitor of kinase
activity, might also inhibit HER2 activation. To test this hypothesis, our lab
modified the core structure at position 6 and position 9 of DCP with thiol-containing
side chain, azide-containing side chain and nitro-containing side chain for screening
the impact of derivatization of DCP on HER2 inhibition.
2.2.2 Cytotoxicity of DCP and derivatives
The treatment for HER2 positive breast cancer was by a monoclonal antibody
(Trastuzumab) [64]. Other small molecules as HER2 tyrosine inhibitors also
underwent active clinical trials for their advantages in synthesis and treatment [64].
To screen for HER2 specific drugs, we chose MCF10A cell lines which were
consistently over-expressing either control vector or HER2, namely MCF10A Vector
Figure 2.1. Structure of DCP and its derivatives tested in our study.
considered as normal breast tissue model while the MCF10A HER2 cell line could be
considered as HER2+ breast cancer model. We screened all molecules at 1 × 10⁻⁶ M or 1
× 10-5 M for 24 hours using cell viability assay.
The results of the cell viability assay were showed in Fig. 2.2. Star in the figure
indicated a significant difference in viability between MCF10A control and HER2
cell lines by student t test with 95% confidence interval. At 1 µM, all DCP probes
did not show significant toxicity. None of them could kill more than 50% cells. At
10 µM, several members like DCP8b, sensor 1 and sensor 3 showed over 50%
toxicity towards MCF10A HER2 cell line. DCP8b killed 66.3% cells while sensor 1
killed 94.8% cells and sensor 3 killed 85.3% cells. The student t test of viability
between MCF10A vector and MCF10A HER2 groups indicated sensor 3 preferably
killed MCF10A HER2 cell lines. Therefore, sensor 3 might be a good candidate for
HER2 breast cancer treatment. Interestingly, DCP8a, which was only different from
DCP8b by the position of side chain, was much less toxic than DCP8b.
According to NCI anti-cancer drug screening procedures [65, 66] in cell lines,
IC50 (the concentration of treatment to kill 50% cells) should be less than 1×10⁻⁴ M
to be considered for further studies. Thus, DCP candidates that could kill more than
50% MCF10A HER2 cells were chosen (50% cell viability was showed in red dash
line) for later downstream signaling pathway studies.
2.2.3 Signaling pathway targeted by drug candidates
To study the possible signaling pathways affected by drug candidates,
Western-blots were performed to study the major cell signaling pathways in breast cancer
Figure 2.2. Toxicity of DCP family probes in different breast cell lines. a) The toxicity of 1 µM DCP family probes treatment. b) The toxicity of 10 µM DCP family probes treatment. Probes were incubated with cells for 24 h at indicated concentration. Star indicates significant difference in toxicity between MCF10A vector and MCF10A HER2 cell lines by student t test with a 95 confidence interval. The red dash line is the 50% cell viability line.
0 20 40 60 80 100 120 Percentage
10 μM DCP toxicity at 24 hour
MCF10A Vector MCF10A Her2
b)
a)
0 20 40 60 80 100 120 Percentage1 μM DCP toxicity at 24 hour
Cells were lysed and proteins were collected. Activation of ERK (Extracellular signal
Regulated Kinases), Akt (Protein Kinase B), Caspase-3 (cysteine-dependent
aspartate-directed protease-3) and HER2 were probed by Western-blot with collaboration with Dr.
Hexing Chen’s group, which showed DCP8b, sensor 1 and sensor 3 led to less activation
of HER2 (Fig. 2.3). This indicated that these molecules might interfere with HER2
activation. As comparison, DCP8a did not affect the activation of HER2 at all.
As shown in Chapter 1 (Fig. 1.3), there were mainly two pathways for the
downstream activation of HER2. One was the ERK pathway that led to cell
proliferation and the other was the Akt pathway that helped cell survival and
protects from apoptosis. Thus inhibition of ERK might lead to abolishment of
proliferation, while the inactivation of Akt might lead to the activation of Caspase-3.
As Caspase-3 was a member of caspase family, this might lead to programmed cell
death (apoptosis) [67]. The results from the down-stream signaling pathway (Fig.
2.4) showed that sensor 3 might achieve its specific toxicity towards HER2 cell line
by inactivation of ERK and activation of Caspase-3.
DCP8b seemed to induce the inactivation of ERK and slight activation of
Caspase-3.This might explain the toxicity of DCP8b by inhibiting cell proliferation
and activating apoptosis. Both DCP8a and DCP8b inactivated Akt, but DCP8a did
not affect the other two pathways. The differences in toxicity and downstream
signaling pathway might be caused by the different structures of DCP8a and DCP8b,
or DCP8a and DCP8b might interact with different targets in the cells. It will be
interesting to study the specific binding targets of each probe in the future. Sensor 1
molecule to Vector and HER2 cells lines might be attributed to some other pathways.
2.3 Conclusion
The core structure of DCP has been reported to be a good candidate as an anticancer
drug. Our lab had successfully synthesized a series of DCP derivatives. To assess those
probes’ toxicity on cancer, we chose a specialized cell model for breast cancer. MCF10A
either overexpressing control vector or HER2 (i.e. MCF10A Vector and MCF10A HER2)
were employed in our study to mimic normal breast tissue and HER2+ cancer. Using
these two cell lines, we successfully screened the DCP derivatives and identified four
candidates that have different toxic property: DCP8a, DCP8b, sensor 1 and sensor 3. The
results showed sensor 3 had higher toxic effect on MCF10A HER2 cell lines.
To study the signaling pathway in those treatment groups, we collaborated with Dr.
Hexing Chen’s lab. Western-blots were performed to probe HER2 and its related
pathways. It has been found that Sensor 3 treatment group significantly decreased HER2
activation. This indicated the specificity of toxic towards the HER2 cell line might be due
to the inhibition of HER2. The ERK activation was also decreased, which indicated an
important role of Sensor 3 on ERK activation. Caspase-3 was activated upon Sensor 3
treatment, which meant the apoptosis pathway was also activated in Sensor 3 treatment
group. This study further confirmed that Sensor 3 specific toxicity on HER2+ cell line
might be through the inhibition of proliferation pathway as well as the activation of
apoptosis pathway.
DCP8a is only different from DCP8b by the position of side chain. However, the
DCP8b and targets. The signaling pathways of DCP8a and DCP8b treated cells were
also different. DCP8b inactivated ERK and slightly activated Caspase-3, while
DCP8a only slightly inactivated pAkt. This specific toxicities might be used for
better structure designs of organic probes for HER2+ breast cancer drug.
2.4 Experimental Section
2.4.1 Cell viability assay
The two MCF10A cell lines were seeded in 96-well plates (5 × 10⁴ cells/mL,
100 µL/well). After seeding, cells were allowed to adhere and grow overnight before
the addition of DCP family probes. DCP family reagents were added to the culture
medium of MCF10A and cells were incubated for 21 hours. The CellTiter-Blue
(G8080) from Promega (10 µL) was added to the medium (100 µL). Cells were
continuously incubated for another 3 hours according to the manual. Cell viability
was determined using a Spectra Max M2 Plate Reader by monitoring the absorption
at 595 nm.
2.4.2 Western blots analysis
Cell lysates were prepared and equal amounts of proteins were electrophoresed
on SDS-PAGE gels using standard conditions. The proteins were transferred to
nitrocellulose membranes, which were probed with the following antibodies: total
HER2 (Cell signaling, 4290); phosphor HER2 (Tyr 1221/1222, Cell signaling,
2243); total ERK (Cell signaling, 4695); phosphor ERK (Cell signaling, 9101); total
(Oncogene); GAPDH (Santa Cruz, FL-335). The antibody dilutions for all detection of
CHAPTER 3 Surface Glycan Localization and Purification
3.1 Introduction
3.1.1 Glycosylation
Glycosylation is a critical post-translational modification (Fig. 3.1). Protein,
lipids, tRNA and many secondary metabolites can be modified by glycosylation
[68]. For example, glycosylation of proteins, which is important for protein folding,
trafficking and stability [69], may govern biological homeostasis and affect organ
development [70]. Glycoproteins comprise ~ 50% of the total cellular proteome
and > 90% of the secreted proteome [71, 72]. Besides adding diversity to the protein
structure, protein glycosylation may also modulate signal transduction and other
functions. Glycosylation inside cells is mainly involved in intracellular signal
pathways while protein glycosylation on the cell surface supports the
communication and responds to extracellular stimuli [73, 74].
Alterations in the glycosylation include changes in the sites occupied by
glycans and the glycan structures [75, 76]. Disruption of normal glycosylation is
associated with hereditary and chronic disease such as cancer, diabetes,
cardiovascular, inflammatory, neurological and neuromuscular diseases [75-77]. The
glycoproteins in these diseases have been broadly studied for the purpose of
glycoproteins, protocols of imaging and enrichment of glycoproteins are still in demand.
3.1.2 Glycoproteomics and Glycomics
Glycoproteomics and glycomics refer to two approaches used for the
characterization of specific targets’ (i.e. cell, tissue or organ) glycoproteome and
glycome from an extracted protein mixture (Fig. 3.2) [75, 76, 79, 80]. For
glycoproteomics, glycosylated proteins were enriched with certain techniques and
then analyzed by LC/MS/MS (Liquid Chromatography/Mass Spectrometry/Mass
Spectrometry) for protein species and glycosylation sites [80]. For glycomics
analysis, the glycans are usually released from the glycomolecules and the
composition and structure are analyzed either by mass spectrometry separately or
with chromatographic techniques [80].
Three different approaches were often applied to glycoproteomics: lectin
affinity chromatography [81], antibody affinity chromatography [82] and metabolic
labeling followed by specific interaction or reaction chromatography [83].
Depending on the methods chosen for enrichment and data analysis, the databases of
glycoproteomics and glycomics might have variety among study groups. Thus,
integration of all databases became more and more important. Certain programs
Figure 3.2. Schematic figure of protocol for glycoprotein purification using azide-alkyne cycloaddition reaction. Azide labeled non-natural sugar will be incubated with cells. After reacted with alkyne conjugated reporter, glycoprotein will be enrichment by
chromatography and applied to LC/MS/MS analysis. Figure was adapted from “Slade P.G. et al, 2012, J of proteome Res.” paper with copy right permission.
3.1.3 Click chemistry and its applications in bioorthogonal chemistry
Click chemistry is very often used in the imaging and enrichment of
glycoproteins. Click chemistry is first reported by Dr. Sharpless group in 2001 [86].
It refers to certain reactions that is modular, wide in scope, high yields, generate
inoffensive byproducts and be stereospecific [86]. One of the most famous click
reactions is the azide-alkyne cycloaddition using Cu(I) as the catalyst [87].
As showed in Fig. 3.3, using this reaction and analogue reactions, some
companies have developed certain kits with alkyne or azide conjugated beads to
enrich glycosylated proteins [79, 88]. Fluorescence probes with azide or alkyne
groups were also synthesized to determine the localization of target molecules
which could be labeled by corresponding alkyne or azide [89].
Because copper might be toxic to live cells, Bertozzi and coworkers introduced
two reactions that had better biocompatibility with intracellular environment and
coined them as bioorthogonal reaction [90, 91]. Bioorthogonal reactions are
chemical reactions that can occur inside of living systems without interfering with
native biochemical processes [90]. One of the bioorthogonal reactions is called
Staudinger ligation reaction, which allows azide react with triacrylphosphines (see
Fig. 3.3) in live cells [92]. As first reported for bioconjugation usages in 2000 by
Dr. Bertozzi’s group [90], this reaction has already been applied to imaging and
protein enrichment in live cells and mice [91, 93]. The other reaction is termed
Strain-promoted alkyne-azide cycloaddition (SPAAC) [94]. This reaction between
azide and cyclooctynes has a faster reaction rate and do not need a copper catalyst
Figure 3.3. Bioorthogonal reactions for proteins labeling. Three reactions were shown here: Staudinger ligation, Cu-catalyzed Azide-Alkyne Cycloaddition and Strain Promoted Azide-Alkyne Cycloaddition reactions. Figure was adapted from book “Mass
3.1.4 Bioorthogonal chemical reporters for glycoprotein labeling
Bioorthogonal chemical reporters are non-natural molecules which could be
incorporated into different biomolecules like glycan, protein and RNA in vivo
without interrupting the molecular properties [86]. They may containing small tags
i.e. azide and alkyne, which are small in size and metabolically stable [88, 95]. To
study protein glycosylation, saccharides precursors tailored with such kind of tags
were designed, synthesized and applied to label glycans [88]. Some typical reporters
for the biorthogonal labeling of different saccharides are showed in Fig. 3.4.
Basically, those bioorthogonal saccharides precursors (Fig. 3.4) may be
incorporated to glycans through different endogenous salvage pathway [96, 97]. As
a result, the azide/alkyne groups can be presented on the glycosylated proteins. By
reacting with the affinity reporters (e.g. biotin motif or microbeads), glycoproteins
could be enriched for downstream analyses like Western-blot, in-gel imaging and
mass spectrometry [73, 88, 91, 96, 98]. Labeled glycoprotein can also be imaged in
live cells or animals with fluorescent reporters [92]. For example, using a
DIFO-Alexa Fluor 488 conjugate, Bertozzi’s group has successfully imaged the
Figure 3.4. Structures of bioorthogonal chemical reporter for glycosylation. Figure was adapted from book “Mass Spectrometry of Glycoproteins: Methods and Protocols, B.W.Zaro, et. al.” with copy right permission.
3.1.5 Applications of bioorthogonal chemical reporters in glycosylation studies
Bioorthogonal reporters have variety applications in the study of glycosylation.
Among them, protocols of glycoproteins imaging and enrichment are well
established [79, 88, 95, 98, 99].
Different fluorescent probes have been used to image glycoproteins [88, 95,
98]. For example, quantum dots, which were great fluorescent reporters with less
photo bleach and increased brightness [100], have been applied to the imaging of
glycosylation. As it could be modified in variety ways, this technique had not only
been applied to the imaging of glycoprotein [101, 102] but also used to interrupt
glycoprotein interactions [103, 104]. Another imaging technique using
dibenzocyclooctyl conjugated fluorescent probes was also broadly studied. Although
different techniques were applied to the imaging of glycosylation, no detailed
reports were published to compare the effect of those staining protocols. Depending
on the properties of fluorescent probes, different information of glycosylation may
be provided by those protocols. To image glycoproteins in cell compartments, two
fluorescent probes including fluorescein and
dibenzocyclooctyl-quantum dots were applied to breast cancer cell lines in this chapter. Both the total
glycosylation and the membrane specific glycosylation were tracked using these two
probes. The experiments provided versatile information on the localization of
glycoproteins in breast cell models.
Recently, purification of bioorthogonal reporter labeled glycoprotein has
become commercially available [79, 83, 99]. However, the nonspecific binding of
protocol for glycoprotein, our lab synthesized Si-alkyne beads with a disulfide bonds,
which could be used to release glycoproteins after enrichment. This may minimize the
background from non-specific binding as well as increase the recovery of glycoproteins
by this specific releasing procedure using disulfide [99].
3.2 Results and Discussion
3.2.1 Structures of fluorescent probes
Two different fluorescent probes were used in our study. One was
DBCO-fluorescein by conjugating DBCO-fluorescein to dibenzocyclooctyl (Fig. 3.5.a). The other is
called DBCO-QT which used CdSe/CdZnS quantum dots as fluorescence cores and
coated by polymers (PEG: Imidazole: Amine = 4:4:2) functionalized with
dibenzocyclooctyl (Fig. 3.5.b). This DBCO-QT was designed and synthesized by our lab
in collaboration with Dr. Andrew Greytak’s lab (Department of Chemistry and
Biochemistry, University of South Carolina). The properties of fluorescent cores
determined the localization and the detection limits of the fluorescent probes.
DBCO-fluorescein, as a small organic fluorescent probe, can diffuse into cells and react with
targets all over the cells. Thus, it may image the total glycoproteins. As the diameter of
quantum dots is around 3 nm, it can hardly diffuse into cells, which lead to the reaction
sites limiting to the cell surface. Also the strong fluorescence from quantum dots helped
to bring up the weak signal from cell membrane. The schematic labeling process is
Figure 3.5. Structures of fluorescent probes for labeled glycoproteins. Structures of a) DBCO-FL fluorescein) and b) DBCO-QT (Dibenzocyclooctyl-quantum dots).
CdSe CdZnS
DBCO-QT DBCO-FL
Figure 3.6. The schematic illustration of metabolic labeling and detection of
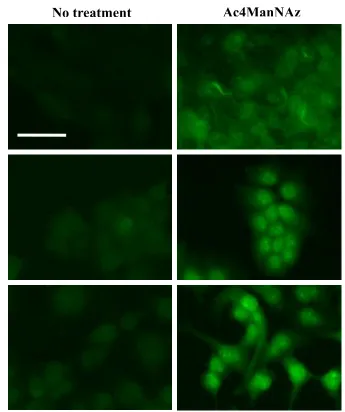
3.2.2 Staining results of DBCO-fluorescein
azidoacetylmannosamine-tetraacylated (Ac4ManNAz) and
azidoacetylgalactosamine-tetraacylated (Ac4GalNAz) could be processed by the
N-acetyl-D-mannosamine (ManNAc) and N-acetylgalactosamine (GalNAc) salvage
pathways and incorporated into glycosylated proteins [96, 105, 106]. Ac4ManNAz
labeled those glycoproteins with sialylated glycans [106]. Ac4GalNAz was mostly
incorporated as GalNAz for O-glycosylation [96]. Since sialylated glycans were
always at the end while GalNAc was the first saccharide in O-glycosylation [107],
Ac4ManNaz might be incorporated to the end of glycans and Ac4GalNAz might be
the first one.
Glycosylation of proteins was different for cancer and normal cells. Not only
more sialic acids were incorporated into glycans, but also sialylated glycoproteins
were very often overexpressed in cancer cells [108-110]. With the Ac4ManNAz and
Ac4GalNAz synthesized by Dr. Li Cai (Division of Mathematics and Science,
University of South Carolina, Salkehatchie), we successfully labeled and imaged
glycoproteins in MDA-MB-231 cell lines [111]. Because breast cancer cells might
have higher level of sialylated proteins compared to normal cells, a higher level of
cell membrane localized fluorescence was expected in cancer cells labeled with
Ac4ManNAz. To prove this, another two breast cell lines, MCF10A and MCF7
were chosen. These three cell lines could be used to represent for different stages of
breast cancer, normal state (MCF10A), proliferation state but not metastasis (MCF7)
![Figure 1.2. Schematic illustration of the cysteine metabolism pathways [2, 11]. Cysteine can be synthesized from homocysteine and serine and it is the precursor for glutathione](https://thumb-us.123doks.com/thumbv2/123dok_us/8432320.1387958/21.612.105.502.79.423/schematic-illustration-metabolism-cysteine-synthesized-homocysteine-precursor-glutathione.webp)