University of Massachusetts Amherst University of Massachusetts Amherst
ScholarWorks@UMass Amherst
ScholarWorks@UMass Amherst
Masters Theses Dissertations and Theses
March 2015
Driver Behavior Evaluation of Variable Speed Limits and a
Driver Behavior Evaluation of Variable Speed Limits and a
Conceptual Framework for Optimal VSL Location Identification
Conceptual Framework for Optimal VSL Location Identification
Curt P. Harrington
University of Massachusetts Amherst
Follow this and additional works at: https://scholarworks.umass.edu/masters_theses_2
Part of the Civil Engineering Commons, Construction Engineering and Management Commons, and the Other Civil and Environmental Engineering Commons
Recommended Citation Recommended Citation
Harrington, Curt P., "Driver Behavior Evaluation of Variable Speed Limits and a Conceptual Framework for Optimal VSL Location Identification" (2015). Masters Theses. 154.
https://scholarworks.umass.edu/masters_theses_2/154
This Open Access Thesis is brought to you for free and open access by the Dissertations and Theses at ScholarWorks@UMass Amherst. It has been accepted for inclusion in Masters Theses by an authorized administrator of ScholarWorks@UMass Amherst. For more information, please contact
DRIVER BEHAVIOR EVALUATION OF VARIABLE SPEED LIMITS
AND A CONCEPTUAL FRAMEWORK FOR OPTIMAL VSL
LOCATION IDENTIFICATION
A Thesis Presented By
CURT P. HARRINGTON
Submitted to the Graduate School of the
University of Massachusetts Amherst in partial fulfillment of the requirements for the degree of
MASTER OF SCIENCE IN CIVIL ENGINEERING February 2015
DRIVER BEHAVIOR EVALUATION OF VARIABLE SPEED LIMITS
AND A CONCEPTUAL FRAMEWORK FOR OPTIMAL VSL
LOCATION IDENTIFICATION
A Thesis Presented By
CURT P. HARRINGTON
Approved as to style and content by:
_______________________________
Michael A. Knodler, Jr., Chair
_______________________________
Eric Gonzales, Member
_________________________________________
Richard N. Palmer, Department Head
DEDICATION
I dedicate this thesis to my loving and undeniably supportive parents Kevin and Judy and brother Ryan, and in loving memory of my sister Brooke of whom I live in honor of each
ACKNOWLEDGMENTS
First and foremost, I would especially like to thank Dr. Michael Knodler, my advisor, professor, and my part-time psychologist. His unwavering guidance, support, personality and work ethic inspired me to get into transportation engineering and to complete this thesis. Dr. Knodler’s complete dedication to his field, family and students is absolutely unmatched.
I would also like to thank the UMass Transportation Center for funding my assistantship; Robin Riessman for moderating the focus groups and providing her
expertise on such; Dr. Eric Gonzales for rounding out my thesis committee and providing excellent feedback; Dr. Mi-Hyun Park and my GIS class partners for assisting in the data analysis; Dr. Eleni Christofa for kick-starting my thesis idea; and all of my classmates and friends for being nothing short of helpful, friendly and fun when I needed it most.
Lastly, I would like to thank my parents for pushing me to fulfill my potential, to become a well-balanced man, and to relentlessly chase my dreams.
ABSTRACT
DRIVER BEHAVIOR EVALUATION OF VARIABLE SPEED
LIMITS AND CONCEPTUAL FRAMEWORK FOR OPTIMAL VSL
LOCATION IDENTIFICATION
February 2015
CURT P. HARRINGTON, B.S.C.E., UNIVERSITY OF MASSACHUSETTS
AMHERST
M.S.CE., UNIVERSITY OF MASSACHUSETTS AMHERST
Directed by: Professor Michael A. Knodler, Jr.
Static speed limits are the norm across the world’s roadway networks. However, advances in technology and increased applications in intelligent transportation systems (ITS) provide a mechanism for upgrading traditional speed limits into an active traffic management system. More specifically, variable speed limits (VSLs) can be used in high crash severity locations and in real-time congestion and weather events to increase traffic safety and operations. Much of the available literature on VSLs focuses upon crash prediction algorithms for VSLs, simulations, and effectiveness of real-world VSL implementations. One noticeable gap in the existing literature is related to driver compliance under varied configurations of alerting drivers of the variable speeds. An additional gap in literature is related to existence of a conceptual framework for identifying optimal corridors for potential VSL implementation.
Within this thesis drivers’ willingness to comply with VSLs was investigated via focus groups and static surveys during the experimental process. Connections are made between driver speed choice and type of speed limit condition including uniform speed
limit (USL) versus VSL, overhead mount versus side mount, presence of an explanatory message, and the numerical speed limit value. An analysis of the survey results was completed to isolate critical factors in VSL compliance. Opinions and perspectives on VSLs are derived through the focus group sessions
Lastly, a case study approach is presented in which a region is chosen, and implementation metrics are analyzed on the major roadway networks using a GIS platform to create a composite ranking system for potential optimal VSL corridors. The study aims to be used as a foundation to justify use of certain types of VSLs in addition to creating a conceptual framework for VSL implementation zone identification.
TABLE OF CONTENTS
Page
ACKNOWLEDGMENTS ... iv
ABSTRACT ... v
LIST OF TABLES ... viii
LIST OF FIGURES ... viiix
CHAPTER 1. INTRODUCTION ... 1 Problem Statement ... 3 Scope of Research ... 3 Research Objectives ... 4 2. BACKGROUND ... 6 Previous VSL Applications... 6
Crash Prediction and Risk Analysis for VSL Implementation ... 8
Crash Hotspot Identification Methods ... 11
3. METHODOLOGY ... 13
Perform Literature Review ... 13
Static Survey and Focus Group... 14
Formulation of an Optimal VSL Location Identification Algorithm... 21
4. RESULTS AND ANALYSIS ... 27
Focus Group and Static Survey... 27
VSL Corridor Optimization ... 40
5. CONCLUSIONS AND RECOMMENDATIONS ... 48
Static Survey and Focus Group Conclusions ... 48
VSL Corridor I.D. Framework and Case Study Conclusions ... 51
APPENDICES A. FOCUS GROUP MODERATOR'S GUIDE……….55
B. SPEED SELECTION SURVEY………...63
LIST OF TABLES
Table Page
1. Critical Factors in VSL Survey ... 17
2. Summary of Survey Scenarios ... 20
3. EPDO Weighting Scheme... 23
4. Weather Conditions ... 24
5. Key Critical Factors Discussion Points... 29
6. Key Outside Factors Discussion Points ... 30
7. Road Surface Conditions Results (2011-2013)... 41
8. EPDO Results (2011-2013) ... 42
9. Bottleneck Results (2011-2013) (CMRPC) ... 43
LIST OF FIGURES
Figure Page
1. Algorithm for variable speed limits (Konokov et. al)...9
2. Example Static Survey Scenario ... 19
3. MassSafe Data Warehouse ... 24
4. Poor Road Surface Condition Crash Density... 25
5. EPDO Crash Density ... 26
6. Compliance Measures of All Scenarios ... 34
7. Overhead vs. Side Mount Speed Differentials ... 34
8. Variance among Location and Speed Limit Altercations ... 35
9. Effects of Warning Message on 45 mph VSL Speed Selection ... 37
10. 3 Lane vs. 2 Lane Highway Speed Choice Differences... 38
CHAPTER 1
INTRODUCTION
Managing speed by means of speed limits is integral in ensuring highway safety and efficiency. Setting speed limits has long been considered a technical exercise that attempts to find a suitable trade-off between mobility and traffic safety that is rooted in driver expectancy. As defined by law, speed limits are meant to show the maximum safe and reasonable speed under normal roadway conditions (1). However, traditional speed limit signs, which are static in nature, are unable to adapt to changing roadway
conditions, such as traffic congestion or environmental and meteorological concerns. There is a legitimate need for a sustainable active traffic management system solution to mitigate current and future highway safety and congestion needs. The highway
motorist’s current and future needs are continually changing due in part to an increased number of vehicles on the road as well as weather event unpredictability and intensity due to climate change. A projected 1.7 billion vehicles are expected on roads worldwide by 2035- approximately double the amount of cars as of 2013 (2). If speed limits need alteration due to changed or real-time conditions, the installation of variable speed limits may be warranted. Variable speed limits can be defined as intelligent electronic speed enforcing signs that change in conjunction with traffic and weather –related roadway conditions. VSL infrastructure can include but is not limited to: digital color video cameras to detect vehicle traffic volume, speed and classification; a meteorological station to determine precipitation type and rate, wind speed, temperature and humidity; variable message and speed limit signage; and data communication systems that include
algorithmic design for real-time speed limit adjustment. VSLs have the potential to reduce recurrent congestion, address adverse weather impacts on highways, and improve traffic safety by buffering traffic shock waves and homogenizing speeds (3). In theory, vehicle operators may adhere to variable speed limits more than static ones because they correlate more with actual highway conditions in real-time which in turn leads to better driver awareness and obedience (4).
The literature reviewed herein is best separated into three sections: Previous VSL Applications, Crash Reduction Prediction, and Crash Hotspot Identification. By
reviewing the results of real-world VSL applications in combination with research into crash prediction and hotspot identification, a conceptual framework for identification of high potential corridors to implement VSLs can be confidently made. A conceptual flow algorithm for effective VSL corridor identification can be derived from past VSL studies and case studies. A case study using Central Massachusetts is used as an example to work through the identification algorithm to identify top locations for implementation. This thesis provides a methodology and results for evaluating driver compliance to VSLs in addition to designing a streamlined framework for agencies and authorities to choose and justify VSL corridors in their region.
Problem Statement
There is a need for a means to evaluate driver behavior and compliance to variable speed limits. Previous studies acknowledge safety benefits, yet fail to correlate driver behavior in VSL corridors.
It is readily apparent that there is sufficient information on the potential for VSLs to provide safety benefits in certain roadway conditions, especially in Europe, however there is not the same magnitude of information related to VSL implementation studies in the United States. There is a need for a deeper understanding of how drivers interact with variable speed limits in addition to how agencies can efficiently select corridors to
implement VSLs. Up to this point, there has been no data-driven methodical approach towards finding such roadway sections.
Explicitly, a correlation is needed to be made between driver speed choices and the type of speed limit condition to measure the effectiveness of VSLs. This will allow a better understanding of which condition real-world agencies should choose to increase effective speed harmonization.
Scope of Research
This research examines drivers’ attitudes and behaviors towards VSLs using a focus group setting. Speed selection and opinions and perspectives on VSLs are targeted in these sessions. Also of note, there are numerous variables that may contribute to driver speed choice in a static setting, however this study will isolate only variable speed limit signage. Although there are many conditions that are assimilated with the use of VSLs such as poor weather conditions, police enforcement, and road conditions and
congestion, these will be held constant in effort to eliminate any confounding behaviors on the survey. This research did not investigate VSLs that are configured on a per-lane basis, as are seen in some European countries. Additionally, VSLs with speed limits above the normal (e.g., current typical) roadway’s posted limit were not included within the scope of this research; however, this topic may be a future consideration given the national attention associated with the idea of increasing the speed limit to decrease speed variance in certain highway corridors as a measure of improving safety.
Lastly, a case study of spatial and composite ranking analysis of filtered crash data in Massachusetts between 2011-2013 is done to develop an algorithm for identifying optimal VSL corridors. The data considered is reflective of the most readily available data at the time the research was being completed.
Research Objectives
Based upon the existing research needs and problem statement, a series of proposed research objectives is set forth. Specifically, the research goals are as follows:
Objective 1: Evaluate driver behavior and speed selection with various VSL configurations. Identify drivers’ critical isolating factors in the speed selection process for VSL implementation in addition to obtaining their opinions and perspectives on VSLs.
Objective 2: Create a streamlined data-driven conceptual framework for
potential candidate locations for VSL implementation in a case study to work backwards towards developing a location selection algorithm.
CHAPTER 2
BACKGROUND
Given the prevalence of VSL usage worldwide, there is a significant amount of literature related to the topic. Much of the existing literature associated with VSLs is related to crash prediction, hotspot identification, and previous VSL applications. The literature relevant to the current research effort was reviewed and is summarized in the following sections.
Previous VSL Applications
Manually adjusted variable speed limits were first introduced in Germany in the year 1965 (5). Years later, in the 1970s, Germany installed automatic VSLs on parts of their A8, A5, and A3 highways and rural autobahn. The determination of speed limits in VSL-controlled zones was based on a rudimentary algorithm taking into account traffic and environmental data. The crash rate was reduced by 20-30 percent where VSLs were deployed in both regulatory and advisory contexts (6). Today, there are over 800 km of variable speed limit-controlled highways in Germany (5). In 1991, the Netherlands introduced a variable speed limit system that detected visibility and traffic incidents. The speed reduction results were significant; drivers reduced their speeds by an average of 5-6 mph. To smooth traffic flows on the M25 highway in the United Kingdom, a VSL system was implemented in 1995, in which a 10-15 percent crash reduction was
measured post-installation. In Finland circa 1994, sixty-seven variable speed limit signs and thirteen variable message signs were installed over a fifteen mile section of highway. The primary motive for installation was to reduce winter weather related accidents; 95
percent of motorists interviewed post-VSL installation endorsed the new system (5). Later in the 1990s in Finland, a study further investigated the effects of weather-related VSLs for slippery roads. Inductive loop detectors were used to obtain speed data from a roadway that changed speeds from 100 km/h to 80 km/h in slippery conditions. In the winter, the mean speed reduction caused solely by the VSL (weather-related speed reduction removed) was 3.4 km/h. In slippery road conditions, the mean speed due to sign placement reduced by 1.8 km/h. Speed variance was also significantly decreased which is a critical way to reduce crash occurrence (7).
Lee et al (2006) used microscopic traffic simulation on the Gardiner Expressway in Toronto, Canada to examine the effects of reducing speed limits upstream of
bottlenecks on crash potential and travel time. They found that it is optimal to establish speed limits that are the average of the upstream and downstream speeds, as rapid
deceleration, and high speed variance are known to cause crashes. The researchers found that crash potential could be reduced by 5-17percent using VSLs in appropriate situations without significantly increasing travel time (8).
Li et al (2007) used loop detectors to generate aggregated traffic data along I-880 in Oakland, California and combined this information with historical crash data to
develop a Rear-end Collision Risk Index (RCRI) as a model to identify locations prone to crashes (9).
In 2009, a variable speed limit system was introduced on some parts of the southbound C31 and C32 highways in the Barcelona Metropolitan Region of Spain. The variable speed limit implementation was found to generally improve traffic uniformity, treat shock waves, and reduce average speed and speed variability (10).
Environmentally, the system was proven to be an improvement as well- the variable speed policy reduced NOx and PM10 by 7.7-17.1 percent and 14.5-17.3 percent respectively.
Sabawat and Young (2013) developed a methodology to reduce speed limits on rural corridors in Wyoming based on weather and real-time speeds. They observed high compliance and less speed variation than before implementation (11). Yu and Abdel-Aty (2014) examined how real-time traffic and weather data can influence severity of crashes in mountainous terrain. The variables they considered included snow, grade, speed standard deviation, and temperature. Results showed that these variables had a significant impact on crash injury severity (12).
Crash Prediction and Risk Analysis for VSL Implementation
Improving traffic safety is an essential motive for the implementation of variable speed limits. To properly implement VSLs at locations to reduce crash probability, qualitative and quantitative data must be obtained that demonstrate the best ways to determine when and where a crash is most likely to occur. Lee et.al identifies three main variables that best represent crash precursors: coefficient of variation of speed, average traffic density, and average speed difference between the upstream and downstream sections of a roadway. These crash precursors are input into a real-time crash prediction model with external controls such as peak hours and road geometry. A microscopic traffic simulation model was used (PARAMICS) and multiple combinations of speed limit control strategies and durations of intervention were used at high and low crash potential thresholds. Total crash potential in this simulation decreased with lower
variable speed limits when 5-minute intervals were used. An important finding here is that total crash potential was significantly reduced with just a small increase in travel times due to VSLs (13).
It is known that elevated speed variability leads to freeway crashes. Abdel-Aty et al implements VSL at a speed difference of 7 mph, based on a study by Cunningham that found 7 mph to be the critical range in which crash-rate increases significantly. Using a 60percent free-flowing loading in PARAMICS to simulate the best possible VSL treatment, network travel time decreased by 0.8 percent (14).
Konokov et. al similarly attempted to find a quantitative indicator of crash potential to best predict when a crash is going to occur. Studies performed at various times of day and various lane configurations on multiple highways all demonstrated a common theme; all results showed a point where total crash rate drastically increased at a certain density*speed2 point. The ds2 variable represents a density-speed relationship that can demonstrate the relationship between flow and safety. This is equal to the Future Crash Potential Indicator (FCPI) for a specific roadway condition. An algorithm can be derived in order to use this FCPI to alert a variable speed limit system when it is
appropriate to modify the speed limit. A critical FCPI is determined for the roadway’s general conditions; using real-time data collection, if it is determined that the FCPI is greater than the critical value; a reduced speed may be calculated as demonstrated in Figure 2.0. This is important because it allows the speed limit to be adjusted ahead of when crash rates increase dramatically. An algorithm like this that can be used
universally is potentially life-changing; the ability to manage speeds automatically before critical crash probabilities become high could save money and lives. It may be of
significance to compare the critical speed difference method to the FCPI method of setting variable speed limits to determine which is more sustainable and effective (15).
Figure 1: Algorithm for variable speed limits (Konokov et. al).
Traffic conditions have a significant impact on crash occurrence likelihood (COD). Zheng reported that during congested traffic flow, COD is six times greater than at the free-flow condition. Zheng uses ‘traffic chaos’ as a potential COD indicator that integrates speed, speed variance, and flow, and it shows promising performance (16).
In 2013, Li et al. developed a rear-end collision risk index (RCRI) using detector data as a surrogate safety measure for rear-end collision risk. This was related to
kinematic traffic waves near recurrent bottlenecks along freeways (9). As defined by the FHWA, a traffic bottleneck is ‘a localized constriction of traffic flow, often on a highway segment that experiences reduced speeds and inherent delays, due to recurring
end collision was found to be highest when traffic approaching from upstream is near capacity while downstream is highly congested.
Yu found that the frequency of severe crash occurrences increased with large variations in speed prior to the crash using hierarchical Bayesian binary probit models to analyze crash injury severity on high speed facilities. He established that the standard deviation of speed 6-12 minutes prior to reported crashes was positively significant in relation to the crash event. Yu states that most previous crash injury severity studies analyzed crash report data and roadway geometry, yet failed to capture ‘micro-level’ contributing factors like average speed (12).
Crash Hotspot Identification Methods
A crash hotspot can be considered any location that has a larger number of crashes in relation to similar locations due to certain risk factors. In essence, a hotspot is a location where engineering improvements have the highest potential to improve safety. Montella states that there are three main steps toward correcting hotspots: (1) compare crash patterns at the site, (2) identify local risk factors by site investigation, and (3) identify countermeasures that have proven to be effective in those cases. GIS has played a major role in other studies in identifying hotspots for traffic crashes (18). In 2004, Loo used crash and district board databases in an early attempt to improve the accuracy of collision locations in Hong Kong plotted on GIS. The researcher eliminated buffer zones, by requiring latitude and longitude-based coordinates to “snap” to existing road layers. Based on other variables such as nearby landmarks and addresses, she sometimes also used the next-best snap to identify the most accurate location of a crash. These automated
procedures reduced the need for manual spatial validation by over 95percent (19). Kuo et al. (2013) explored the possibility of rerouting police patrol routes based on historical crime and crash hotspots in College Station, Texas. Results showed a reduction in response time of up to 44percent when Data-Driven Approaches to Crime and Traffic Safety (DDACTS) principles are applied (20).
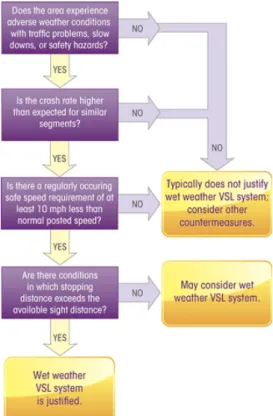
The Texas A&M Transportation Institute (TTI) identifies three key factors to be considered when considering VSL implementation: 1) Driver compliance to the signage is integral to their overall success; 2) VSLs must only be used in response to a real-time event, and if the users don’t have faith that the situations are real, compliance will be low; and 3) VSLs must be visible to all lanes of traffic, with dynamic message signs (DMS) placed regularly with warnings and/or explanations (21). However, there is no data-driven approach to these conclusions, or scientific method to determine how much compliance changes qualitatively and quantitatively when the previously mentioned key factors are altered. TTI also indicates that it is their state’s responsibility to determine the viability and specific needs for VSL implementation, but doesn’t give a data-driven method for determining which signs are optimal and under what conditions, or how to select the corridor that will maximize safety and congestion benefits.
CHAPTER 3
METHODOLOGY
A series of tasks were cultivated to fulfill the identified research needs and stated objectives. Static survey and focus group experimental designs were developed to isolate critical factors in variable speed limits on operating speed selection in addition to
obtaining perspectives and opinions on VSLs. Finally, an algorithm for optimal VSL corridor selection was developed. The subsequent section identifies the tasks completed to evaluate previously identified objectives.
Perform Literature Review
Firstly, a comprehensive review of existing literature on variable speed limits was initiated. This task evolved throughout the thesis process as more information was discovered. A special focus was placed on crash prediction, previous VSL installments and their safety benefits, and crash hotspot identification. The knowledge of previous installments’ safety advantages and crash prediction algorithms was useful in justification of the tasks set forth. Crash hotspot identification literature helped piece together a process to identify optimal VSL corridors. It was also helpful researching past focus group studies to obtain insights on how to run a successful session. The primary
Static Survey and Focus Group
This task ultimately contained two subtasks, the first being the development and administration of a static survey and the second, the conduction of a focus group. The tasks are directly related in that the static survey was the opening of the focus group; it was used to inspire thought and opinion on VSLs. The survey and focus group combined objectives are outlined below:
Focus Group
The focus group objectives set the precedent for what the research aimed to achieve. The focus group objectives were also meant to remind the focus group moderator the purpose of the research, and were used as a reminder if discussion was straying from the intended objectives. There were four main objectives for the focus group:
i. Identify opinions and perspectives on variable speed limits.
ii. Identify critical VSL type and condition isolating factors in the speed selection process for VSL implementation.
iii. Identify the optimal VSL sign and under what conditions it is optimized. iv. Analyze anecdotal survey data to begin to make correlations between
certain isolating factors and operating speeds.
Focus Group and Survey Methods
Firstly, a moderator’s guide was developed to have a record of important objectives and questions for the focus group. The guide worked as a manuscript to keep conversations on track to fulfill all predetermined goals and objectives for the study. It will also be useful to future studies that choose to continue research and/or pull information from this research. The guide was designed to fulfill the aforementioned research objectives and
can be found in the Appendix. The focus groups were recorded via an Olympus voice recording device and permission to tape was confirmed beforehand via verbal agreement with the participants upon agreement to delete the recordings once analysis was
completed. Two focus groups were completed as part of the completed research.
Logistics
There were two focus groups held; the first was held on Friday, November 7, 2014 at 12:30-1:45 PM in the Higgins Room in Marston Hall at the University of Massachusetts Amherst. The second focus group was held on Monday, November 10, 2014 at 1:25-2:20 PM at the UMass Amherst Elm House Classroom. In total, there were twenty participants, varying in gender, age, and educational/work background. Participants were recruited via posting on a local data collection agency website, and personal contact via work and classroom settings. An experienced focus group moderator was chosen to minimize confirmation bias and to improve objective concentration and conversation flow. Robin Riessman, Associate Director of the University of Massachusetts Traffic Safety Research Program (UMassSafe), was selected based upon her previous expertise as a as a focus group moderator in the transportation field.
Introduction
To establish a comfortable and welcoming rapport within the group, a brief introduction of the moderator and the topics to be addressed was done while lunch was served. Participants were notified that their answers and conversations will be confidential and used for research in addition to their identities being anonymous.
The first question asked was light and easily answered in order to establish some conversation and comfort.
Static Survey
Prior to questions related to personal opinions and perspectives on VSLs, a static survey was completed by the focus group participants, using a prepared presentation of images for each survey scenario depicted. The participants were instructed that they would have ten seconds to observe the scenario, and record both the speed they think they would drive in addition to the speed they believed others on that same road would drive. The static survey was designed to obtain preliminary insight into isolating critical factors in speed selection due to various VSL designs. Seventeen different scenarios were created using two original photographs taken on the driver’s point-of-view on Route 90 and 91 in Central and Western Massachusetts during typical cloudy, light traffic days. The Route 90 photo was on a section of 3-lane, 65 mph enforced highway, and the Route 90 on a 2-lane, 65 mph enforced highway section. The two photographs were used as baselines for Adobe Photoshop altercations in which multiple different VSL and USL signs were altered and added in. The signs were cropped out of photographs available online, and then meshed and scaled on top of the original Route 90 and 91 photos to make it seem as if they were actually there. It was important to find photos of speed limit signs that were taken in the same orientation as the
background photos to increase realistic visuals and to reduce the amount of warping to the photo aspects. Additionally, when overlaying the signs on top of the photos, special emphasis was placed on matching lighting conditions and
smoothing edges to increase realism. To isolate different factors in the speed limit signage in the seventeen scenarios depicted, there were certain aspects keyed in on for alteration. It is important to note that there are other types of VSL signs used internationally, but this study keyed in on types of signs used in the United States thus far. Further research could build upon this and potentially expand to signs more prominently used in Europe, for example. The critical factors altered in the static survey renderings are summarized in the table below.
Table 1. Critical Factors in VSL Survey
Critical Factors Altered in the Static Survey Renderings
USL vs. VSL vs. No SL Sign Overhead vs. Side-Mounted Message Accompanied vs. No Message
Speed Limit (45, 55, 65)
To remove the message from the VSL with warning message used, the message area was filled with black paneling copied from the outsides of the board used. When altering the white-colored LED speed limit value on both side and overhead VSLs, a similar technique was used. Changing the displayed value between 65, 55, and 45 simply involved altering pixels between white and black on the first digit of the value to create a new number.
In a few of the scenarios, computer-generated rain was added to obtain
preliminary insight into whether it impacted speed choice during VSL scenarios. The rain effect was created in Adobe Photoshop using various sliders and filters on a new black background overlaid on the photos. An example of the rain/VSL scenario can be seen in Figure 2, in addition to examples of an overhead and side mounted scenario.
Figure2. Examples from Static Survey Scenarios
Table 2. Summary of Survey Scenarios
Scenario # Sign Location Warning? Lanes? VSL/USL/No sign? SL Value Rain?
1 Overhead No 2 VSL 45 No 2 No Sign No 3 No Sign 65 No 3 Side No 3 VSL 55 No 4 Overhead Yes 2 VSL 45 No 5 Side No 3 USL 65 No 6 Overhead No 2 VSL 55 No 7 Side No 3 VSL 45 No
8 No Sign No 3 No Sign 65 Yes
9 Overhead No 3 VSL 45 No 10 Side No 2 USL 65 No 11 No Sign No 2 No Sign 65 No 12 Overhead No 3 VSL 45 Yes 13 Overhead No 2 VSL 65 No 14 Side No 2 VSL 45 No 15 Overhead Yes 3 VSL 45 No 16 Overhead No 3 VSL 55 No 17 Side No 2 VSL 55 No
The survey sheet and accompanying scenarios used for the static evaluation can be found in Appendix B.
Topics/Questions
The first topic explored was aimed at discussing critical isolating factors and conditions that affect participants while choosing their speed. The questions asked during this section started general in nature, and then focused in on factors in VSL infrastructure that may or may not influence their speeds. Multiple PowerPoint slides displaying two or three of the previously displayed scenarios together were used to inspire thought and hone in on specific factors. These discussions were set to last around 25-30 minutes, or approximately half of the total discussion time.
The second topic of the focus group was overall opinions and perspectives on VSLs in general. This part was more open-ended and formatted for opinionated discussion. Participants were asked whether or not they liked them, approved of them, and under what conditions they would be more likely to comply. Discussion was also led towards whether and under what conditions they would support state and/or federal funding on VSLs. All focus group questions can be seen in the Appendix A as a part of the Moderator’s Guide.
Closing
After addressing all of the topics, the moderator spent a brief period of time wrapping up the conversation. The moderator asked if there was anything that the participants wished to discuss that wasn’t brought up, or related wrap-up questions. The moderator then thanked the participants and concluded the focus groups.
Formulation of an Optimal VSL Location Identification Algorithm
To complete the research, a study has been done using GIS and crash data to best understand the optimal VSL corridor location identification process. As of now, there is no due process that has been published to inform decision makers on how to allocate funds and resources for optimal VSL corridor selection. An ‘optimal’ corridor for VSL implementation is be one that has the opportunity to reduce crashes and traffic due to factors that VSLs can specifically alleviate. The factors were identified through rigorous literature review and a case study was performed in order to back-track towards a
working conceptual algorithm. This conceptual VSL ID algorithm will be able to guide future decision makers towards a more efficient use of their money and time.
The following is the extent of the research completed thus far for Task 5.
Crash data for the Commonwealth of Massachusetts between 2011-2013 were queried from the UMassSafe Data Warehouse. These data were then imported into a new GeoDatabase in ArcCatalog and loaded into ArcMap. As it already contained x and y coordinates for each crash, points could be plotted and matched with the Massachusetts State Plane coordinate system. A point density raster was created using the spatial analysis feature in the ArcGIS toolbox and crash hot spots could then be linked to major roadways in Massachusetts.
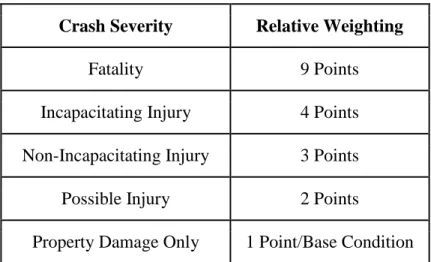
To identify areas where VSLs can be most effectively implemented, performance measures were selected and then analyzed spatially. In this study, bottleneck-prone locations, severity (in Equivalent Property Damage Only, EPDO) and crashes with adverse weather and roadway conditions were analyzed using Geographic Information Systems (specifically, ArcGIS). The ratio scheme chosen for EPDO reflected the relative costs to society in the event of a crash of a particularly categorized severity. The severity weightings are shown in Table 1. Property Damage Only (PDO) crashes represented the baseline by which more severe crashes were compared. Possible injury crashes were given double the weight of property damage only crashes. Crashes resulting in one or more non-incapacitating injuries were given triple the consideration of a PDO crash. Incapacitating injury crashes were counted as four times as severe as a PDO crash. Fatal crashes were assumed to be nine times as severe as PDO crashes. EPDO relative
Table 3. EPDO Weighting Scheme
Crash Severity Relative Weighting
Fatality 9 Points
Incapacitating Injury 4 Points Non-Incapacitating Injury 3 Points
Possible Injury 2 Points
Property Damage Only 1 Point/Base Condition
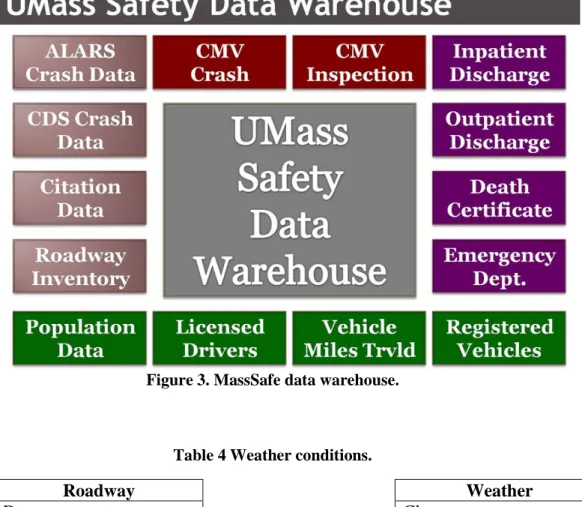
A separate layer was then created in ArcGIS to isolate crashes with adverse weather and road surface condition. Thus, there were two output maps for reference; a map showing all crash hotspots and one strictly illustrating weather and road surface condition-related crashes. Weather and road surface conditions are coded by police at the crash site and were made available in spreadsheet form through MassSafe. A graphic representing MassSafe’s Data Warehouse is provided below and the lists of recordable descriptions are shown in Table 4. The bold and italicized descriptions in the table are the conditions considered inclement for research purposes.
Figure 3. MassSafe data warehouse.
Table 4 Weather conditions.
Roadway Weather
Dry Clear
Wet Cloudy
Snow Rain
Ice Snow
Sand, mud, dirt, oil, gravel
Sleet, hail, freezing rain
Water (standing, moving) Fog, smog, smoke
Slush Severe crosswinds
Other Blowing sand, snow
Unknown Other
Unknown
Other and unknown values were removed from the data prior to analysis. Weather conditions considered to be inclement included cloudy, rain, snow, sleet, hail, freezing rain, severe crosswinds, and blowing sand/snow. Adverse road surface conditions included wet, snow, ice, sand, mud, dirt, oil, gravel, water, and slush. It was determined
road surface was used, since it can more directly lead to skidding and loss of control. This analysis is discussed later in the report.
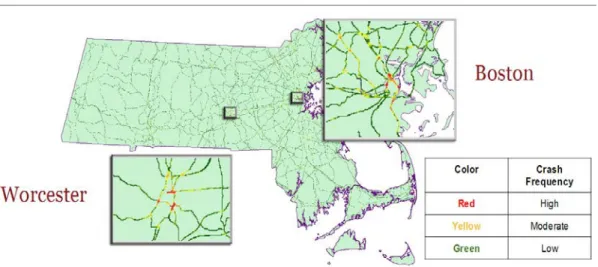
GIS data illustrating ratios of weather-related crashes relative to all EPDO collisions plotted for which severity data were provided are used to determine the relative influence of weather on a specific roadway location. This eliminates the confounding effect of traffic exposure to a roadway segment through the normalizing process. An analogous normalization for roadway surface conditions relative to EPDO crash history was also performed. GIS crash density maps for EPDO crash density and poor road surface condition crash density are shown below.
Figure 5. EPDO Crash Density
It is hypothesized that during adverse weather and road surface conditions, drivers are more likely to be traveling slowly and any crashes that occur are therefore less severe. When environmental hazards are not present, drivers travel faster and a crash is more likely to be severe. The roadway surface data and weather data were compared to observe any significant discrepancies. It would have been more accurate to obtain NCDC
roadside weather data for accuracy purposes, but the data request timeline was not in concert with the project schedule.
Once crash hotspots were located, traffic bottlenecks needed to be identified to get a complete idea of where variable speed limits could be most effective. One way to diagnose traffic bottlenecks is to use a regional travel demand model. The Central Massachusetts Regional Planning Commission (CMRPC) identified localized roadway segments where volume-to-capacity (v/c) ratios were highest using demand modeling and field verification. A roadway having a v/c ratio of 1.0 is considered to be saturated. Any additional traffic flow will result in excessive congestion.
CHAPTER 4
RESULTS AND ANALYSIS
The results obtained through the previously outlined methodologies are organized are presented in this chapter and are best broken into two main sections: Focus Group and Static Survey, and VSL Corridor Optimization. For each VSL critical factor analyzed, key take-aways and quotes from the focus groups are presented in concert with a graphical representation of related survey analysis. In the VSL Corridor Optimization section, tabulated results for the case study are presented and analyzed in addition to the presentation of a finalized conceptual framework graphic.
Focus Group and Static Survey
The focus group and survey set out to obtain results that best achieved the specified research objectives. The objectives for these tasks, summarized again below, are analyzed fluidly and as a whole as the results overlap each objective.
i. Identify critical VSL type and condition isolating factors in the speed selection process for VSL implementation.
ii. Identify the optimal VSL sign and under what conditions it is optimized. iii. Analyze anecdotal survey data to begin to make correlations between
certain isolating factors and speed variance.
The first topic explored was aimed at discussing critical isolating factors and conditions that affect participants while choosing their speed. Notable conditions that would influence speeds, as noted by most drivers in the focus groups, were enforcement levels, poor weather conditions, and traffic congestion. When discussing the opening discussion question of “What influences your speed selection on the roadway?” speed limit signage was not one of the major factors discussed in influencing their speeds. The majority consenus was that drivers would go atwhat speed they were comfortable at, or at the current speed that the flow of traffic was going. It was not until discussion was pointed toward specific scenarios they has seen in the survey that they mentioned signage as being an influential factor. Table 5 highlights key take-aways and quotes from the discussion based on critical VSL factors. Table 6 highlights the key factors outside of the speed limit signage that affects the drivers’ speed selection.
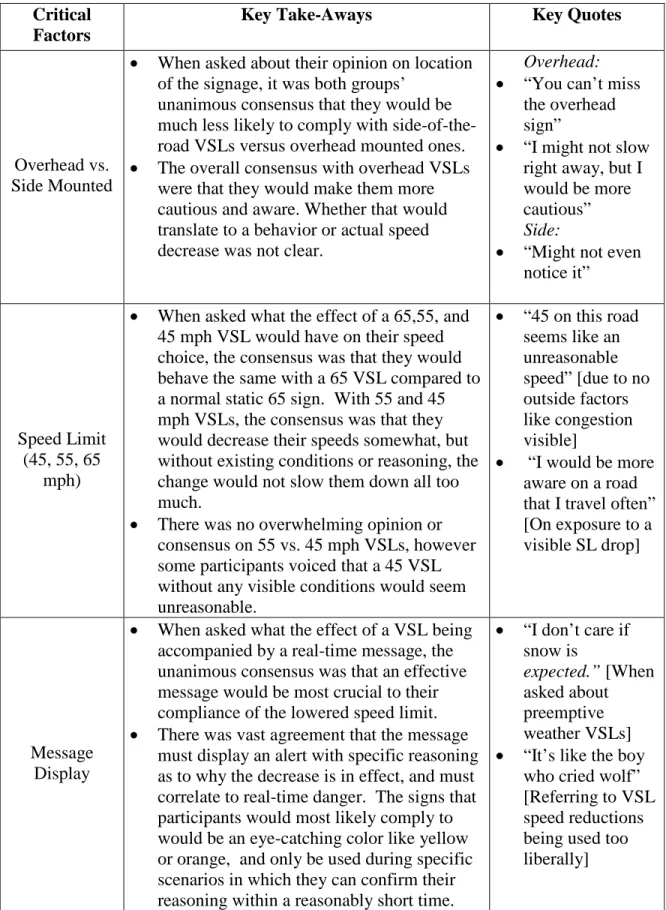
Table 5. Key Critical Factors Discussion Points
Critical Factors
Key Take-Aways Key Quotes
Overhead vs. Side Mounted
• When asked about their opinion on location of the signage, it was both groups’
unanimous consensus that they would be much less likely to comply with side-of-the-road VSLs versus overhead mounted ones.
• The overall consensus with overhead VSLs were that they would make them more cautious and aware. Whether that would translate to a behavior or actual speed decrease was not clear.
Overhead:
• “You can’t miss the overhead sign”
• “I might not slow right away, but I would be more cautious”
Side:
• “Might not even notice it”
Speed Limit (45, 55, 65
mph)
• When asked what the effect of a 65,55, and 45 mph VSL would have on their speed choice, the consensus was that they would behave the same with a 65 VSL compared to a normal static 65 sign. With 55 and 45 mph VSLs, the consensus was that they would decrease their speeds somewhat, but without existing conditions or reasoning, the change would not slow them down all too much.
• There was no overwhelming opinion or consensus on 55 vs. 45 mph VSLs, however some participants voiced that a 45 VSL without any visible conditions would seem unreasonable. • “45 on this road seems like an unreasonable speed” [due to no outside factors like congestion visible]
• “I would be more aware on a road that I travel often” [On exposure to a visible SL drop]
Message Display
• When asked what the effect of a VSL being accompanied by a real-time message, the unanimous consensus was that an effective message would be most crucial to their compliance of the lowered speed limit.
• There was vast agreement that the message must display an alert with specific reasoning as to why the decrease is in effect, and must correlate to real-time danger. The signs that participants would most likely comply to would be an eye-catching color like yellow or orange, and only be used during specific scenarios in which they can confirm their
• “I don’t care if snow is
expected.” [When asked about preemptive weather VSLs]
• “It’s like the boy who cried wolf” [Referring to VSL speed reductions being used too liberally]
Message Display
(cont.)
• When the speed was being lowered due to severe congestion, work zones, etc. some voiced that a message displaying distance to the event area would improve compliance when within about 1 mile.
• “ICY ROADS AHEAD” seemed to be the consensus most approved-of message.
Table 6. Key Outside Factors Discussion Points
Outside Factors Key Take-aways
Weather • Some participants voiced that it
takes heavy rain for them to begin slowing their speed. The consensus was that most would slow due to poor weather conditions, but that there will always be aggressive drivers that don’t adjust.
Congestion • Many people made it known that
the flow of traffic and the amount of cars on the road is one of the most important factors in their speed selection.
Roadway Geometry • Many participants voiced that they
travel at what speed they feel comfortable with in relation to the roadway geometry.
Speed Limit Signage • It seemed noteworthy that most
people didn’t acknowledge speed limits as major influential factors in speed selection before VSLs were introduced into the discussion.
Enforcement • The rate of enforcement was
unanimously a top factor for
compliance to speed limits in which they didn’t agree with.
Alpha is defined as the personal speed choice for the person filling out the survey; Beta is defined as the speed that they think other people would travel during the given scenario.
Table 7. Alpha and Beta Definitions Variable: Defined as:
Alpha Speed that participant would drive
Beta Speed that that participant thinks others on road would drive
In all subsequent figures, Alpha and Beta are shown side by side to not only show trends in Alpha and Beta separately, but between the two to compare the trends side by side. On the whole, The Alpha speed choice trends mimicked the Beta trends, but were usually varied in scale. This may enhance the meaningfulness of the trends, as it provides a secondary proof of the overall speed choice trends. In other words, if the Alpha trends and Beta trends mimic each other across speed percent differences, absolute speed
difference and speed variance, then the trends may be more pertinent. A good example of this is in Figure 7, a graphical representation of average percent difference between the driver speed choice and the posted speed limit. The Beta speeds are slightly higher than Alpha in all four cases of location and speed limit value combinations.
Compliance and Speed Variance
When analyzing each scenario, it was desired to define which scenarios had the overall best and worst compliance and safety measures. Compliance measure here is defined as the percent difference between their speed choice and the posted limit, and the safety measure is variance between participants’ speed choice per scenario. It is known that as speed variance increases on a highway segment, likelihood of a crash increases
percent difference may have a higher average compliance rate, but could still have a high speed variance among participants which may counterproductive to what a VSL is
attempting to do. Scenarios with low percent difference and low speed variance are ideal. For example, scenario 15 rated extremely well for both performance factors. Scenario 15 was an overhead 45 mph VSL with a warning message. These results are preliminary evidence that drivers may uniformly comply more to this type of speed limit than any other presented in this research. Interestingly, the scenarios that had the largest gaps between their compliance performance and safety performance were scenarios 2 and 11. These scenarios were the baseline scenarios- neither of them had a speed limit sign. So although drivers generally were within a low percent difference from the actual roadway limit of 65, the variance between drivers was much higher. This may demonstrate a false sense of safety if compliance data was used without consideration of speed variance. The scenarios that received the lowest compliance ratings are then defined in Figure 6 as the highest absolute and percent difference from the posted limit. Scenarios 1, 14, and 13 showed the least compliance- and this aligned with previous cross-analysis of different factors affecting driver compliance.
Figure 6. Compliance Measures of all Scenarios
Critical Factors
Pivot tables in Excel allowed for the isolation of critical factors in order to more deeply understand why participants were selecting certain speeds. The results for critical factors identified are summarized in the subsequent sections.
Location of Sign
Also evident in Figure 7 is that there was about a notable 3-4 mph increase in speeding above the posted limit when it was a side-mounted VSL as compared to an overhead VSL. This mirrors comments from the focus group where participants indicated that they would drive more aware and cautiously if it was an overhead VSL sign. Many participants made it known that a lowered limit on the side of the road was much less formidable and noticeable; the overhead sign seemed to gain more respect from the focus group, and this was backed up by the survey data: participants averaged
0 10 20 30 40 50 60 0 5 10 15 20 25 1 2 3 4 5 6 7 8 9 10 11 12 13 14 15 16 17 Sp ee d V ari an ce Per cen t S peed D iff er en ce f or m P os ted Limi t ( mp h) Scenario #
Performance Measures of all Scenarios
Average of ALPHA % DIFF
Var of Speed they would go(ALPHA)
only going about 6 mph over the 45 mph overhead VSL, versus traveling approximately 10 mph over the 45 mph side-mounted VSL.
Figure 7. Overhead vs. Side Mount Speed Differentials
So, it may be known that they respect and decrease their overall speeds when an overhead sign is present versus a side-mounted one- but how does this relate to the overall speed choice variance? In Figure 8, Alpha and Beta variances are shown combined, and overall speed variances are shown separated by VSL location and speed limit value. Arguably the most interesting finding is that speed variance associated with scenarios having a 55 mph speed limit had a significantly higher variance for side-mounted scenarios as compared to overhead scenarios. And the vast majority of this increase is due to the Beta
0 2 4 6 8 10 12 Overhead Side VSL Di ffer en ce fr om P os ted Li m it ( M PH )
Average Driver Speed Choice Difference from
Posted Speed Limit
45 - Alpha 45 - Beta 55 - Alpha 55 - Beta
speed- the speed that they think others will be traveling. So, although anecdotal, it is evident that the Beta speed variance could potentially be less dangerous during an overhead 55 VSL scenario as compared to a side mounted 55 VSL. This also correlates with the focus group talking points that side-mounted VSLs would not be as effective as overhead VSLs.
Further, the variance increases for side-mount at 45 mph, but not nearly as much as it does at 55 mph. This could mean that people respect the 55 mph lowered speed versus the 45 mph limit due to the overall decrease in value form the usual 65 mph limit.
Figure 8. Variance among Location and Speed Limit Alterations
Warning Messages
One of the most recurring themes of the focus group speed selection discussion was on accompanying warning/descriptive messages with the lowered speed limit. Participants felt it was very important to give reasoning on the lowered speed limit- the overwhelming
0 10 20 30 40 50 60
Overhead Side Overhead Side
45 55 VSL Sp ee d V ari an ce Speed Limit (MPH)
Speed Variance, Beta and Alpha Speeds
Combined
Var of speed they think others would go (Beta)
Var of Speed they would go (Alpha)
consensus was that they would be much more likely to comply and cooperate with the new speed limit if it had a descriptive message. They wanted an exact reason as to why they should slow, whether it was icy roads ahead, or crash one mile ahead. When the VSL was being decreased due to heavy slowed traffic ahead, it was the consensus that the message should contain the distance to the back-up in addition to strong wording.
However, providing the distance may work against the overall VSL system working, as people may choose to continue their speeds until the actual back-up – completely working against the speed smoothing effects that it is supposed to be having.
Nevertheless, the speed selection survey further backed up their discussions on providing a warning message with the overhead VSL. As shown in Figure 9, drivers chose an average of 55 mph during the 45 mph VSL without message. When the message was introduced in a separate scenario when all other variables were held constant, their average speed choice was 50 mph- a 5 mph decrease towards the 45 mph speed limit. A similar trend can be found for what speed the participants thought other drivers would choose. When comparing speed choice variances, there is minimal difference when a message is and is not displayed. This could mean that reduced speed and compliance to the posted limit improves with a message, but overall variance in speeds does not change noticeably. Much more research and a larger sample size would be needed to check this and all other anecdotal conclusions made within this part of the research.
Figure 9. Effects of Warning Message on 45 mph VSL Speed Selection
Lane Configurations
All scenarios were shown on both two and three lane highways to determine if the roadway width or lane configuration had a significant impact on their speed selections. Figure 10 shows that there really is no signifcant difference in absolute Alpha or Beta speed choice. With further research and validation, this could prove that the speed choice is based more on conditions and speed limit signage than differences between two and three lane highway geometry. This is interesting, because duringthe focus groups, roadway geometry was brought up numerous times to beinga main speed choice
influence on the highway. To test this, more types of roadway segement geometry would have to be tested, such as curvature and superelevation. The acknowledgment of two and
46 48 50 52 54 56 58 45 (VSL) 45 (VSL) No Message Warning Message
Displayed Av er ag e S peed S el ec tio n ( M PH )
Effects of Warning Message on 45 mph VSL
Speed Selection
Average of Speed they would go (Alpha)
Average of speed they think others would go (Beta)
survey method could further attribute the performance measures to being influenced by the speed limit signage rather than outside conditions.
Figure 10. 3 Lane vs. 2 Lane Highway Speed Choice Differences
Opinions and Perspectives on VSLs
Opinions and perspectives represented a national and international perspective, as focus group members had experience driving or living permanently in the U.S. West, Southwest, Northeast, Mid-Atlantic, and South regions, in addition to Europe and Latin America.
In response to the question “Would you generally approve of VSLs?” focus group participants were at first hesitant, stating that they would be supportive only if they were implemented in certain locations, were clear and respected, and used only when
conditions properly warranted them. One participant mentioned the need “to know that
0 2 4 6 8 10
2 3
MPH Difference from Posted
La
ne
s
Absolute Speed Difference, 3 Lanes vs. 2
Lanes
Average of Beta Absolute Diff Average of Alpha Absolute Diff
side-mounted VSLs were not changing in real-time, thus compliance would not be high. The focus group majority agreed. Another participant mentioned that they should only be in “certain locations” referencing the need for a process that determines an “appropriate, data-driven approach to save the most lives.” When asked about whether or not they would support state and/or federal funding on them, the first thoughts were usually that many people “would be outraged.” However, the question, in retrospect, was not very pointed, as the general tax-paying public may assimilate tax spending in a negative light no matter the case. If similar research were to be done, the ‘spending’ question should be altered so it gives the participants a better understanding of how transportation funding occurs. For example, if there was a federal bond that was earmarked for just
transportation improvements, would you support ‘x’ percent of the bond on VSLs? This question is more specific and realistic in nature and may have received a more useful response. However, when the discussion moved on to a scenario where it was decided they would be implemented, there was unanimous support in both focus groups that a pilot program be used to determine their effectiveness before further investment. One participant mentioned “Let’s try two or three as a pilot.” In both cases, these ‘pilot’ ideas were original thoughts by participants, and were not prompted by the moderator. The consensus was that the VSLs should only be implemented in minimal sections of corridor where there were data-driven reasoning for implementation.
There was also specific mention of transportation technologies, such as Waze, and their benefits for avoiding traffic and their relationship to what VSLs with messages do. Originally brought up as an alternative to VSLs by one participant, this idea was quick refuted by many as distracted driving (by using a smartphone to obtain and report
roadway anomalies and traffic while operating a vehicle). One participant mentioned it was safer to read a VSL with a message than looking down at a smartphone.
When discussing what participants thought what other drivers’ attitudes and behaviors would be towards VSL implementation, there was an overall consensus that drivers with aggressive tendencies and personalities would not change their speeds whatsoever. This could potentially lead to an even wider disparity in speed variance, which is potentially dangerous. Although the anecdotal survey results indicate that there are optimal VSLs in which the compliance is high and variance is low, much more research must be done in order to obtain validation, deeper insights, and a larger sample size.
VSL Corridor Optimization
The top ten bottleneck areas in Central Massachusetts were ranked by CMRPC. A composite ranking system was developed, where bottlenecks, EPDO, and road surface conditions were ranked independently and assigned points according to a scale of one through ten. Since no relative values were given, not enough information was available to conduct a more sophisticated prioritizing system while maintaining consistency across scales.
The region comprising Central Massachusetts was plotted as a layer on ArcGIS and crashes within this area were selected. Nearest neighbor function with a distance of 300 meters was used to identify locations that have experienced a high crash density in which road surface conditions were poor as previously defined. The density threshold for inclusion was 140 crashes/300 meter radius. Adjacent collisions that both met the
minimum density criterion formed a zone along a corridor. The zone terminated where an adjacent crash had a density of less than 140 crashes/300 meter radius. The density at each crash along a particular corridor was summed over the entire zone, and the result was the value to be ranked. Ten distinct hotspots met the criteria, each of which was ranked in Table 8.
Table 7. Road Surface Conditions Results (2011-2013)
ROADWAY BOUND1 BOUND2 Town/City RANK SUM* SCORE
MA Route 9 100’ E of Hooper Street 30’ E of Fruit Street Worcester 1 219676 10 (Segment A) Interstate 290 Northbound
Exit 13 Exit 16 Worcester 2 169252 9
U.S. Route 20 250’ E of Peters Ave 170’ W of Francis St. Marlborough 3 114329 8 Main Street/MA 16 120’ E of Fayette St. 2000’ W of I-495 Milford 4 76904 7 MA Route 9 350’ E of Walnut St. 520’ W of Lawrence St. Worcester 5 55202 6 (Segment B) MA 12 and MA 2A Putnam St. 120’ W of Congress St. Fitchburg 6 54293 5 MA Route 9 340’ W of
May St. Elm St. Shrewsbury/Northboro 7 54187 4 (Segment C) MA Route 13 Marcello Ave MA Route 2 Worcester 8 30717 3 MA Route 12 Washington Street MA Route 2 Leominster 9 25854 2 MA Route 9 Wayne Street Coes Street Hudson 10 7215 1
Crashes that had densities of over 140 within a 300-meter radius were included as hotspots. These hotspots and their neighborhoods were mapped and adjacent crash locations were plotted along the same corridor until the threshold of 140 was not met.
When this occurred, a boundary of the zone listed was formed. The densities surrounding each crash within the zone were summed over the entire zone to generate the results above.
The EPDO ranking was performed in a similar fashion. The primary difference was that each crash was initially multiplied by its corresponding severity weighting factor as previously discussed and total neighborhood scores were assessed at each crash in place of densities. Once again, a 300 meter radius was used from each crash and the threshold for inclusion this time was a score of 155 points. The procedure continued from this point as described for the road surface condition calculations. Results from the EPDO rankings are tabulated in Table 10.
Table 8. EPDO Results (2011-2013)
ROADWAY BOUND1 BOUND2 Town/City RANK SUM* SCORE
MA Route 9 100’ E of Hooper Street 30’ E of Fruit Street Worcester 1 170872 10 (Segment A) Interstate
290 Exit 13 Exit 16 Worcester 2 147968 9 U.S. Route 20 250’ E of Peters Ave 170’ W of Francis St. Marlborough 3 114298 8 Main Street/MA 16 120’ E of Fayette St. 2000’ W of I-495 Milford 4 101923 7 MA Route 9 350’ E of Walnut St. 520’ W of Lawrence St. Shrewsbury/Northboro 5 63538 6 (Segment B) MA 12 and MA 2A Putnam St. 120’ W of Congress St. Fitchburg 6 51382 5 MA Route 9 340’ W of
May St. Elm St. Worcester 7 49108 4 (Segment C) MA Route 13 Marcello Ave MA Route 2 Leominster 8 28086 3 MA Route 12 Washington Street MA Route 2 Leominster 9 16234 2
Crashes were first multiplied by the applicable severity factor (1,2,3,4, or 9) and then a similar analysis using the sums of scores within a 300 meter radius of a crash to that above was performed, with the threshold for inclusion set at a total score of 155 within 300 meters of a crash. Zones of crashes were terminated when the value of 155 was not reached, and all scores throughout the zone are summed to generate this column’s value for each of the Top 10 zones.
Bottleneck rankings were already ranked by CMRPC as mentioned previously, and are exhibited in Table 11.
Table 9. Bottleneck Results (2011-2013) (CMRPC)
ZONE BOUND1 BOUND2 Town/City RANK SCORE
I-290 I-395 Solomon Pond Road Exit Auburn, Worcester, Shrewsbury, Boylston, Northborough 1 10 I-495 Westborough T.L. South Westborough T.L. North Westborough 2 9 (Segment A) Route 9 Rawson St., Leicster Great Post Road, Worcester Leicester, Worcester 3 8 (Segment E) Oxford Route 12/20 Intersection, Auburn Intersection, Oxford Auburn, 4 7 Park Avenue Institute Road Highland Street Worcester 5 6 Vernon Street Winthrop Street
Kelly Square Worcester 6 5 Int Ramp
I-395 NB to I-90
I-395 NB I-90 Auburn 7 4
I-495 NB Berlin T.L., South Route 62 Exit Ramp Berlin 8 3 (Segment B) Grafton Street Sunderland Road
I-90 Ramp Worcester, Millbury 9 2 Massasoit Sunderland Grafton Worcester 10 1
A roadway segment ranked first in a scale was assigned ten points and each rank further down the scale resulted in a decrease of one point down to tenth place being assigned one point. Composite scores were formed where a segment was included on the list for multiple scales. Table 12 presents the final composite rankings.
The developed framework was employed within the case study region. As shown in Table 12 the segment of Interstate 290 between Exits 13 and 16 was present in each of the rankings. The Roadway Surface Condition and EPDO rankings were identical, potentially disproving the hypothesis that poor road surface conditions encourage lower driving speeds and less severe crashes result. Overall, there is not enough evidence to suggest that drivers naturally select to slow down sufficiently enough under these adverse conditions to improve safety. Interstate 290 ranked first in bottleneck issues, and second overall in both EPDO and surface condition crashes. Overall, this segment scored with the highest priority based on the scaling system used.
Table 10. Total Scores by Roadway Segment
Roadway Surface Condition
EPDO Bottleneck Total
I-290 Exits 13-16 9 9 10 28 MA 9 Segment A 10 10 0 20 U.S. 20 8 8 0 16 Main St./MA 16 7 7 0 14 MA 9 Segment B 6 6 0 12 MA 12/2A 5 5 0 10 I-495 Segment A 0 0 9 9 MA 9 Segment C 4 4 0 8 MA 9 Segment E 0 0 8 8 MA 12/U.S. 20 0 0 7 7 Park Avenue 0 0 6 6 MA 13 3 3 0 6 Vernon Street 0 0 5 5
Interstate highways provide ideal settings for experimentation with variable speed limits, as there are no traffic interruptions due to traffic signals and stop signs. Since this stretch of Interstate 290 lies within the major city of Worcester and has substantial traffic volume, variable speed limits are likely to have a major impact. Route 9 in Central Massachusetts was also found to have several segments make the top ten aggregate VSL score.
Creation of a Conceptual VSL Location Identification Algorithm
Reviewing literature on VSLs and walking through a case study in which top VSL locations in a region were selected, it was feasible to backtrack towards defining a simplified algorithm for future selection processes. Adverse weather, road conditions, crash rates, speed variance, and congestion bottlenecks were all ‘hot words’ in much of the literature when describing where VSLs were implemented and what issues they helped alleviate. These five topics were created into a VSL data metrics pool. Adverse weather and adverse roadway surface crash data were combined as one selectable metric due to their stark similarities after the two layers were overlaid in GIS. It was decided that out of the four VSL data metrics, two or more would be necessary to obtain and analyze before moving on to the developing of a composite ranking system. This assures a diversification of metrics contributing towards VSL corridor selection- and not just a focus on one area. Once multiple data sources are established and analyzed, a composite ranking system was created in order to weight each metric, working towards a composite ranking that attributes all available data. If there was a VSL corridor that was being tested for its implementation value compared to other regional locations, it was given