Durham Research Online
Deposited in DRO:
01 July 2015
Version of attached le:
Published Version
Peer-review status of attached le:
Peer-reviewed
Citation for published item:
Drout, M. R. and Chornock, R. and Soderberg, A. M. and Sanders, N. E. and McKinnon, R. and Rest, A. and Foley, R. J. and Milisavljevic, D. and Margutti, R. and Berger, E. and Calkins, M. and Fong, W. and Gezari, S. and Huber, M. E. and Kankare, E. and Kirshner, R. P. and Leibler, C. and Lunnan, R. and Mattila, S. and Marion, G. H. and Narayan, G. and Riess, A. G. and Roth, K. C. and Scolnic, D. and Smartt, S. J. and Tonry, J. L. and Burgett, W. S. and Chambers, K. C. and Hodapp, K. W. and Jedicke, R. and Kaiser, N. and Magnier, E. A. and Metcalfe, N. and Morgan, J. S. and Price, P. A. and Waters, C. (2014) 'Rapidly evolving and luminous transients from Pan-STARRS1.', Astrophysical journal., 794 (1). p. 23.
Further information on publisher's website:
http://dx.doi.org/10.1088/0004-637X/794/1/23Publisher's copyright statement:
c
2014. The American Astronomical Society. All rights reserved. Additional information:
Use policy
The full-text may be used and/or reproduced, and given to third parties in any format or medium, without prior permission or charge, for personal research or study, educational, or not-for-prot purposes provided that:
• a full bibliographic reference is made to the original source
• alinkis made to the metadata record in DRO
• the full-text is not changed in any way
The full-text must not be sold in any format or medium without the formal permission of the copyright holders. Please consult thefull DRO policyfor further details.
Durham University Library, Stockton Road, Durham DH1 3LY, United Kingdom Tel : +44 (0)191 334 3042 | Fax : +44 (0)191 334 2971
RAPIDLY EVOLVING AND LUMINOUS TRANSIENTS FROM PAN-STARRS1
M. R. Drout1, R. Chornock1, A. M. Soderberg1, N. E. Sanders1, R. McKinnon1,2, A. Rest3, R. J. Foley4,5, D. Milisavljevic1, R. Margutti1, E. Berger1, M. Calkins1, W. Fong1, S. Gezari6, M. E. Huber7, E. Kankare8, R. P. Kirshner1, C. Leibler9, R. Lunnan1, S. Mattila8, G. H. Marion10, G. Narayan11, A. G. Riess2,12, K. C. Roth13, D. Scolnic12, S. J. Smartt14, J. L. Tonry7, W. S. Burgett7, K. C. Chambers7, K. W. Hodapp7, R. Jedicke7, N. Kaiser7,
E. A. Magnier7, N. Metcalfe15, J. S. Morgan7, P. A. Price16, and C. Waters7
1Harvard-Smithsonian Center for Astrophysics, 60 Garden Street, Cambridge, MA 02138, USA;[email protected] 2Department of Physics, Yale University, New Haven, CT 06520-8121, USA
3Space Telescope Science Institute, 3700 San Martin Drive, Baltimore, MD 21218, USA
4Astronomy Department, University of Illinois at Urbana-Champaign, 1002 West Green Street, Urbana, IL 61801, USA 5Department of Physics, University of Illinois at Urbana-Champaign, 1110 West Green Street, Urbana, IL 61801, USA
6Department of Astronomy, University of Maryland, College Park, MD 20742-2421, USA 7Institute for Astronomy, University of Hawaii at Manoa, Honolulu, HI 96822, USA
8Finnish Centre for Astronomy with ESO (FINCA), University of Turku, V¨ais¨al¨antie 20, FI-21500 Piikki¨o, Finland 9Department of Astronomy and Astrophysics, University of California, Santa Cruz, CA 95060, USA
10Department of Astronomy, University of Texas at Austin, Austin, TX 78712, USA 11National Optical Astronomy Observatory, 950 North Cherry Avenue, Tucson, AZ 85719, USA
12Department of Physics and Astronomy, Johns Hopkins University, 3400 North Charles Street, Baltimore, MD 21218, USA 13Gemini Observatory, 670 North Aohoku Place, Hilo, HI 96720, USA
14Astrophysics Research Centre, School of Mathematics and Physics, Queen’s University Belfast, Belfast BT7 1NN, UK 15Department of Physics, Durham University, South Road, Durham DH1 3LE, UK
16Department of Astrophysical Sciences, Princeton University, Princeton, NJ 08544, USA
Received 2014 May 14; accepted 2014 July 31; published 2014 September 19 ABSTRACT
In the past decade, several rapidly evolving transients have been discovered whose timescales and luminosities are not easily explained by traditional supernovae (SNe) models. The sample size of these objects has remained small due, at least in part, to the challenges of detecting short timescale transients with traditional survey cadences. Here we present the results from a search within the Pan-STARRS1 Medium Deep Survey (PS1-MDS) for rapidly evolving and luminous transients. We identify 10 new transients with a time above half-maximum (t1/2) of less than
12 days and−16.5>M>−20 mag. This increases the number of known events in this region of SN phase space by roughly a factor of three. The median redshift of the PS1-MDS sample isz=0.275 and they all exploded in star-forming galaxies. In general, the transients possess faster rise than decline timescale and blue colors at maximum light (gP1−rP1−0.2). Best-fit blackbodies reveal photospheric temperatures/radii that expand/cool with time and explosion spectra taken near maximum light are dominated by a blue continuum, consistent with a hot, optically thick, ejecta. We find it difficult to reconcile the short timescale, high peak luminosity (L>1043erg s−1), and lack of
UV line blanketing observed in many of these transients with an explosion powered mainly by the radioactive decay of56Ni. Rather, we find that many are consistent with either (1) cooling envelope emission from the explosion of a star
with a low-mass extended envelope that ejected very little (<0.03M) radioactive material, or (2) a shock breakout within a dense, optically thick, wind surrounding the progenitor star. After calculating the detection efficiency for objects with rapid timescales in the PS1-MDS we find a volumetric rate of 4800–8000 events yr−1Gpc−3(4%–7%
of the core-collapse SN rate atz=0.2). Key word: supernovae: general
Online-only material:color figures, machine-readable table
1. INTRODUCTION
Modern supernova (SN) searches are expanding our knowl-edge of the phase space occupied by cosmic explosions (e.g., peak luminosity, timescale). High cadence surveys have led to the discovery of a variety of rapidly evolving (t1/2 12 days) and luminous (−15>M>−20) transients. These include the Type Ic SNe 2005ek (Drout et al.2013) and 2010X (Kasliwal et al.2010), the Type Ib SN 2002bj (Poznanski et al.2010), the Type IIn SN PTF09uj (Ofek et al.2010), and the Type Ibn SN 1999cq (Matheson et al.2000), with the latter two showing signs of circumstellar interaction (see Filippenko1997for a review of traditional SN classifications).
The properties of these events are varied, and individual events have been hypothesized to be due to a wide number of explosion mechanisms/progenitors, including the explosion
of a stripped massive star (Drout et al.2013; Kleiser & Kasen 2014; Tauris et al.2013), the detonation of a helium shell on a white dwarf (e.g., Shen et al.2010; Perets et al. 2010), the shock breakout from a dense circumstellar shell (Ofek et al. 2010), and a super-Eddington tidal disruption flare (Cenko et al. 2012; Strubbe & Quataert2009).
Since their discovery, the overall number of these rapidly evolving transients has remained small. This is due to a relatively unknown combination of the true rate of such events and the inefficiency with which optical SN searches detect transients with very short timescales. Despite some success discovering transients at early times, many searches are still optimized for the detection of Type Ia SNe (t1/2 ∼ 20–30 days). As a
result, many rapidly evolving transients are discovered around maximum light, and decay timescales are used as a proxy for overall timescale or rise time in explosion models. Since
rapidly evolving transients probe the extremes of both explosion parameters and progenitor configurations, such assumptions can have an effect on the theoretical interpretation of these transients.
As such, obtaining a larger sample of rapidly evolving events with well constrained rise and decline timescales would be beneficial for two reasons. First, the assumptions that go into many simplified analytic models for SNe (e.g., Arnett1982) break down at such short timescales. More detailed modeling of a larger number of transients is necessary to determine whether these events are extreme cases of progenitors/explosions we already know, or if they represent entirely new classes of transients. Second, the true rate at which these rapidly evolving transients occur will influence our understanding of various stages of stellar evolution. Although rates have been estimated by several previous works (Drout et al.2013; Perets et al.2011; Poznanski et al. 2010), they are difficult to constrain when the sample size of known objects from any given survey is typically∼1.
The Pan-STARRS1 Medium Deep Survey (PS1-MDS) is well suited for this task because of its rapid cadence and multiple band coverage to a significant depth (∼24 mag). In this paper we present the results from a search within the PS1-MDS survey data for rapidly evolving and luminous transients with well constrained rise times. The search was designed to identify transients that persist for multiple rest-frame days, but have
t1/212 days. We have identified 10 such objects in the duration of the survey (2009 October–2014 March). This represents a significant increase (×3) in the total number of transients that have been found in this portion of SN phase space.
The paper is structured as follows. In Section 2 we give a brief overview of the PS1-MDS, describe the process by which we selected transients, and summarize our observations. In Sections3–5 we give an overview of our selected sample and describe their photometric and spectroscopic properties. In Section6 we examine the host galaxies of the entire sample. In Section 7 we calculate volumetric and relative rates for these objects based on four years of the PS1-MDS and, finally, in Section 8 we discuss likely explosion mechanisms and progenitor systems for these events.
2. OBSERVATIONS AND SAMPLE SELECTION 2.1. PS1-MDS Overview
PS1 is a wide-field imaging system dedicated to survey observations. Located on Haleakala, Hawaii, it possesses a 1.8 m diameter primary mirror and a 3◦.3 diameter field of view (Kaiser et al.2010). The imager consists of an array of sixty 4800×4800 pixel detectors with a pixel scale of 0.258, providing an instantaneous field of view of 7.1 deg2 (Tonry
& Onaka2009). Observations are obtained with a set of five broadband filters (gP1rP1iP1zP1yP1, hereaftergrizyP1) which
are similar, although not identical, to those used by the Sloan Digital Sky Survey (SDSS; Ahn et al. 2012). Details of the filters and photometry system are given in Tonry et al. (2012) and Stubbs et al. (2010).
The PS1-MDS consists of 10 fields, each a single PS1 imager footprint, distributed throughout the sky. Approximately 25% of PS1 observing time is dedicated to revisiting the PS1-MDS fields on a nightly basis ingrizP1to a 5σ depth of∼23.3 mag with a nominal cadence of 3 days in any given filter. In optimal observing conditions, gP1 and rP1 are observed on the same night withiP1 andzP1 observations following on consecutive
evenings.yP1is observed during times of full moon to a depth
of∼21.7 mag.
Initial reduction and processing of all PS1-MDS images are carried out with the PS1 Image Processing Pipeline (Magnier 2006; Magnier et al.2008). This includes standard reductions, astrometric solution, and stacking of nightly images as well as source detection and photometry. The nightly PS1-MDS stacks are then transferred to the Harvard FAS Research Computing cluster where difference images are produced and potential transients identified by thephotpipepipeline (Rest et al.2005, 2013). Potential transients are visually inspected for possible promotion to status of transient alert. This visual inspection acts to filter out false positives due to time varying trails from saturated sources and poorly subtracted galaxy cores (with obvious large-scale dipole patterns). Once a transient reaches alert status it is flagged for potential spectroscopic follow-up. Spectra are acquired for∼10% of PS1-MDS alerts, with final selections left to the spectroscopic observers.
2.2. Rapid Transient Selection Criteria
As part of the normal operation of the PS1-MDS described above, we identified a number of transients that evolved on rapid timescales and reached peak luminosities associated with SNe (−16>M>−21 mag). Objects identified in this way (i.e., flagged by a human operating the pipeline) are certainly useful for determining the properties of rapidly evolving transients. However, calculating volumetric rates based on the number of transients identified in a survey requires a well definedset of selection criteria. To systematically identify objects that lie in this portion of transient phase space, we initiated a search within the ∼5000 transient sources discovered with the photpipe
pipeline during the duration of the PS1-MDS. As a first cut, we required that the transient satisfy the following three criteria in a minimum of two photometric bands (all times are observer frame).17
1. The transient must rise by1.5 mag in the 9 days immedi-ately prior to observed maximum light.
2. The transient must decline by1.5 mag in∼25 days post observed maximum.
3. The transient must be present (>3σ) in at least three se-quential observations. This criteria selects a unique pop-ulation of transients than those discussed in Berger et al. (2013; which possess timescales shorter than 1 day). These criteria are motivated by the observed timescales of known SNe and are intended to exclude the bulk of Type Ia, Type Ib/c, and Type II SNe. In V-band, typical Type Ia and Type Ib/c SNe will rise by 0.6–0.75 mag in the 10 days immediately prior to maximum light and decline by 1.0–1.2 mag in the 25 days post-maximum (Riess et al.1999; Drout et al. 2011; Li et al.2011). At higher redshifts PS1 will probe bluer wavelengths (which typically evolve more rapidly) but this will compete with the effects of time dilation. Many Type II SNe would easily pass the rise time requirement, but they decline by 0.5 mag in the 25 days post maximum (Li et al. 2011; Hamuy 2003). The most rapid Type Ic SNe (e.g., SN 1994I; Richmond et al.1996) and most rapid SN1991bg-like Type Ia SNe (Taubenberger et al.2008) would barely pass all three of our requirements if caught at maximum light. However, any given PS1 band is only observed every three days and we require the
17 A given photometric band must satisfy all three criteria in order to count
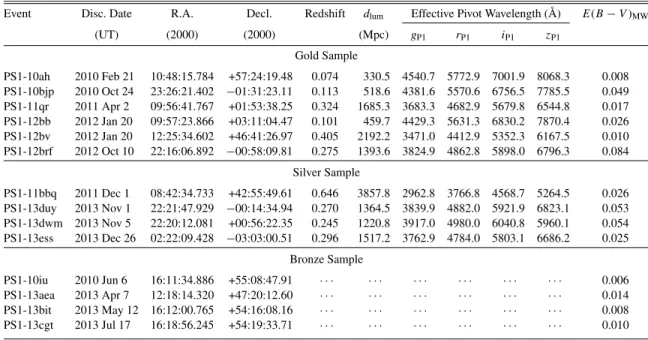
Event Disc. Date R.A. Decl. Redshift dlum Effective Pivot Wavelength (Å) E(B−V)MW (UT) (2000) (2000) (Mpc) gP1 rP1 iP1 zP1 Gold Sample PS1-10ah 2010 Feb 21 10:48:15.784 +57:24:19.48 0.074 330.5 4540.7 5772.9 7001.9 8068.3 0.008 PS1-10bjp 2010 Oct 24 23:26:21.402 −01:31:23.11 0.113 518.6 4381.6 5570.6 6756.5 7785.5 0.049 PS1-11qr 2011 Apr 2 09:56:41.767 +01:53:38.25 0.324 1685.3 3683.3 4682.9 5679.8 6544.8 0.017 PS1-12bb 2012 Jan 20 09:57:23.866 +03:11:04.47 0.101 459.7 4429.3 5631.3 6830.2 7870.4 0.026 PS1-12bv 2012 Jan 20 12:25:34.602 +46:41:26.97 0.405 2192.2 3471.0 4412.9 5352.3 6167.5 0.010 PS1-12brf 2012 Oct 10 22:16:06.892 −00:58:09.81 0.275 1393.6 3824.9 4862.8 5898.0 6796.3 0.084 Silver Sample PS1-11bbq 2011 Dec 1 08:42:34.733 +42:55:49.61 0.646 3857.8 2962.8 3766.8 4568.7 5264.5 0.026 PS1-13duy 2013 Nov 1 22:21:47.929 −00:14:34.94 0.270 1364.5 3839.9 4882.0 5921.9 6823.1 0.053 PS1-13dwm 2013 Nov 5 22:20:12.081 +00:56:22.35 0.245 1220.8 3917.0 4980.0 6040.8 5960.1 0.054 PS1-13ess 2013 Dec 26 02:22:09.428 −03:03:00.51 0.296 1517.2 3762.9 4784.0 5803.1 6686.2 0.025 Bronze Sample PS1-10iu 2010 Jun 6 16:11:34.886 +55:08:47.91 · · · 0.006 PS1-13aea 2013 Apr 7 12:18:14.320 +47:20:12.60 · · · 0.014 PS1-13bit 2013 May 12 16:12:00.765 +54:16:08.16 · · · 0.008 PS1-13cgt 2013 Jul 17 16:18:56.245 +54:19:33.71 · · · 0.010
same band to pass both our rise and decline cuts. We therefore expect our selected objects to evolve more rapidly than these events.18
A number of known low-luminosity transients (nova, CVs, M dwarf flares, etc.) could pass these selection criteria if located within the Milky Way or a nearby galaxy. Thus, all objects that passed these initial criteria were then examined by eye in order to select objects that were likely of extragalactic origin. Objects were removed from consideration if there was a clear stellar source at the location of the transient. In several cases, spectra were obtained of rapidly evolving transients, which revealed Balmer lines in emission at zero redshift, indicating the transient was likely galactic. Our search identified a handful (∼10) of these low-luminosity events. If a transient was either host-less, or exploded near a low signal to noise, unresolved, source (such that the stellar versus galactic nature of the host could not be robustly determined) it was kept in the sample and is discussed below.
In the end, by combining the results from this systematic search with results from the normal operation of the PS1-MDS pipeline, we identify 14 transients of interest. For 10 of these transients we have obtained spectra of their underlying hosts, confirming their extragalactic origin. In Section3we provide an overview of the selected objects and divide them into three groups based on the quality of their light curves and constraints available for their distance. In the rest of this section we describe the observations obtained for all 14 transients.
2.3. PS1 Transient Photometry
The 14 objects in our sample were discovered in the PS1-MDS imaging spanning 2010–2013. Discovery dates, coordinates, and other basic information are listed in Table 1. Detailed information on the production of final point-spread function
18 Consider a transient that barely passes our selection criteria (i.e., rises
1.5 mag in the 9 days prior to maximum light and declines 1.5 mag in the 25 days post maximum). If instead of observing exactly at maximum light we observe at +1 day then the transient will appear to rise slightlylessthan 1.5 mag in the 10 days prior toobservedmaximum. As a result, it will no longer pass our rise time selection criteria.
Table 2
Optical Photometry
Event Filter MJD Phasea AB Magb Error Instrument PS1-10ah gP1 55230.5 −19.5 >22.38 · · · PS1 PS1-10ah gP1 55233.5 −16.7 >22.60 · · · PS1 PS1-10ah gP1 55236.6 −13.8 >22.40 · · · PS1 PS1-10ah gP1 55239.5 −11.1 >22.75 · · · PS1 PS1-10ah gP1 55242.5 −8.3 >22.70 · · · PS1 PS1-10ah gP1 55248.5 −2.7 22.18 0.22 PS1 PS1-10ah gP1 55251.4 0.0 19.95 0.05 PS1 PS1-10ah gP1 55266.5 14.1 21.64 0.17 PS1 PS1-10ah gP1 55281.3 27.8 >22.02 · · · PS1 PS1-10ah gP1 55293.4 39.1 >22.26 · · · PS1 Notes.
aRest-frame days since observedg-band maximum. bUpper limits presented are 3σ.
(This table is available in its entirety in a machine-readable form in the online journal. A portion is shown here for guidance regarding its form and content.)
(PSF), template subtracted, grizP1 photometry is given in Rest et al. (2013) and Scolnic et al. (2013). For transients discovered before 2011 October, object specific deep templates were constructed from pre-explosion images. For transients discovered after this time, template subtraction was performed using the PS1 “deep stacks” constructed from high quality PS1 images obtained between 2010 and 2011.
In Figures 1–3 we plot the grizP1 light curves for all 14 transients. This includes 3σ pre- and post-explosion limits. To give perspective on the rapid timescale of these events, we have also plotted the Type Ibc template light curve (gray area; normalized to the PS1 transient peak magnitude) from Drout et al. (2011). Photometry is listed in Table2.
2.4. Other Transient Photometry
In addition to the PS1 photometry, we also obtained one epoch of r-band imaging for PS1-11bbq with Gemini GMOS (Hook et al. 2004), one epoch of ri-band imaging for PS1-12brf with Magellan IMACS (Dressler et al. 2006) and one
Figure 1.PS1 absolute magnitude, rest-frame, light curves for gold sample transients. Circles representgrizP1detections and triangles represent 3σupper limits.
Vertical dashed lines indicate epochs when spectroscopic observations were acquired. The gray shaded region is theR-band Type Ibc template from Drout et al. (2011), normalized to the peak magnitude of the PS1-MDS transient.
(A color version of this figure is available in the online journal.)
Figure 2.Same as Figure1for silver sample objects. (A color version of this figure is available in the online journal.)
Figure 3.PS1 apparent magnitude, observer-frame, light curves for our bronze (non-spectroscopic) sample. Symbols have the same meaning as Figure1. (A color version of this figure is available in the online journal.)
epoch ofr-band imaging for PS1-13ess with Magellan IMACS. This additional photometry was obtained at +2, +45 and +12 rest-frame days for the three objects, respectively. The images were processed using standard tasks in IRAF19 and calibrated using PS1 magnitudes of field stars. We subtracted contributions from the host galaxies using PS1 template images and the ISIS software package as described in Chornock et al. (2013). These
19 IRAF is distributed by the National Optical Astronomy Observatory, which
is operated by the Association for Research in Astronomy, Inc. under cooperative agreement with the National Science Foundation.
points are also shown (squares) in Figures1and2, and listed in Table2.
2.5. Galaxy Photometry
For our entire sample we compilegriz-band photometry for any underlying galaxy/source. When possible, we utilize the SDSS DR9 Petrosian magnitudes, which account for galaxy morphology. For cases where the underlying galaxy/source was too faint for a high signal-to-noise SDSS detection, we perform aperture photometry on the PS1 deep template images, choosing
Figure 4.Gold and silver sample explosion environments. Images are from PS1 templates. Transient explosion sites are marked with red crosses. (A color version of this figure is available in the online journal.)
an aperture to encompass all of the visible light. Cross-checks show the PS1 and SDSS magnitudes are consistent. In Figures4 and6we show the environments immediately surrounding the transients.
2.6. Optical Spectroscopy
Spectroscopic follow-up for the PS1-MDS is carried out on a number of telescopes, with the MMT, Magellan and Gemini bearing most of the load. Spectra are acquired for roughly 10% of the transients identified by thephotpipepipeline, with final selections left to the observer. We obtained spectra of five transients while they were active, including two observations of PS1-12bb. The epochs on which these spectra were taken are indicated by a dashed vertical line in the appropriate panels of Figures1and2. Host galaxy spectra were also obtained for six transients. A summary of our spectroscopic data is given in Table3.
Initial reduction (overscan correction, flat fielding, extraction, wavelength calibration) of all long slit spectra was carried out using the standard packages in IRAF. Flux calibration and telluric correction were performed using a set of custom idl scripts (see, e.g., Matheson et al. 2008; Blondin et al.2012) and standard star observations obtained the same night as the science exposures. Spectra obtained with the Hectospec multi-fiber spectrograph (Fabricant et al.2005) were reduced using the IRAF package “hectospec” and the CfA pipeline designed for this instrument.
3. SAMPLE OVERVIEW
The 14 rapidly evolving transients we identify in the PS1-MDS can be usefully split into three groups based on (1) the quality of their observed light curves and (2) constraints available on their distances. For the rest of the manuscript these sub-groups will be designated “gold,” “silver,” and “bronze.”
3.1. Gold and Silver Samples
Together our gold and silver samples contain 10 objects. For these events, we obtained spectroscopic redshifts of their host galaxies, allowing us to constrain their true luminosity scale.
Our gold sample is composed of six objects. These are our highest quality events, all of which satisfy the photometric
selection criteria listed in Section2.2. The absolute magnitude, rest-frame, light curves for these events are shown in Figure1.
Our silver sample is composed of four objects. These are events that were noted as rapidly evolving during the normal operations of the PS1-MDS but that possess sparser light curves (Figure2). In all cases the observed light curves are sufficient to characterize them as rapidly evolving, but sparse enough such that they fail the systematic selection criteria described above. For instance, PS1-13ess only has one band with a deep limit in the 9 days prior to observed maximum (as opposed to the requisite two). For a majority of this manuscript, the silver objects will be analyzed with our gold sample, as they further inform the properties of rapidly evolving transients. However, in Section7when calculating volumetric rates, only objects that pass the well defined set of selection criteria outlined above will be considered.
In Figure4 we show the 25 ×25 region surrounding the gold and silver transients, all of which have an associated host. Narrow emission and absorption lines were used to measure the redshift to each host. These range fromz=0.074 (PS1-10ah) toz=0.646 (PS1-11bbq) with a median redshift ofz=0.275. In Table1we list the redshift, luminosity distance, and Milky Way reddening in the direction of each transient (Schlafly & Finkbeiner2011). Throughout this paper we correct only for Milky Way extinction. All calculations in this paper assume a flat ΛCDM cosmology with H0 = 71 km s−1 Mpc−1,Ωm =
0.27, andΩΛ=0.73.
In Figure 5 we plot peak absolute magnitude versus red-shift in grizP1 for the gold/silver transients. Stars represent
our observed magnitudes corrected for distance and MW ex-tinction. Circles represent absolute magnitudes that have been k-corrected to the rest-framegrizP1bandpasses based on best-fit blackbodies (see Section4). We see that our sample spans a wide range of absolute peak magnitude (−17>M>−20).
3.2. Bronze Sample
Our bronze sample is composed of four objects. These events have light curves that were flagged by the selection criteria in Section2.2but for which we were unable to spectroscopically confirm the extragalactic nature of their hosts. The 25 ×25 region surrounding our bronze sample is shown in Figure6. All four transients have a faint (25 mag<mi<22 mag) underlying
Figure 5.Peak absolute magnitude vs. redshift for our gold and silver sample objects in four photometric bands (grizP1). Stars represent our observed values corrected
for distance and extinction while circles have been roughlyk-corrected to rest-frame bandpasses (see Section4.3). Dashed lines represent a constant apparent magnitude of 24 mag. Histograms for both sets of magnitudes are given in the two right most panels (blue=gP1, cyan=rP1, green=iP1, red=zP1).
(A color version of this figure is available in the online journal.)
Table 3
Optical Spectroscopy
UT Date MJD Event Target Phasea Telescope Instrumentb
2010 Mar 8 55263 PS1-10ah Host · · · NOT ALFOSC
2011 Apr 6 55657 PS1-10ah Host · · · MMT Hectospec
2011 Jun 8 55720 PS1-10ah Host · · · MMT Hectospec
2012 Jan 17 55943 PS1-10ah Host · · · MMT Blue Channel 2010 Nov 28 55528 PS1-10bjp Host · · · MMT Hectospec 2011 Sep 25 55829 PS1-10bjp Host · · · MMT Hectospec 2011 Jun 26 55738 PS1-11qr Host · · · Magellan-Clay LDSS3 2011 Dec 4 55899 PS1-11bbq Transient +2 Gemini-N GMOS 2012 Jan 27 55953 PS1-12bb Transient +5 MMT Blue Channel 2012 Feb 27 55984 PS1-12bb Transient +33 Gemini-S GMOS 2012 Jan 27 55953 PS1-12bv Transient +2 MMT Blue Channel 2012 Oct 14 56214 PS1-12brf Transient +4 MMT Blue Channel 2013 Nov 7 56603 PS1-13duy Transient +2 MMT Blue Channel 2013 Nov 10 56606 PS1-13dwm Host · · · MMT Blue Channel 2013 Dec 29 56655 PS1-13ess Host · · · Magellan-Clay LDSS3
Notes.
aRest-frame days since observedg-band maximum.
bALFOSC=Andalucia Faint Object Spectrograph and Camera; Hectospec (Fabricant et al.2005); Blue
Channel (Schmidt et al.1989); LDSS3=Low Dispersion Survey Spectrograph-3 (Allington-Smith et al.
1994); GMOS=Gemini Multi-Object Spectrograph (Hook et al.2004). source visible in the PS1 deep stacks, although in several cases
there is ambiguity about the true host (for instance, PS1-13aea exploded in the region between NGC 4258 and NGC 4248; see Figure6). In the Appendixwe quantify the most likely hosts and discuss the consequences of each probable host for the nature of these transients. We find it likely that a subset of our bronze sample events are extragalactic, and therefore additional rapidly evolving and luminous transients. However, due to the uncertainty in the distance to any individual bronze event, for a majority of this manuscript we will focus on the properties of the gold and silver transients.
4. PHOTOMETRIC PROPERTIES
The gold and silver events presented in this work increase the number of known transients with t1/2 12 days by
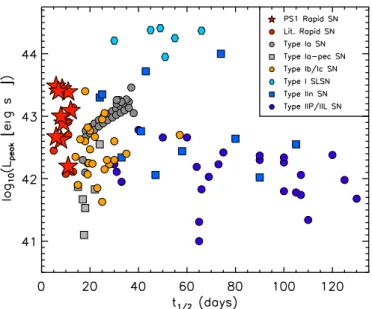
approximately a factor of three. This is illustrated in Figure7 where we plot peak pseudo-bolometric luminosity versust1/2
for the objects presented in this work (red stars) and other rapid SNe (red circles) in comparison to Type Ia, Ia-x, “Calcium-rich” Ia, Ib/c, IIn, IIP, and Type-I SLSNe (see caption for references). The sample of PS1-MDS transients significantly increases the population of known objects at the shortest timescales and spans a wide range of peak luminosities. In the this section we discuss the photometric properties of the PS1-MDS identified transients.
4.1. Timescales
In Table4 we summarize the photometric properties of the gold/silver transients, including their observed/absolute mag-nitudes and several measurement of their rise and decline timescales. Thet1/2,riseandt1/2,decline timescales as well as the
number of magnitudes the light curves decline in the first 15 days post-maximum (Δm15) were determined by linearly
interpolat-ing our observed light curve.20All values are determined with respect to the time of observed maximum, and are therefore influenced by the three day cadence in each band. However, this should not strongly affect our qualitative assessment of these objects. The quoted rise time values encompass the entire range of values permitted by the observed photometry/limits in each band.
In general the transients have faster rise than decline timescales. This is shown in Figure8where we plot thet1/2,rise
versus t1/2,decline timescales. Most events fall well below the dashed line denoting equality, indicating that decline timescale is not a good proxy for overall timescale in these events. In fact, for six events, our data do not exclude a transient that rose
20 Uncertainties were estimated using a Monte Carlo approach to produce
1000 realizations of our light curve, drawing from the uncertainties from of each data point.
Figure 6.Top and middle rows: bronze sample explosion environments. All images are from PS1 templates. Nearby galaxies are labeled in red. The location of the transient is indicated by a red cross. Bottom row: the large-scale environment around PS1-13aea, which exploded in the region between NGC 4258 and NGC 4248.
(A color version of this figure is available in the online journal.)
on a timescale1 day. In contrast, the typicalΔm15values for
these transients (1–2 mags) are slightly more rapid than typ-ical stripped envelope core-collapse SNe (CC-SNe) (Δm15 ∼
0.5–1.0; Drout et al.2011) but slower than the rapidly declining Type I SN 2005ek, SN 2010X, and SN 2002bj (Drout et al.2013; Kasliwal et al. 2010; Poznanski et al. 2010), which possess
Δm153 mag.
Three of the transients (PS1-10ah, PS1-12brf, PS1-13ess) show evidence for a change in decline timescale. PS1-10ah initially declines very rapidly, with a linear decline rate of
∼0.15 mag day−1, which then shallows to∼0.02 mag day−1
around 10 days post-maximum. PS1-13ess shows an initial decline very similar to PS1-10ah, but then rises again as evidenced by our finaliP1andzP1data points. This may liken
it to the double peaked Type IIb SN 1993J (see Section8). The other objects in our sample show no discernible change in slope out to∼10–20 days post-maximum.
4.2. Colors and SEDs
In the normal operation mode of the PS1-MDS onlygP1and
rP1observations are acquired on the same day, withiP1andzP1
observations following on consecutive evenings. In the upper panel of Figure9we plot thegP1−rp1colors from every epoch
Figure 7.Phase space of SNe: peak luminosity vs. rest-frame time above half-maximum for a variety of SNe. The PS1-MDS transients described in this paper are shown as red stars. They span an order of magnitude in peak luminosity and significantly increase the number of known transients with short characteristic times. Other events from the literature are shown as colored circles/squares: Type Ia SNe (Nugent et al.2002; Taubenberger et al.2008; Scalzo et al.2012), Type Iax & “calcium-rich” Ia (Foley et al.2013; Kasliwal et al.2012; Perets et al.2010), Type Ib/Ic (Drout et al.2011; Valenti et al.2008; Campana et al.
2006; Taubenberger et al.2006; Bersten et al.2012; Cobb et al.2010; Valenti et al.2012), Type IIP/IIL (Arcavi et al.2012; Hamuy2003; Andrews et al.
2011; Botticella et al. 2009), Type IIn (Kiewe et al.2012; Margutti et al.
2014), Type I SLSNe (Quimby et al.2011; Chomiuk et al. 2011; Lunnan et al.2013), and other rapidly evolving events (red; Drout et al.2013; Kasliwal et al.2010; Poznanski et al.2010; Ofek et al.2010; Matheson et al.2000). (A color version of this figure is available in the online journal.)
Figure 8. t1/2,rise vs. t1/2,decline for the gold and silver transients in four
photometric bands (grizP1). Stars represent objects with measured rise and
decline timescales, triangles represent objects with an upper limit in one of the two timescales, and circles with arrows represent objects with upper limits for both timescales. In general, the PS1-MDS rapidly evolving transients rise significantly faster than they decline.
Table 4
Measured Photometric Properties (Gold and Silver Samples)
Event Band mobs,max Mobs,max Mrest,max trise t1/2,rise t1/2,decline Δm15
(mag) (mag) (mag) (day) (day) (day) (mag)
PS1-10ah gP1 19.95 (0.05) −17.59 (0.11) −17.5 1–3 1.0 (0.1) 6.3 (0.6) 1.7 (0.2) PS1-10ah rP1 20.15 (0.04) −17.38 (0.10) −17.2 1–3 1.1 (0.1) 7.4 (0.8) 1.4 (0.1) PS1-10ah iP1 20.56 (0.05) −16.97 (0.11) −17.0 1–3 <0.9 10.6 (1.0) 1.0 (0.1) PS1-10ah zP1 20.40 (0.04) −17.13 (0.11) −16.8 1–3 <2.7 5.7 (0.7) 1.2 (0.1) PS1-10bjp gP1 20.29 (0.02) −18.34 (0.11) −18.2 1–4 1.0 (0.1) 7.7 (0.6) 1.7 (0.2) PS1-10bjp rP1 20.45 (0.03) −18.14 (0.11) −18.0 3–5 3.4 (0.1) 6.0 (0.4) 1.8 (0.1) PS1-10bjp iP1 20.46 (0.01) −18.10 (0.11) −17.8 3–6 1.8 (0.1) 10.0 (0.5) 1.1 (0.1) PS1-10bjp zP1 20.75 (0.03) −17.79 (0.11) −17.6 2–6 3.1 (0.1) 11.1 (0.7) 1.0 (0.1) PS1-11qr gP1 21.05 (0.03) −19.84 (0.06) −19.5 2–5 2.8 (0.1) 6.0 (0.5) 2.1 (0.2) PS1-11qr rP1 21.31 (0.06) −19.56 (0.08) −19.3 2–5 2.9 (0.1) 8.7 (0.4) 1.7 (0.1) PS1-11qr iP1 21.39 (0.04) −19.47 (0.07) −19.0 3–6 3.0 (0.2) 5.6 (0.5) 2.0 (0.1) PS1-11qr zP1 21.78 (0.17) −19.08 (0.18) −18.8 1–6 3.0 (0.4) 10.3 (2.1) 1.1 (0.3) PS1-11bbq gP1 22.53 (0.09) −19.96 (0.10) −19.6 1–5 <1.7 <14.4 >0.7 PS1-11bbq rP1 22.73 (0.09) −19.73 (0.10) −19.4 1–6 <3.3 <9.5 >0.9 PS1-11bbq iP1 22.64 (0.10) −19.80 (0.11) −19.1 1–6 <5.4 <12.7 >0.9 PS1-11bbq zP1 22.61 (0.20) −19.83 (0.19) −18.9 1–4 2.5 (0.7) <15.0 >0.7 PS1-12bb gP1 21.33 (0.03) −16.97 (0.12) −17.0 1–5 <1.8 6.3 (0.3) ∼1.8 PS1-12bb rP1 21.27 (0.04) −17.00 (0.12) −17.0 1–5 <1.7 8–11.0 ∼1.6 PS1-12bb iP1 21.12 (0.02) −17.14 (0.12) −16.9 1–3 <1.0 9.6 (0.5) 1.0 (0.07) PS1-12bb zP1 21.25 (0.04) −16.99 (0.13) −16.8 1–4 <1.3 8.2 (0.5) 1.8 (0.2) PS1-12bv gP1 21.69 (0.05) −19.68 (0.07) −19.4 3–7 <3.4 4–8 >1.6 PS1-12bv rP1 21.87 (0.05) −19.49 (0.07) −19.1 3–7 <2.2 3–9 >1.5 PS1-12bv iP1 22.07 (0.06) −19.27 (0.08) −18.8 2–6 <3.4 8.1 (0.4) 1.6 (0.2) PS1-12bv zP1 22.12 (0.11) −19.12 (0.12) −18.6 3–7 <4.0 9.0 (2.0) >1.3 PS1-12brf gP1 21.93 (0.05) −18.84 (0.07) −18.4 1–3 <0.9 6.8 (0.5) >1.1 PS1-12brf rP1 22.24 (0.06) −18.43 (0.08) −18.3 1–3 <1.0 8.8 (0.6) >0.7 PS1-12brf iP1 22.11 (0.11) −18.50 (0.12) −18.3 4–6 3.3 (0.2) 10.5 (0.7) 0.9 (0.2) PS1-12brf zP1 22.24 (0.22) −18.34 (0.23) −18.2 5–7 5.0 (0.2) ∼10.0 >0.6 PS1-13duy gP1 20.84 (0.10) −19.75 (0.12) −19.4 1–5 <4.0 <16.4 >0.7 PS1-13duy rP1 21.46 (0.04) −19.08 (0.08) −19.1 · · · <17.3 >0.7 PS1-13duy iP1 21.25 (0.05) −19.26 (0.09) −18.9 1–3 <2.5 <12.9 >0.9 PS1-13duy zP1 21.49 (0.10) −19.00 (0.12) −18.6 1–4 1.8 (0.3) 6.5 (1.0) >1.3 PS1-13dwm gP1 22.56 (0.12) −17.80 (0.14) −17.7 1–4 <3.0 2–5 >0.5 PS1-13dwm rP1 22.69 (0.11) −17.63 (0.13) −17.5 1–4 <3.0 3–7 >0.5 PS1-13dwm iP1 23.09 (0.16) −17.19 (0.17) −17.2 1–6 · · · >0.5 PS1-13dwm zP1 22.78 (0.22) −17.49 (0.23) −17.0 1–3 <1.8 3–6 >0.5 PS1-13ess gP1 22.02 (0.12) −18.68 (0.14) −18.5 1–6 <7.6 4.7 (0.5) >1.0 PS1-13ess rP1 22.69 (0.11) −18.43 (0.18) −18.3 1–6 <8.9 5.9 (0.3) >1.2 PS1-13ess iP1 22.96 (0.12) −17.70 (0.13) −18.0 · · · >0.7 PS1-13ess zP1 22.34 (0.19) −18.30 (0.20) −17.8 1–4 <6.1 10.6 (1.4) >1.0
on which both bands were observed. The colors are generally blue (gP1 −rp1 0.0) and redden slightly with time. In the
lower panel of Figure9 we plotgP1 −rP1 color at maximum
as a function of transient redshift. A majority of objects possess
−0.2> gP1−rP1>−0.3. Only PS1-12bb shows significantly
redder colors withgP1 −rp1 =0.0. For comparison, we also show a randomly selected sample of PS1 Type Ia SNe (gray dots). The Type Ia SNe are significantly redder than our rapidly evolving transients, especially at redshifts greater thanz=0.2 where thegP1 andrP1 filters probe the portion of the Type Ia spectrum where line blanketing greatly reduces the UV flux.
In order to gain a more complete view of the spectral energy distribution (SED) evolution of our sample, we interpolate our
grizP1light curves to a set of common epochs. The uncertainly
involved in such an interpolation is accentuated due to the rapidly evolving nature of our sample, and we take care to only interpolate to epochs for which there was a cluster ofgrizP1
observations within a few days. In Figure10we plot the SEDs. For a majority of the events, no turnoff is seen in the SED at blue wavelengths. This is true even for our highest redshift object, PS1-11bbq, for whom thegP1extends out to a rest fame
wavelength of∼2500 Å.
4.3. Temperature and Radius Evolution
Also shown in Figure10are the best-fit blackbody curves for each epoch. For nine (of 10) transients the best-fit blackbodies yield temperatures and radii that cool/expand with time, as one expects for an explosion with expanding ejecta (e.g., SNe). The best-fit blackbody temperatures and radii for these events are plotted as a function of time in Figure 11. On average, the temperatures cool from∼20,000 K near maximum to∼7000 K at∼20 days, and the radii expand from∼1014cm to a few×1014
during the time period over which they are constrained. Dashed lines in Figure11show fiducial cooling rates and photosphere
Figure 9.Top panel: observedgP1 −rP1 color evolution for the gold and
silver transients. Triangles mark lower limits. Colors are initially blue and redden slightly with time. ThegP1andrP1bandpasses probe slightly different
wavelength ranges for each transient. Bottom panel:gP1 − rP1 colors at
maximum light vs. redshift. Observed values are shown as cyan stars and values k-corrected to rest-frame bandpasses are shown as blue circles (see Section4.3). Histograms of both are given in the right panel. A majority of our objects show blue colors with−0.2> gP1−rP1>−0.3. Gray dots are a random selection
of PS1-MDS Type Ia SNe.
(A color version of this figure is available in the online journal.)
expansion speeds, which are based on our best observed object: PS1-10bjp (orange). The presence of extragalactic extinction along the line of sight would slightly increase these temperatures and radii, but would not affect our conclusion that their evolution is consistent with explosions that possess an expanding ejecta.
The temperature/radius evolution of three transients warrant further note: (1) PS1-12brf displays an initial best-fit blackbody temperature of∼50,000 K. This exact value is uncertain because our data lies far down the Rayleigh–Jeans tail, but from Figure1 we see that it possesses extreme colors near maximum light. This is also the only transient for which our data shows longer wavelengths reaching maximum at later times. (2) PS1-10ah shows tentative evidence for a temperature thatrises to maximum and then cools. (3) PS1-12bb is our only object that does not show a characteristic cooling/expanding behavior. The best-fit blackbody temperature shows little variation and is consistent with∼7000 K from 0<t<20 days.
Finally, by assuming the spectra of our objects can be approximated by these best-fit blackbodies, we can perform roughk-corrections on our observed magnitudes to rest-frame
grizP1 bandpasses. This will allow us to directly compare the
magnitudes observed for objects with differing redshifts. We perform synthetic PS1 photometry on these blackbodies and find the “rest”grizP1peak magnitudes listed in Table4. These “k-corrected” peak magnitudes are shown as circles in Figure5
-1
-1
-1
-1
-1
Figure 10. Multi-epoch SEDs for the gold and silver transients. Best-fit blackbody curves are shown as solid lines. ThegrizP1bandpasses are plotted
on the bottom axis for each event.
(A color version of this figure is available in the online journal.)
and are used to produce “rest-frame”gP1 −rP1 colors, which
are plotted in Figure9.
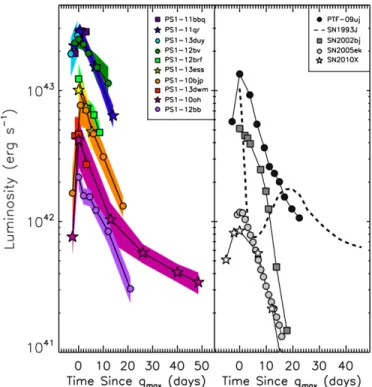
4.4. Pseudo-bolometric Light Curves
To constrain the total energy radiated in these explosions, we construct pseudo-bolometric light curves from our multi-band data. We first perform a trapezoidal interpolation to our observedgrizP1 light curves and then account for missing IR
flux by attaching a blackbody tail based on the best-fit values described above. In order to account for missing UV flux and the varied wavelength coverage of our observations (due to differing redshifts) we then extend the same blackbody from the edge of the observed gP1 band back to 2500 Å (rest-frame). This
represents the blue edge of the wavelength range covered by our highest redshift event, and the approximate range of our spectra in Section5.
Figure 11.Best-fit blackbody temperatures (top panel) and radii (bottom panel) as a function of time. In general, temperatures evolve from around 20,000 K near maximum to 7000 K at later times. Exceptions include PS1-12brf (whose initial temperature is around 50,000 K), PS1-10ah (whose temperature rise to maximum light) and PS1-12bb (whose best-fit temperature remains constant around 8000 K; not plotted). Radii are a few time 1014cm, and expand with
time.
(A color version of this figure is available in the online journal.)
Using this formulation, our peak pseudo-bolometric lumi-nosities span a range of approximately 2×1042erg s−1<L<
to 3 × 1043 erg s−1, and are plotted in Figure 7. If we had instead utilized a UV bolometric correction that integrated the entire best-fit blackbody, these values would be approximately a factor of two higher. In the left panel of Figure12we plot our derived pseudo-bolometric light curves. The number of epochs for which we can constrain the luminosity is limited for the silver transients. The energy radiated by the six gold transients between−3 and +20 days ranged from 2×1048erg (PS1-12bb) to 2×1049erg (PS1-11qr).
For comparison, we also show the pseudo-bolometric light curves of several other rapidly evolving events (right panel): SN 2002bj (Poznanski et al.2010), PTF 09uj (Ofek et al.2010), SN 2010X (Kasliwal et al.2010), and SN 2005ek (Drout et al. 2013), as well as the double peaked SN 1993J (Schmidt et al. 1993). The curves for SN 2005ek, SN 2002bj, and SN 1993J were calculated from multi-band photometry in a manner similar to that utilized here, while the curves for SN 2010X and PTF 09uj were derived based onr-band data only. We note that SN 2005ek and SN 2010X, which have been proposed to be powered mainly by radioactive decay (Drout et al.2013; Kasliwal et al. 2010; Tauris et al.2013), are less luminous than the PS1-MDS events, while the more luminous PTF 09uj and the first peak of SN 1993J are thought to be powered by cooling envelope emission/interaction. These power sources will be discussed further in Section8.
5. SPECTROSCOPIC PROPERTIES
We obtained spectra during outburst for five transients: PS1-11bbq, PS1-12bb, PS1-12bv, PS1-12brf, and PS1-13duy. These spectra are plotted in Figure 13. One spectrum was obtained between two and four days post maximum for each event and,
Figure 12. Left panel: pseudo-bolometric light curves for the gold and silver transients. Right panel: pseudo-bolometric light curves for other rapidly evolving transients from the literature: the Type Ic SN 2005ek (Drout et al.
2013) and 2010X (Kasliwal et al.2010), the Type Ib SN 2002bj (Poznanski et al.2010), the Type IIb SN 1993J (Schmidt et al.1993), and the Type IIn PTF09uj (Ofek et al.2010).
(A color version of this figure is available in the online journal.)
in the case of PS1-12bb, a second spectrum was obtained at +33 days. The spectra shown for 11bbq, 12bv, PS1-12brf, and PS1-13duy still contain some contribution from their host galaxies, as evidenced from presence of nebular emission lines. However, both the lack of a 4000 Å break and the faint apparent magnitude of all four hosts (23–25 mag) give us confidence that a majority of the continuum is due to the transient itself.
5.1. Basic Properties and Comparison to Other Events From Figure 13 we see that the spectra are dominated by continua as opposed to strong P Cygni features. Four of the events, PS1-11bbq, PS1-12bv, PS1-12brf and PS1-13duy, show blue continua21, while PS1-12bb is consistent with a blackbody of 6000–7000 K. PS1-12bb also showed redder photometric colors and a distinct SED evolution (Section4). Of the events, PS1-12bv shows the strongest evidence for broad spectral features, with the most evident near 3900 Å.
Spectra dominated by blue continua have been observed in previous SNe. They are typically found in objects that are hot, optically thick, and powered by cooling envelope emission or interaction. For instance, although SN 1993J later went on to develop a plethora of P Cygni features indicative of a Type IIb SNe, during its initial light curve peak (attributed to cooling envelope emission and recombination) its spectrum was dominated by continua with only a few features between 4000–5000 Å. Hydrogen lines were not evident in the early
21 A spectrum of the bronze sample object PS1-13bit was obtained using the
OSIRIS instrument at the Gran Telescopio Canarias under progra GTC2007-12ESO (PI: R. Kotak). R. Kotak (2007, private communication) reveals that it is similarly dominated by a blue continuum with no narrow emission or absorption features.
Figure 13.Explosion spectra for five PS1-MDS transients (colored) in compar-ison to events from the literature (black). With the exception of PS1-12bb our events are dominated by a blue continuum, with a lack of strong P Cygni fea-tures. Some contributions from the host galaxy (e.g., nebular emission lines) are still present in these events. PS1-12bb shows a redder continuum and a notable lack of broad nebular features at + 33 days. The top panel shows literature ob-jects thought to be powered by cooling envelope emission/interaction while the bottom panel shows objects powered by radioactive decay (Type Ib SN 2002bj Poznanski et al.2010; Type IIb SN 1993J Barbon et al.1995; Type IIn PTF 09uj Ofek et al.2010; Type Ia SN 2011fe Pereira et al.2013; Type Ic SN 2007gr Valenti et al.2008; Type Ic SN 2005ek Drout et al.2013; Type Ic SN 2010X Kasliwal et al.2010).
(A color version of this figure is available in the online journal.)
spectra. In addition, the rapidly evolving Type IIn SN PTF 09uj (attributed to shock breakout/interaction) has only weak narrow emission lines in its spectra near maximum, and is dominated by a blue continuum. Given the signal to noise of our spectra, it is unlikely that we would be able to identify similar emission features in our events if they were present. Thus, based on the quality and coverage of our spectra, we are unable to conclude whether the objects in our sample are hydrogen-rich or hydrogen-poor.We plot spectra of SN 1993J and PTF 09uj, as well as the blue rapidly evolving SN 2002bj (whose power source is still under debate), in the top panel of Figure13.
In contrast, SNe that are powered mainly by radioactive decay (Type Ia/b/c SNe) are typically dominated by P Cygni features formed in the outer ejecta layers. In particular, they often possess strong line blanketing in the blue due to the presence of iron peak elements. We plot several examples in the lower panel of Figure13. We see that our spectra more closely resemble events that are powered by interaction/recombination, as opposed to radioactive decay.
Figure 14.Mgiiabsorption in the spectrum of PS1-12bv. Left: vertical lines mark the systemic velocities of the host galaxy as measured from [Oii]λ3727 and Hβin emission. The red line signifies the extent of the resolved blue “shelf,” which may be due to absorption in the CSM surrounding the progenitor. Right: an example multiple component fit to the absorption feature. The green (blue) components are blue shifted∼700 km s−1(1500 km s−1) with respect to the
host galaxy and have a FWHM of 550 km s−1(900 km s−1). The galaxy [Oii] λ3727 feature has a FWHM of 300 km s−1.
(A color version of this figure is available in the online journal.) 5.2. Lack of Nebular Features in PS1-12bb
We obtained two spectra for PS1-12bb. At the time of the second epoch (+33 days) thei-band light curve of PS1-12bb had declined by∼3 mag. Similar to the spectrum obtained near maximum light, this spectrum is dominated by continuum (with some contribution from its host galaxy’s light). This is in contrast to any other “late time” spectra of a rapidly declining SN that has been obtained to date. Both SN 2005ek (Drout et al.2013) and SN 2010X (Kasliwal et al. 2010) were observed between 10 and 35 days post-maximum. Both events (Type Ic) displayed a growing emission component in the Caii NIR triplet. By +23 days the spectrum of SN 2010X was dominated by the CaiiNIR triplet between 8000 and 9000 Å. This is not the case for PS1-12bb. We can place a limit on the luminosity in the Caii
NIR triplet between 8300–8700 Å at + 33 days in PS1-12bb of
<3×1039erg s−1. This is approximately 4 times lower than the feature observed in SN 2010X at a similar time. PS1-12bb was also our only object whose best-fit blackbodies did not show radii that expanded with time. Thus, this transient may be of a different kind than a SN with an expanding ejecta that eventually becomes optically thin.
5.3. Potential CSM Absorption in PS1-12bv
The emission lines present in Figure13are unresolved and attributed to the host galaxies. However, in the spectrum of PS1-12bv there is tentative evidence for circumstellar material (CSM) absorption in the Mgii(λλ2796,2803) feature. A view around this feature is shown in the left panel of Figure14. The spectrum of PS1-12bv shows unresolved nebular emission lines of [Oii]λ3727 and Hβ at a redshift ofz=0.405. In contrast, the two deepest features of the Mgii(λλ2796,2803) absorption feature are blue shifted by∼700 km s−1 relative to the galaxy emission lines (z=0.402) and there is a resolved blue wing to the feature. This blue wing spans anadditional∼1000 km s−1 from the minimum of the absorption feature. Our resolution corresponds to∼400 km s−1in this wavelength region.
A similar blue absorption wing was seen in the spectra of the Type IIn SN 1998S (Bowen et al. 2000), although in this case the wing spanned only∼350 km s−1 from the absorption minimum. Both Bowen et al. (2000) and Chugai et al. (2002) credit this “shelf” of absorption to the CSM around the explosion
Table 5
Host Galaxy Properties
Event mobs,i log (O/H) + 12a Methodb log(Mgal/M) SFR sSFR Offset Offset Norm. Offsetc
(mag) (measured) (Myr−1) (Gyr−1) (arcsec) (kpc)
PS1-10ah 18.08 (0.02) 8.49 (0.03) PP04N2 9.12+0.18 −0.21 ∼1.2 ∼0.9 0.42 0.68 0.21 PS1-10bjp 19.22 (0.03) 8.38 (0.05) PP04N2 9.12+0.18 −0.24 ∼2.1 ∼1.6 0.95 2.39 0.85 PS1-11qr 19.80 (0.06) 8.85 (0.08) PP04N2 10.17+0.20 −0.37 ∼4.3 ∼0.3 1.54 12.58 0.98 PS1-11bbq 24.40 (0.15) 8.67 (0.14) Z94 8.01+0.61 −0.70 >0.3 >2.4 0.47 8.81 1.05 PS1-12bb 16.59 (0.01) 8.79 (0.11) PP04N2 10.54+0.43−0.12 ∼2.3 ∼0.06 4.93 10.99 1.92 PS1-12bv 22.01 (0.20) · · · 9.89+0.62−0.52 >0.3 >0.03 0.97 10.29 0.50 PS1-12brf 22.04 (0.21) 8.6 (0.2) KD02 8.73+0.20 −0.17 >0.3 >0.5 0.42 2.90 0.69 PS1-13duy 22.20 (0.04) 8.6 (0.2) KD02 8.78+0.15 −0.12 >0.1 >0.2 0.33 2.16 0.44 PS1-13dwm 21.38 (0.08) <8.4 PP04N2 8.96+0.27 −0.01 ∼1.9 ∼2.0 1.40 8.28 0.82 PS1-13ess 22.54 (0.08) 8.43 (0.03) M91 8.68+0.07−0.13 ∼4.5 ∼9.3 0.14 1.04 0.32 Notes.
aMetallicity measured from host galaxy spectra. Diagnostics utilized varied between objects.
bDiagnostic used to obtain Column 2. PP04N2=Pettini & Pagel (2004); Z94=Zaritsky et al. (1994); KD02=Kewley & Dopita (2002); M91
=McGaugh (1991).
cOffset normalized by theg-band half-light radius of the host galaxy.
and Chugai et al. (2002) invoked radiative driving to accelerate relatively slow moving CSM material (40–50 km s−1) to these
velocities. In our case, if the blue component is due to CSM absorption, we would require either stronger radiative driving or a faster CSM wind speed. The CSM wind speed found for SN 1998S was typical for a RSG wind, whereas the speeds required for PS1-12bv would be more indicative of a wind from a WR or luminous blue variable star. PS1-12bv is one of our four most luminous objects and is very similar photometrically to PS1-11qr, PS1-11bbq, PS1-13duy and PTF 09uj (which was hypothesized to be due to the shock breakout from an optically thick wind; Ofek et al.2010). This broad feature may therefore point to a progenitor star that possesses a strong wind in the years before explosion for these transients.
Alternatively, this feature could be explained by either a complex interstellar medium (ISM) absorption system along the line of sight or an outflow from the host galaxy. In order to investigate this possibility, we fit pairs of Mgii(λλ2796,2803) doublets with varying redshifts and FWHM to this portion of the spectrum. An example fit is shown in the right panel of Figure14. Blue and green lines show the individual Mgii
(λλ2796,2803) doublets, and the red line shows their sum. In all cases, we required absorption components that were both resolved and significantly broader than typical ISM absorptions (100 km s−1).
6. HOST GALAXIES
Our method of selecting rapidly evolving SNe was not de-signed to select transients from a single explosion mechanism/
progenitor. However, on the whole, the objects we identified within the PS1-MDS have a similar set of photometric and spectroscopic properties (blue colors, spectra dominated by con-tinua, etc.). We now turn to the host galaxies of these explosions to see what insight they can provide into their progenitor popula-tions. In Figure15we display the host galaxy spectra obtained for six of the transients. These are supplemented by the host galaxy lines present in the explosion spectra (Figure13). Nebu-lar emission lines, indicative of active star formation, are found in the spectra of all 10 galaxies. In the sections below we exam-ine the masses, metallicities, star formation rates (SFRs), and
Figure 15.Host galaxy spectra for six of the gold/silver transients. Nebular emission lines are labeled by dashed vertical lines.
explosion site offsets of the host galaxies in comparison to the hosts of other classes of transients.
6.1. Mass
After correcting the host griz-band photometry for Milky Way extinction we use the FAST stellar population synthesis code (Kriek et al. 2009) to calculate the total stellar mass contained within our host galaxies. Our models utilized the Maraston (2005) stellar library and assumed an exponential star formation history and Salpeter IMF. The total extinction was restricted to<0.05 (motivated by the Balmer decrement in our highest quality host spectra and the blue colors of our transients; the assumed extinction does not significantly affect the resulting mass). The results from this analysis are listed in Table5.
The total stellar mass in the host galaxies ranges from 8.0<
log (M/M)<10.6 with a median value of log (M/M)=9.0. In the first panel of Figure16we plot the cumulative distribution of our host masses in comparison to the CC-SN and long gamma-ray burst (LGRB) samples from Svensson et al. (2010). A larger fraction of our sample’s hosts appear at relatively low masses in comparison to the CC-SN. A Kolmogorov–Smirnov (K-S)
Figure 16.Cumulative distributions of various host galaxy properties: stellar mass, metallicity, star formation rate, and specific star formation rate. In all panels the red line(s) represents the rapid evolving SNe presented in this work. In panels 3 and 4 the solid red line represents the six gold/silver objects with host galaxy spectra and the dashed red line includes lower limits based on the explosion spectra of the remaining four objects. Also shown are distributions from LGRBs and core-collapse SNe (black and green lines, respectively; see text for references). The dashed green line in panel 2 is theuntargetedType Ibc SN from Sanders et al. (2012). The vertical dashed line in panel 2 signifies solar metallicity.
(A color version of this figure is available in the online journal.)
test yields a 14% (37%) probability that the rapidly evolving transients hosts are drawn from the same population as the CC-SN (LGRB) hosts. Thus, while our host galaxies skew slightly toward lower masses, there is no statistical evidence for a different parent population from either LGRBs or CC-SNe.
6.2. Metallicity
Using the Markov Chain Monte Carlo method described in Sanders et al. (2012) we measure the emission line fluxes and metallicities of nine of the host galaxies. Due to the varying wavelength coverage and quality of our spectra, it was not possible to use the same strong line diagnostic for all of the galaxies. In Table5 we list both the measured value and the diagnostic utilized. For the purposes of comparison, we then convert all of the values to the R23 system of Kewley & Dopita (2002) using the calibration relations from Kewley & Ellison (2008).
Many of the host galaxies have metallicities that are roughly solar, with a median value of log (O/H) + 12 =8.8. In the second panel of Figure16we plot their cumulative distribution. Our hosts are offset to a significantly higher metallicity than either LGRB hosts (Svensson et al.2010; Savaglio et al.2009; Levesque et al. 2010a; Levesque et al. 2010b; Graham & Fruchter2013) or the untargeted Type Ibc hosts from Sanders et al. (2012) (black line and dashed green line, respectively) with a0.5% probability of being drawn from the same population. The entire CC-SN sample from Kelly & Kirshner (2012) (solid green line) is shifted to even higher metallicities than our sample, although we caution a fraction of these events were discovered by targeted surveys (which bias toward higher metallicities).
6.3. Mass–Metallicity Relation
In Figure17we plot the stellar mass versus metallicity for nine of the transients (red stars) versus the∼53,000 SDSS star-forming galaxies from SDSS (Tremonti et al. 2004, shaded regions). Also shown are the low redshift LGRB hosts from Levesque et al. (2010b, black). The hosts of the PS1-MDS rapidly evolving SNe appear to be consistent with the bulk of star-forming galaxies in SDSS. This is in contrast to the hosts of LGRBs and Type I SLSNe, both of which have been shown to obey a relation in the mass–metallicity plane that is offset below the bulk of star-forming galaxies (Levesque et al.2010b; Lunnan et al.2014).
Figure 17.Mass–metallicity relation for nine gold/silver transients (red stars). Also plotted are contours representing the 53,000 SDSS star-forming galaxies from Tremonti et al. (2004) (shaded region, lines represent the 2.5, 16, 50, 84, and 97.5 percentile of the distribution in each bin) and the long-duration GRB hosts from Levesque et al. (2010b). Unlike the LGRB hosts, which are offset to lower metallicities, our sample is consistent with being drawn from the greater SDSS population.
(A color version of this figure is available in the online journal.)
6.4. Star Formation Rates
We estimate host galaxy SFRs for the six events for which we possess galaxy spectra (Figure15) by measuring their Hα
line fluxes and applying the relation of Kennicutt (1998). In each case we apply a rough correction for the covering fraction of our spectra by scaling to our PS1 photometry of the hosts. We do not correct for intrinsic extinction. In the three cases where both Hαand Hβare detected the decrement is reasonably consistent with zero extinction. The resulting SFRs range from 1–5Myr−1and are listed in Table5. For the four remaining
objects we may place lower limits on the SFR by measuring the Hβ emission line flux from the explosion spectra (Figure 13) and assuming zero extinction. We do not attempt to correct for the covering fraction in these cases. The lower limits range from 0.1–0.3Myr−1. In the second and third panels of Figure16we
plot the cumulative distribution of our SFRs and specific SFRs in comparison to the CC-SN and LGRB hosts from Svensson et al. (2010). Although the small number of events limits the
Figure 18. Projected host offsets for our sample (red) in comparison to other astronomical transients. Left panel: physical offsets. Right panel: offsets normalized by theg-band half-light radii of the hosts. Our sample most closely traces the distribution of core-collapse SN offsets.
(A color version of this figure is available in the online journal.)
conclusions we can draw, there is no statistical evidence that the samples are drawn from different progenitor populations. The SFRs measured for our hosts are clustered around the median value observed for both CC-SNe and LGRBs.
6.5. Explosion Site Offsets
Using the PS1 centroid positions (good to∼0.1) we measure the separation between the location of the transient and the center of its host galaxy. The cumulative distribution of these offsets (in physical units) are shown in the left panel of Figure18(red line). Also shown are distributions of Type Ia, Type Ibc and Type II SNe (Prieto et al.2008, blue, green, and cyan, respectively), short-duration GRBs (Fong & Berger2013, dashed black; SGRBs), and LGRBs (Bloom et al.2002, solid black).
In the right panel of Figure18 we normalize these offsets by the g-band half-light radius of the host. Also shown are Type Ia SN (Galbany et al.2012, blue), Type Ibc, and Type II SNe (Kelly & Kirshner2012, green and cyan, respectively), and the same LGRB and SGRB samples as described above. For objects with high signal to noise SDSS detections, we use the Petrosian half-light radius from SDSS DR9. For others (PS1-11bbq, PS1-13duy, and PS1-13ess), we estimate the half-light radius based on the light within a 3 radius of the centroid location within the PS1 deep stacks (we caution that these values are more uncertain). Both the physical and normalized offsets are listed in Table5. Our sample most closely resembles the normalized offsets of Type Ibc and Type II SNe, indicating that, at least in this context, our explosion sites are consistent with the environments in which one can expect to find massive stars.
7. VOLUMETRIC AND RELATIVE RATES
In this section we use information on the true cadence and sensitivity obtained by the PS1-MDS between 2009 December and 2014 March to calculate the volumetric rate of rapidly evolving transients similar to those presented in this work. Because these objects were identified based on their light curve morphology, rather than spectroscopic classification, we avoid the observer-dependent bias that results because resources limit
our spectroscopic follow-up to roughly 10% of the transients discovered in the PS1-MDS.
Because their timescale is rapid, even short observing gaps due to poor weather or maintenance can have a significant effect on the efficiency with which the survey detects these transients. We therefore use a Monte Carlo approach similar to that utilized in Quimby et al. (2012,2013) to calculate the efficiency with which each PS1-MDS field can recover these transients as a function of distance.
We begin by constructing light curve and temperature evo-lution templates based on the gold transients (Figure 1). We then construct a luminosity function that consists of an in-trinsic Gaussian distribution modified by an exponential func-tion to account for host galaxy absorpfunc-tion. In following with Quimby et al. (2013) we adoptP(AV) ∝eAV/τ withτ = 0.6
(Hatano et al.1998) for the host galaxy absorption. As a starting point for the intrinsic distribution we adopt a Gaussian with the same mean and variance as the (rest-frame) peak magnitudes of our gold sample after performing a V/Vmax correction for the Malmquist bias. As a check we performed several Monte Carlo simulations distributing 500 objects drawn from this dis-tribution evenly in space. The objects with apparent magnitudes
>1.5 mag above the nominal PS1 detection limit (a rough proxy for detectability) agree well with our observed transients in both luminosity and distance. The nominal values for the intrinsic (i-band) Gaussian distribution we adopt below are μ =
−17.2 mag andσ =1.0 mag.
For each PS1-MDS field we then determine the detection efficiency within 140 distance bins betweenz=0.005 andz=
0.7. We performed 10,000 iterations of the following process within each distance bin: (1) randomly select one of the six templates, (2) choose a peak absolute magnitude from the aforementioned luminosity distribution, (3) choose a random distance within the distance bin, (4) k-correct the template light curves, assuming the spectra can be approximated as a blackbodies described by the temperature evolution template, (5) choose a random explosion epoch between 2009 December and 2014 March, (6) map the resulting explosion onto theactual dates PS1 observed each filter for that PS1-MDS field, (7) assign random noise to each epoch that is pulled from the actual distribution of noises obtained by transients found in the PS1-MDS on that epoch in that filter, and finally (8) run the resulting synthetic data through the same light curve selection criteria described in Section2. The efficiency within each distance bin is then calculated as the fraction of the 10,000 iterations that were recovered.
In Figure19we plot the resultant efficiencies for each PS1-MDS field (colored lines) as well as the survey as a whole (solid black line). The survey detection efficiencies range from∼11% nearz∼0.1 to0.1% atz∼0.7. The quoted efficiencies are for the entire duration of the PS1 survey (2009 December to 2014 March), while any given PS1-MDS field is only observed for roughly half of this time period. The in-season efficiency at z ∼ 0.1 for the survey was approximately 25%. This demonstrates how much influence small, in-season, observing gaps can have on the detection of such rapid transients.
Using these efficiencies we calculate the volumetric rate of these rapid and luminous transients as
R=N iViti
, (1)
where i, Vi, and ti are the efficiency, comoving volume,


![Figure 14. Mg ii absorption in the spectrum of PS1-12bv. Left: vertical lines mark the systemic velocities of the host galaxy as measured from [O ii] λ3727 and Hβ in emission](https://thumb-us.123doks.com/thumbv2/123dok_us/8994377.2797325/12.918.75.438.84.602/figure-absorption-spectrum-vertical-systemic-velocities-measured-emission.webp)


