Network-Marketing: Intelligent Data Control System
using Data Mining Technique
H.S. Fadewar1, S.B. Jagtap1, G.N.Shinde2
Summary
Data Mining (DM) techniques are well-known for providing flexible and effi-cient analytical tools for data processing. In this paper, we propose intelligent data control system design and specifications as an example of DM application in mar-keting data processing. E-Marmar-keting businesses are using Data Mining to identify patterns in customers’ buying behavior; identify profitable customer segments; in-crease marketing return rates; prevent loss of valuable customers; estimate credit risk; identify fraudulent activity and much more.
keywords: Data mining, E-Market, E-Business, Network-Marketing, Intelli-gent data control system.
Introduction:
There are several definitions of Data Mining in use today. Broad definitions suggest that Data Mining is the exploration and analysis of large data sets. Un-der such definitions reporting, graphing, traditional statistics and sophisticated ma-chine learning are all considered Data Mining. In this document we use a more narrow definition of Data Mining that stresses the discovery aspect of the disci-pline. Specifically, we see Data Mining as relationships in large volumes of data. These patterns help explain past events as well as predict future events.
E-Marketing is a way of managing a business so that each important business decision is made with full knowledge of the impact it have on the customer. It deals with all the steps between determining customer needs and supplying them at a profit. It entails drawing a management plan that views all marketing components as part of a total system that requires effective strategic planning, organization, leadership, and control[1].
Network-Marketing, Size & Growth
Customer targeting is one way to get closer and to create and sustain a two-way flow of communication between the seller and the buyer. In today’s world, getting close to the customer is particularly important when one considers that the average consumer is bombarded with a multitude of commercial message daily. The following are the steps for Network-Marketing process on the Internet[2,3].
Step 1. Segment and identify potential customers.
1Assistant Professor, Swami Vivekanand Institute of Technology and Management, Udgir,
2Corresponding author. Principal, Indira Gandhi ( Sr.) College, CIDCO, New Nanded (M.S.)
Step 2. Create promotional, advertising and training material.
Step 3. Put the material on customer’s computer screen using network-marketing (Push-based, Pull-based marketing)
Step 4. Interacting with customers.
Step 5. Learning from customers ( Feedback)
Step 6. Create Intelligent Data and save in Database
Step 7. Retrieve intelligent data using DM techniques for to attract customer.
Step 8. Provide On-line services to customers.
Perhaps the most widely recognized use of Data Mining is in the commercial market. According to a 2002 report from IDC, the Data Mining market is expected to grow at a CAGR of 13% to reach $823 million in 2006. This growth can be attributed to at least four key factors.
1. There are more information sources available today than ever and the amount of information is growing exponentially.
2. The explosive growth in the capacity of databases along with the shrinking cost of data storage has made it possible to acquire, store and manage more data than ever.
3. Using Data Mining techniques used to require complex programming skills. Today, there are extremely powerful Data Mining tools on the market that are easy to use making Data Mining more accessible to a broader audience. Many operational suite vendors are beginning to embed data mining into their applications.
4. The highly competitive market environment and growing customer options makes customer intelligence more critical for business performance. This has created an increased appetite for rapidly finding knowledge from vast amounts of data.
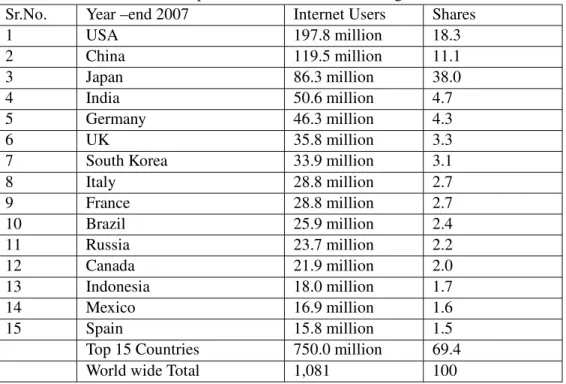
The worldwide number of Internet users has surpassed 1 billion in 2007 up from only 45M in 1995 and 420M in 2000. The 2 billion Internet users milestone is expected in 2011. Much of current and future Internet user growth is coming from populous countries such as China, India, Brazil, Russia and Indonesia. India is now in 4th place in Internet users.
Application of Data Mining to Marketing Data
To develop successful applications of DM techniques to marketing data, the following issues must be dealt with:
Aggregated data
Data analysts are confronted with the problem of processing data that go be-yond the classical framework, as in the case of data concerning more or less ho-mogeneous classes or groups of individuals (second-order objects or macro-data), instead of single individuals (first-order objects or micro-data).
Table 1: Top 15 Countries in Internet Usage
Sr.No. Year –end 2007 Internet Users Shares
1 USA 197.8 million 18.3 2 China 119.5 million 11.1 3 Japan 86.3 million 38.0 4 India 50.6 million 4.7 5 Germany 46.3 million 4.3 6 UK 35.8 million 3.3
7 South Korea 33.9 million 3.1
8 Italy 28.8 million 2.7 9 France 28.8 million 2.7 10 Brazil 25.9 million 2.4 11 Russia 23.7 million 2.2 12 Canada 21.9 million 2.0 13 Indonesia 18.0 million 1.7 14 Mexico 16.9 million 1.6 15 Spain 15.8 million 1.5
Top 15 Countries 750.0 million 69.4
World wide Total 1,081 100
Source: IOAI, The Power shopper: E-Commerce sector Report, 2007
Data Quality
According to Total Quality Management (TQM), data quality can be consid-ered as consistently meeting customers’ expectations. There are several aspects of data quality, like integrity, validity, consistency, and accuracy. Data Quality Mining (DQM) can be defined as the deliberate application of DM techniques for the pur-pose of data quality measurement and improvement. The goal of DQM is to detect, quantify, explain, and correct data quality deficiencies in very large databases[4]. There are many starting points to employ today’s common DM methods for the purposes of DQM. Methods for deviation and outlier detection seem promising. But it is also straight forward to employ clustering approaches and dependency analysis for data quality purposes. Basically, we can classify the application of DM to improve data quality in these four important aspects:
Measuring and explaining data quality deficiencies,
correcting deficient data extension of KDD process
mod-els to reflect the potentials of DQM
development of specialized process models for pure DQM
Timeliness
Timeliness can be considered another aspect of data quality. Public and private organizations are currently urged to reduce the delay between the time of data col-lection and the moment in which decisions are made according to some statistical indicators. A typical example is the lamination rate computed by the European In-stitute of Statistics and the decision made by the Central Bank of Europe (BCE) on the tax rate. A timely delivery of data analysis results may involve the synthesis of new indicators from official data, the design of different infrastructures for timely data collection, or the application of anytime algorithms, which provide the data miner with a ready-to-use model at any time after the first few examples are seen and guarantee a smooth quality, increasing with time.
Confidentiality
Data mining may seem to be the antithesis of protecting the confidentiality of official statistics. A guarantee of confidentiality for the information provided is often the basis of obtaining the data. It also imposes a constraint on what can be done with the data and by whom. In this context, confidentiality issues and statistical disclosure methods have been developed to maximize the use of the data while keeping the original agreement with the data source[5].
Metadata
Mining official data implies retrieving knowledge from different surveys or administrative sources and properly interpreting them as measures of observed phenomena. Such an activity requires the availability of several classes of meta-data concerning the characteristics and the information content of each exploitable source of information.
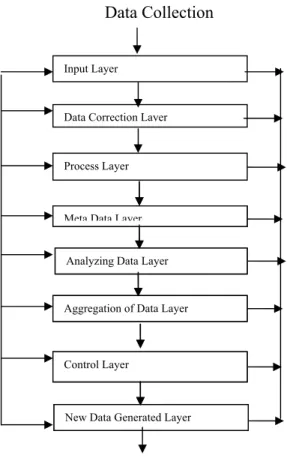
Design an intelligent Data Control system
Based on the mentioned properties for intelligent data processing system, we propose the following multi-layer architecture to reduce human supervision while minimizing the data errors throughout the system. Figure1 shows general model of IDCS system.
Input Layer
The first layer is the input of the system and all information are entered to the system through layer one. This layer consists of all algorithms and techniques for revision and Conceptual editing of the data. This layer, based on revision method and conceptual editing table, processes the data of each unit and finds the possible errors in the data set. The output of this layer is a queue of units data sets which may not be correct because of imperfectness of the intelligent processing of the system.
Data Collection
Intelligent Data
Aggregation of Data Layer Meta Data Layer
Analyzing Data Layer
Control Layer
New Data Generated Layer Input Layer
Data Correction Layer
Process Layer
Aggregation of Data Layer Meta Data Layer
Analyzing Data Layer
Control Layer
New Data Generated Layer
Figure 1: Intelligent Data Control System.
Data Correction Layer
This layer processes the output of the first layer. Based on the uncertainty about the correctness of the data in the queues (fed from first layer), a decision is taken to correct the data. After the processes of the layer, the questioners of some units may be returned for reconsideration. The data which are corrected in this way are collected and re-processed by the first layer[6].
Process Layer
In the previous two layers all the errors which were detectable by the current system were corrected. This layer is to make sure about the correctness of the data from the previous sections. It samples the data and processes them using simple techniques. The main technique used in this layer is combination of OLAP and a method to describe the structure of the current data set. OLAP is an approach to quickly provide answers to analytical multi-dimensional queries. Some parts of the
errors which may have passed through the first two layers will appear by analyzing OLAP tables and the output of the data description method. It is obvious if there is any problem in registering the data, the output the mentioned combination tech-nique will not be a logical structure. In short, this layer will report the data which the outputs of description statistics on OLAP tables don’t have logical structure [8, 9].
Meta Data Layer
In this layer, by using the information from the third layer (which was for re-ducing the structural errors of the data sets) some of the errors are corrected. To correct the errors which could not be solved in this layer, the original data need to be collected again. The output of this layer is the corrected data, meta-data and information about the structure of data. Meta-data are the information which de-scribe the actual data and are used to help the processes in other layers. Therefore, the format of meta-data should be understandable to the other layers which may use different systems other than the layer which has generated the meta-data. Exten-sible Mark-up Language (XML) is a common technique to implement meta-data flow. It should be noted the corrected data by the person who handles the original data, may also be wrong and the system can’t detect the errors. Therefore, the error will remain in the data [10].
Analyzing Data Layer
The fifth layer finds the hidden irregularities in the data. In this layer a DM program will process the database to find the errors which were not detected in the previous layers. This layer, by analyzing the situation of data vectors in each unit in the current data space tries to find the units which may have a high density data space. To perform this process, the layer uses clustering method for units. In clustering method, similar records in the data are grouped together in cluster forms which will result in having a high level view of data. The output of this layer is the values of units which they have a high density data and are in a single cluster. For this purpose, considering the common queues of units in each data-space state is very useful and informative. Alternative advanced DM techniques such as trees and networks could be used.
Aggregation of Data Layer
This layer, after receiving information from the analyzing data layer, analyses the reasons for unit vector aggregation in each section of data. This analysis is possible based on the information provided from the previous layer. Number of units in a cluster, common queues of these units, number and type of queues are some examples of the information that can be processed. By knowing the reason for aggregation of data, we can divide the data to two categories. The first category is the data which are aggregated in a specific place of the data space for a logical
reason. And the second category is the data which there is no logical reason for aggregation of them in the data space. In the second category we can consider the data which the reason of their aggregation is a common error. In the process of the reason for aggregation of data, error sources and common errors are available. This layer can generate meta-data for the category of data which have logical reason for aggregation. The meta-data is used in future processes [7, 8].
Control Layer
This layer is a control and correction layer to monitor the generated clusters in previous layers. Two sources of error may introduce false data to the system which result in generating incorrect cluster groups. The first source of data is the mistakes which are made in the data collection process and may happen by the person who collects data. The other source of errors is the imperfectness of the intelligent system in previous layers which could be reducing by adaptively training the system over time. The algorithm in the layer tried to correct the errors based on the reports and meta-data from the previous layers. At this point some questioners may be returned for correction [9].
New Data Generated Layer
In the layers introduced so far, meta-data and new data has been generated. The last layer makes use of these data to monitor and correct possible errors from pre-vious layers. The most important feature of this layer is to make use of meta-data produced in the process to correct the system. To make the system independent and self-correcting, We need to convert the information to knowledge and Meta knowl-edge. With the use of this information the previous knowledge and the questioners are reviewed. Furthermore, the data enables to monitor the behavior of system itself for improvement and optimization. Therefore, this layer has two important roles: First is to consider the changes within the system to keep it optimized (process control). Second is to generate knowledge based on the meta-data and information which is generated during the process and use the generated knowledge in the lower layers [11-14].
Conclusion
Data mining (DM) is a growing discipline which originated outside statistics in the database management community, mainly for commercial concerns. The proposed intelligent data control system using DM for marketing data effectively enhance the network marketing process to identify patterns in customers’ buying behavior; identify profitable customer segments; increase marketing return rates; prevent loss of valuable customers; estimate credit risk; identify fraudulent activity and much more.
References
1. Zenobi, G., & Cunningham, P. (2002). An approach to aggregating ensem-bles of lazy Learners that supports explanation. Lecture Notes in Computer Science, 2416, 436- 447.
2. Zhang, J., Shi, Y., & Zhang, P. (2005). Several multi-criteria programming methods for classification. Working Paper, Chinese Academy of Sciences Research Center on Data Technology & Knowledge Economy and Graduate University of Chinese Academy of Sciences, China.
3. G.N.Shinde and H.S. Fadewar (2004) Image in E-business using VRML technique, Library Progress, Vol .24 (No.2) PP 109-112.
4. Zheng, J., Thylin, M., Ghorpade, A., Xiong, H., Persidsky, Y., Cotter, R., Niemann, D., Che, M., Zeng, Y., Gelbard, H. et al. (1999). Intracellular CXCR4 signaling, neuronal apoptosis and neuropathogenic mechanisms of HIV-1-associated dementia.Journal of Neuroimmunology, 98, 185-200. 5. Zheng, J., Zhuang, W., Yan, N., Kou, G., Erichsen, D., McNally, C., Peng,
H.,Cheloha, A., Shi, C., & Shi, Y. (2004). Classification of HIV-1-mediated neuronal dendritic and synaptic damage using multiple criteria linear pro-gramming.Neuroinformatics,2, 303-326.
6. Berry, Michael J. A. and G. Linoff, (1997), Data Mining Techniques: for marketing, Sales, and Customer Support, John Wiley and Sons.
7. Bowers, D. G., and S. L. Seashore, (1966), Predicting Organizational Effec-tiveness with a Four Factor Theory of Leadership, Administrative Science Quarterly, 11 (September).
8. Clemen, R. T., (1991),Making Hard Decisions: An Introduction to Decision Analysis, Belmont, Duxbury Press.
9. Culman, M. J. and B. Gutek,(1989), “Why Organizations Collect and Store Information” in Stohr, E. A. and B.R Konsynski,Information Systems and Decision Processes, Los Alamitos, IEEE Computer Society Press.
10. K. Hammouda and M. Kamel, (2002) Sphrase-based document similarity based on an index graph model. In ICDM02, pages 203–210.
11. R. Y. K. Lau, P. Bruza, and D. Song, (2004) Belief revision for adaptive information retrieval. In SIGIR, pages 130–137.
12. Y. Li, C. Zhang, and S. Zhang, (2003) Cooperative strategy for web data mining and cleaning. Applied Artificial Intelligence, 17(5-6): pages 443– 460.
13. G. N. Shinde and H.S.Fadewar (2007) Policy and Management in E-Security for E-Business, National conference on networking security at S.F.S. Col-lege, Nagpur, Pages 11- 15.