Development of bioinformatics tools for the
rapid and sensitive detection of known and
unknown pathogens from next generation
sequencing data
Dissertation zur Erlangung des Grades
eines Doktors der Naturwissenschaften (Dr. rer. nat.)
am Fachbereich Mathematik und Informatik
der Freien Universität Berlin
von
Simon Tausch
Berlin
August 2018
Erstgutachter: PD. Dr. Bernhard Y. Renard
Zweitgutachter: Prof. Dr. Andreas Nitsche
i Betreuer: PD Dr. Bernhard Renard
ii
Acknowledgements
First and foremost, I want to thank my supervisors, Andreas Nitsche and Bernhard Renard, for their active support, their advice and the excellent scientific environment they provided me with. While always having an open ear for my questions, they also gave me the freedom to follow my own ideas. Both of them never hesitated to entrust me with any project I showed interest in, which gave me the chance to gain insight into a variety of highly interesting topics. Beyond that, both of them provided a cordial atmosphere.
Furthermore, I want to thank my mentor Wojtek Dabrowski, without whom I would probably never have gotten in touch with the field of this work. He was never short on a good advice, nor of chocolate and coffee.
I also want to thank my fellow PhD students and other colleagues, who created a great working environment. Andreas Andrusch, with whom I could debate any idea that came to my mind; Tobias Loka, who was always up for a constructive discussion and worked most thoroughly on the code of HiLive; Benjamin Strauch for the implementation of LiveKraken and his readiness to help out in urgent situations; Claudia Kohl and Jeanette Klenner for a warm welcome and the opportunity to work on their data; Kathrin Trappe, who always was a great partner for a frank and honest discussion; Christine Jandrasits, who always found the time to organize extracurricular activities, helping to shape the great atmosphere in the group; Ursula Erikli for copy-editing my manuscripts and her help with any administrative burden; Ilka Schlenther, Marica Grossegesse, Annika Brinkmann, Aleksandar Radonic and many others who remain unmentioned but were around and kept me smiling over the last years.
Credit also goes to all students who contributed projects or theses to my research, namely Frederike Heinitz, Sophie Meier zu Ummeln, Jakob Schulze, Matthias Wajnberg and Kristina Kirsten. Although not all their work could be part of this thesis, it was a pleasure working with each of them and the generated knowledge has been of great value, whether for this thesis or for follow-up projects. Special thanks go to Frederike Heinitz for copyediting this work.
I would not have gained such a broad insight into various fields of work without the different collaboration partners, namely Prof. José Esparza, Prof. Clarissa Damaso, Prof. Manja Marz, Dr. Gudrun Wibbelt and Dr. Cesare Gruber among others. Each of them allowed me a glimpse at different topics, institutions and working cultures.
The help of the technical assistants shall not be left unmentioned: Jule Hinzmann, who has worked passionately on the squirrelpox project and was always open for a chat as well as Angelina Targosz and Jule Tesch, who sequenced countless samples together with Jule Hinzmann and therefore provided the basis for my work.
Last but not least, I am deeply grateful to my family – Ingrid, Hubert and Sarah Tausch for their wonderful support in whatever I did, do and will do. And to my friends – you know who you are – for always being there when I need to free my mind.
Greatest thanks to my beloved wife, Sandra Tausch, who is always there for me and made me the greatest present with the birth of our son Lion Tausch.
Lion, I also want to thank you. Even though not always making things easier, you provide me with unlimited motivation and joy. I dedicate this work to you.
iii
Abstract
Infectious diseases still remain one of the main causes of death across the globe. Despite huge advances in clinical diagnostics, establishing a clear etiology remains impossible in a proportion of cases. Since the emergence of next generation sequencing (NGS), a multitude of new research fields based on this technology have evolved. Especially its application in metagenomics – denoting the research on genomic material taken directly from its environment – has led to a rapid development of new applications. Metagenomic NGS has proven to be a promising tool in the field of pathogen related research and diagnostics.
In this thesis, I present different approaches for the detection of known and the discovery of unknown pathogens from NGS data. These contributions subdivide into three newly developed methods and one publication on a real-world use case of methodology we developed and data analysis based on it.
First, I present LiveKraken, a real-time read classification tool based on the core algorithm of Kraken. LiveKraken uses streams of raw data from Illumina sequencers to classify reads taxonomically. This way, we are able to produce results identical to those of Kraken the moment the sequencer finishes. We are furthermore able to provide comparable results in early stages of a sequencing run, allowing saving up to a week of sequencing time. While the number of classified reads grows over time, false classifications appear in negligible numbers and proportions of identified taxa are only affected to a minor extent.
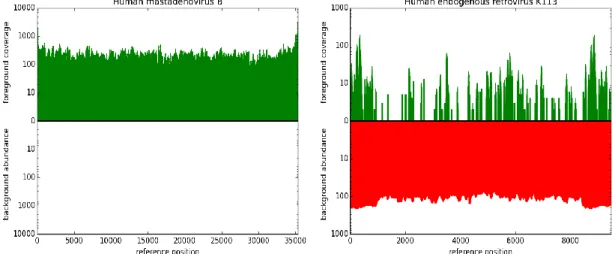
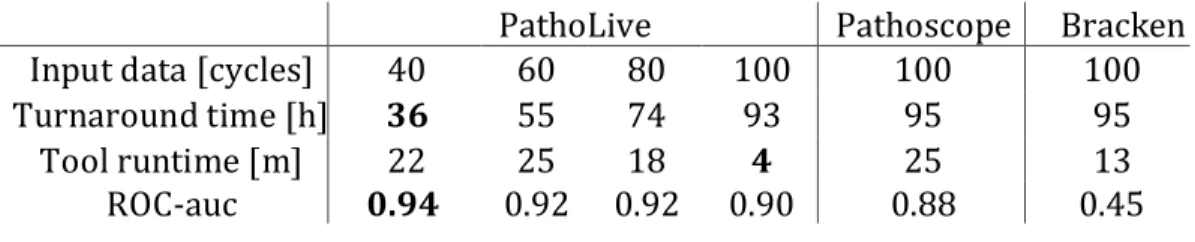
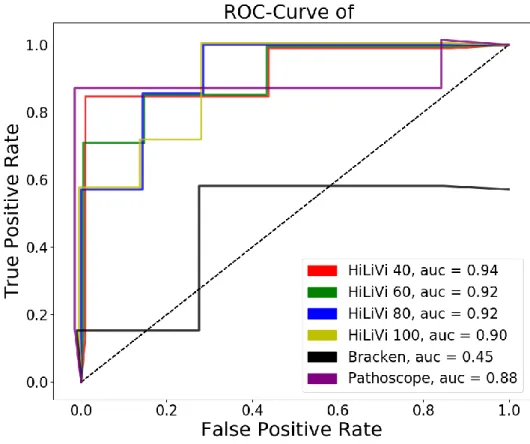
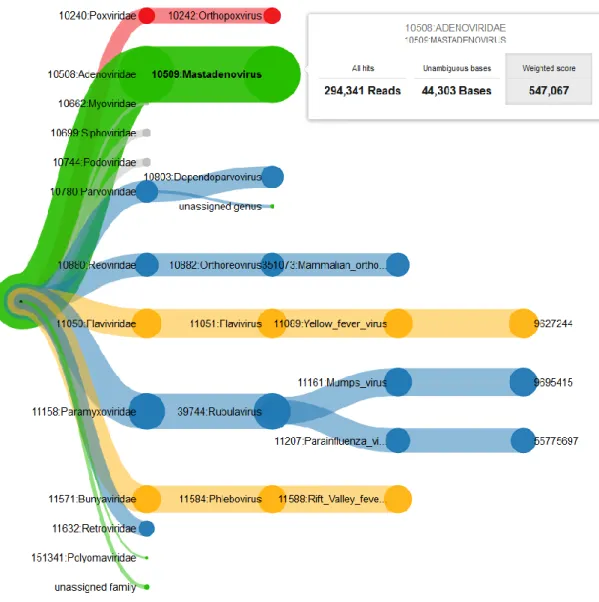
In the second project, we designed and implemented PathoLive, a real-time diagnostics pipeline which allows the detection of pathogens from clinical samples before the sequencing procedure is finished. We adapted the core algorithm of HiLive, a real-time read mapper, and enhanced its accuracy for our use case. Furthermore, probably irrelevant sequences automatically marked. The results are visualized in an interactive taxonomic tree that provides an intuitive overview and detailed metrics regarding the relevance of each identified pathogen. Testing PathoLive on the sequencing of a real plasma sample spiked with viruses, we could prove that we ranked the results more accurately throughout the complete sequencing run than any other tested tool did at the end of the sequencing run. With PathoLive, we shift the focus of NGS-based diagnostics from read quantification towards a more meaningful assessment of results in unprecedented turnaround time.
The third project aims at the detection of novel pathogens from NGS data. We developed RAMBO-K, a tool which allows rapid and sensitive removal of unwanted host sequences from NGS datasets. RAMBO-K is faster than any tool we tested, while showing a consistently high sensitivity and specificity across different datasets. RAMBO-K rapidly and reliably separates reads from different species. It is suitable as a straightforward standard solution for workflows dealing with mixed datasets.
In the fourth project, we used RAMBO-K as well as several other data analyses to discover Berlin squirrelpox virus, a deviant new poxvirus establishing a new genus of
poxviridae. Near Berlin, Germany, several juvenile red squirrels (Sciurus vulgaris) were found with moist, crusty skin lesions. Histology, electron microscopy, and cell culture isolation revealed an orthopoxvirus-like infection. After standard workflows yielded no significant results, poxviral reads were assigned using RAMBO-K, enabling the assembly of the genome of the novel virus.
With these projects, we established three new application-related methods each of which closes different research gaps. Taken together, we enhance the available repertoire of NGS-based pathogen related research tools and alleviate and fasten a variety of research projects.
iv
Contents
1 Introduction ...5
1.1 Metagenomics ...5
1.2 NGS-based pathogen detection ...6
1.3 Metagenomic data for virus discovery...8
1.4 Genome sequencing ...9
1.5 NGS data analysis ... 13
1.5.1 Read mapping ... 14
1.5.2 Read binning... 16
1.5.3 De novo assembly ... 18
1.6 Terminology and abbreviations ... 20
1.7 Thesis outline ... 21
2 Real-time metagenomic classification using LiveKraken... 27
2.1 Introduction ... 27
2.2 Materials and methods... 28
2.3 Results and discussion ... 30
3 Sensitive real-time pathogen diagnostics using PathoLive ... 32
3.1 Introduction ... 33 3.2 Methods... 36 3.2.1 Implementation ... 36 3.2.2 Validation ... 42 3.3 Results ... 43 3.4 Discussion ... 47
4 Detection of novel pathogens using RAMBO-K... 49
4.1 Introduction ... 49
4.2 Implementation ... 50
4.2.1 Simulation of reads ... 50
4.2.2 Calculation of Markov Chains ... 52
4.2.3 Classification of reads ... 54
4.3 Benchmarking... 54
4.4 Results ... 54
4.5 Additional developments ... 55
5 Discovery of a new poxvirus genus ... 57
5.1 Introduction ... 57
5.2 The Study... 57
5.3 Conclusions ... 63
6 Summary and conclusion ... 64
7 Supplementary material ... 71
7.1 List of evaluated datasets ... 71
Introduction
5
1
Introduction
1.1
Metagenomics
Metagenomics denotes research of genetic material taken directly from its environment without prior cultivation [1]. Metagenomic datasets are therefore mixtures of the genomes of heterogeneous communities of organisms. The term was introduced by Handelsman et al. in 1998 [2]. Using the literal translation from the Greek, it describes studies which are “beyond” genomics, aiming at analyzing more than a single genome at once [3].
Metagenomics have enabled answering a variety of scientific questions. Two of the most influential use cases I will focus on in particular are the study of microbial community composition and the study of genomes of organisms which cannot readily be cultured [4]. It is supposed that this applies to 99.8% of all microbes [5]. Mentionable, viruses can never be cultured independently of a host cell. But for the absolute majority of viruses, not even the host can be grown in culture [6]. Metagenomics therefore opens a door to a great unknown microbial diversity.
The first metagenomic studies were based on shotgun Sanger sequencing (s. Chapter 1.4) and therefore limited in their sensitivity [3]. To that time, most successful studies targeted low-complexity microbiomes such as these of geysers or deep sea water [4]. Still, Venter et al. were already able to study the highly complex freshwater microbiome of the Sargasso Sea in 2004 [7]. The progress in sequencing technology allowed studying more and more complex environments.
One of the best studied environments in the field of metagenomics is the human body. The collective of all microbes inhabiting the human body are called the human microbiome [8]. While the human body consists of approximately 1013 cells, it is
populated by 10 times as many bacteria and even 100 times as many viruses [9]. Although a large proportion of the human microbiome is not yet understood in detail, it is already known to have a major impact on human health. Amongst many others, there is proven correlation of the human microbiome and that of the oral microbiome and dental caries [10] or the gut microbiome on obesity [11]. Notably, pathogenic organisms such as bacteria or viruses are detectable as part of the microbiome in case of an acute infection.
Introduction
6
1.2
NGS-based pathogen detection
One field of research which is rapidly growing and already reaches out into clinical practice is NGS-based pathogen detection. In extraordinary cases of infectious diseases, diagnostic analyses can be extremely difficult. Despite huge advances in clinical diagnostics, at some medical conditions no clear etiology can be established for up to 60% of the cases [12]. Especially if the causative agent of an infection is unknown or an infection is caused by an unsuspected pathogen, common methods such as non-multiplex PCR or antibody detection are doomed to fail, as these are restricted to test for one species at a time [13].
With metagenomic NGS, a hypothesis and culture free pathogen detection method has emerged. It is based on the identification of a pathogen’s nucleic acids, be it deoxyribonucleic acids (DNA) or ribonucleic acids (RNA), in a patient sample. A classical metagenomic sample is sequenced, producing millions to billions of reads which stem from all species in the sample. The first challenge of this approach is therefore, that the majority of reads stems from the host genome in most cases. This is owed to the random sampling of reads from all nucleic acids in the sample, where the host genome is generally more abundant and magnitudes larger than the pathogen’s genome. It has been proven that 0.00001%-0.7% of the total reads from a sequencing run may have decisive influence on a successful diagnosis [12, 14]. To compensate for this, a high sequencing depth is desirable.
This leads directly to the second main issue of NGS-based pathogen detection: At very high sequencing depths, the data will contain reads from all kinds of sources. These may range from contaminations introduced with sample-taking over lab contaminations to commonly seen organisms which are regularly colonizing a person [12, 15]. As even single reads may be relevant for a diagnosis, it is extremely difficult to automatically reject any read without risking losing valuable information. Furthermore, it is often impossible to automatically distinguish a normal colonization from acute infection. As an example, human papillomavirus, known as the causative agent of a variety of different diseases including cancer, was detected in 95% of subjects in a study, with no correlation to their disease status [16].
Thirdly, the overall turnaround time of sequencing a sample at the necessary depth is too long to get actionable results in cases of acute infections or outbreak scenarios in reasonable time. Despite the massive advances in NGS, sequencing a metagenome at very high sequencing depth may still take up to 11 days on an Illumina HiSeq. This is of course too large a timespan for most diagnoses. Additionally, library preparation, data
Introduction
7
analysis and evaluation of results further prolong the overall turnaround time. In order to tackle this problem, fast sequencing protocols or usage of third generation sequencers have been proposed [17, 18]. These approaches have been shown to work in different diagnostic settings, but as all of them rely on a downscaled sequencing depth and lower quality data, the risk of missing relevant pathogens is increased. As the diagnosis can only be considered as finished after a final decision for one or more causative agents has been made, the overall turnaround time does not end when the bioinformatic analysis is completed. Bioinformatic analyses can only bring a first structure into a metagenomic dataset. We are nowhere near the point where a fully automated diagnosis could rely on bioinformatic analyses alone. It is thus very important to present the results of the bioinformatic pipelines in an understandable form to enable researchers and clinicians to get to actionable results quickly [14]. Another problem that has been stated by Dutilh et al. in [16] is the data privacy of the patient, as large proportions of their genome are sequenced as a byproduct of the metagenome sequencing. Different approaches have been implemented to solve this problem by removing human background reads from the dataset [19, 20].
Despite all described difficulties, NGS has already greatly contributed to many successful diagnoses. A variety of tools for this purpose already exist, each of them tackling some of the above-mentioned problems [21-28]. Especially in the field of encephalitis diagnostics, where hundreds of pathogens have been proven to be candidate causative pathogens, NGS based diagnostics is at the frontier to be incorporated into routine clinical application. A number of successful diagnoses has been described by Brown et al. [29]. The outstanding success of NGS-based diagnostics in this field of diseases may be owed to the relative cleanness of brain related samples, be it from a biopsy or from liquor. This can be explained by the blood-brain barrier, which keeps the brain free of most organisms which colonize other regions of the body. Yet, other diseases have been successfully diagnosed using metagenomic NGS as well. Some of these cases have been listed by Simner et al. [12]. Even commercial companies have already successfully conducted clinical tests based on NGS. For example, a commercial test was able to diagnose a sepsis induced by Capnocytophaga canimorsus
[30].Still, different methods such as polymerase chain reaction (PCR) are necessary and widely used for the confirmation of the results of NGS in diagnostic setups to date. Concluding, it can be stated that NGS as a basis for pathogen diagnostics can be expected to become a very influential method over the next years, although several issues still have to be overcome.
Introduction
8
1.3
Metagenomic data for virus discovery
Novel human pathogenic viruses, distinct from any known species, are regularly emerging in the human population. These are often zoonotic agents which can spread to humans if they have contact with infected animals, as global epidemics as SARS coronavirus [31, 32] but also local outbursts like that of ebola virus in West Africa in 2014/2015 [33, 34] strikingly proved. Furthermore, the emergence of immunosuppressive therapies has led to infections with normally nonpathogenic viruses [35]. To date, many of these pathogens have only been discovered after having caused serious harm. It is expected that there exist about 320.000 mammal-associated viral species – only about 3200 of which are known today [36, 37]. In total, viruses are expected to be the most abundant group of organisms on the world, totaling to approximately to 5.2-7.5×1031 particles [9].
The possibilities of NGS enabled a particularly large increase of the number of newly discovered viruses [9, 38, 39]. Since isolating and examining novel viruses in the wet lab is eminently difficult, the possibility to obtain a viral sequence directly from an infected host alleviates these studies in particular, as has been proven by several research projects [35]. One of the best known results is the crAssphage. It has been named by the cross-assembly strategy (crAss [40]) which was used to unveil this phage. Interestingly, it is the most abundant phage in human feces, totaling 1.68% of all reads from human fecal metagenome sequencing sample – despite its relatively small genome of under 100 kbp [41]. Still, it had not been noticed before the regular use of NGS.
Tackling this task, a variety of tools allowing the discovery of novel viruses from metagenomic samples have been developed [40, 42-56]. Still, this field of research faces many difficulties. The key hurdle is that finding viral reads in sequencing data is a needle-in-a-haystack problem. The evaluation of sequencing data from purified viral particles is comparably easy. Unfortunately, this purification in the wet lab is markedly difficult for samples containing a complex mixture of organisms [39, 57]. Furthermore, even the computational classification of reads to the highest taxonomic ranks – eukaryotes, bacteria, archaea and viruses – is a yet unsolved problem [58]. With this in mind, tools for virus discovery need to be able to handle complex mixed datasets. Furthermore, viral genomes mutate at comparably high speed. Starting at 10-8
mutations per base per generation for DNA-viruses, RNA-viruses may have mutation rates up to 10-3 per base per generation [59]. This may result in genomes highly deviant
Introduction
9
from the next known reference. To handle this problem, virus discovery tools need to be very sensitive.
Even though great advances in the development of virus discovery methods have been made, analyses are still connected with complex manual work and may even fail completely in various cases due to the aforementioned difficulties.
1.4
Genome sequencing
Genome sequencing generally denotes the determination of the order of nucleic acids in large molecules. Throughout the last 40 years, several techniques have been developed to decipher the genetic code of life.
All existing sequencing technologies rely on the measurement of a technology-specific signal which determines a piece of a nucleic acid sequence. This signal is then translated into an alphabet consisting of the corresponding bases of the nucleic acid sequenced. This step is called base calling and may also include the assignment of quality values which allow conclusions on the error-proneness of a specific base. Since it is generally uncommon (yet not impossible anymore) to sequence a complete genome in one piece, usually a molecule of interest is fragmented and deciphered piece by piece. This is either achieved by selection and sequencing of a desired part of the nucleic acid sequence, or by shotgun sequencing. The latter denotes the idea of randomly shearing a sequence into small fragments and sequencing those fragments. Albeit sounding counterintuitive, this idea facilitated the successful completion of the Human Genome Project [60, 61].
The very first technique for DNA sequencing was developed by Sanger et al. in 1977. It is based on the chain-termination method. In simple terms, a DNA template is amplified and then divided into four subsamples. Each of these is then mixed with all four standard deoxynucleotides and DNA polymerase. Additionally, one of the four corresponding dideoxynucleotides is added. When a dideoxynucleotide is added to the growing chain of bases, the polymerase reaction gets interrupted. As this happens randomly, products of random lengths are produced. All produced fragments are then submitted to a gel electrophoresis. Via the lengths of the fragments on the different bands of the electrophoresis, the order of nucleotides can be determined. This method was later improved and used for the first automated sequencing machine by Applied Biosystems in 1987. Sanger sequencing can produce reads of length of up to 1000 bp and has extremely low error rates, which is why it is still a commonly used method. On
Introduction
10
the downside, it is comparably slow and expensive compared to newer sequencing methods when measured per base [62].
Over the past 13 years, NGS has gained influence in a variety of research fields. It enables sequencing multiple DNA molecules in parallel, which is why it is also denoted as massively parallel sequencing. This parallelization resulted in a drop of sequencing cost and a raise of sequencing capability in an exponential scale.
There is a variety of technologies referred to under the term NGS. The major division of these runs between second generation sequencing also denoted as massively parallel sequencing or short read sequencing, and third generation sequencing which denotes technologies facilitating long-read sequencing from single molecules.
Second generation sequencing
Second generation sequencing was introduced in 2005 [62]. For the first time, it was possible to sequence millions of short nucleic acid sequence fragments in parallel, leading to a massive increase of sequencing capabilities at once. As second generation sequencing can only produce comparably short reads, it is perfectly compatible with the idea of shotgun sequencing.
The first Solexa sequencers were for example limited to read lengths of <25 basepairs (bp). Different competitors pushed these boundaries, so that it is by now possible to sequence up to 400bp per read, generating as many as a trillion bases per run with error rates far below 1% [63]. Illumina, which acquired Solexa in 2007 [64] has become the market leader in the field of second generation sequencing [65].
Illumina dye sequencing technology
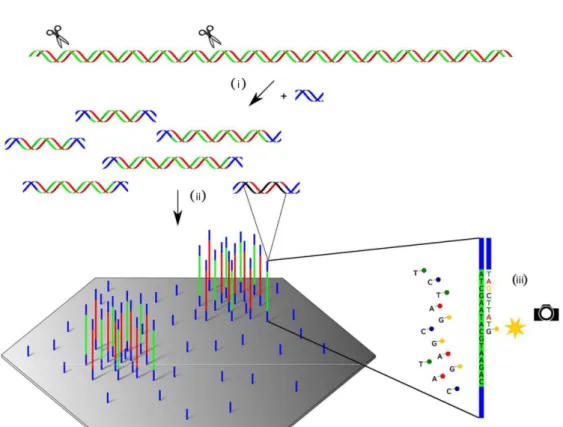
Large parts of our work are closely connected to the Illumina sequencing technology. Not only do we build up on Illumina sequencing data, but in some projects we interact with the sequencers directly while they are running. Therefore, I will give a short introduction on Illumina sequencing technology in the following paragraphs, which are structurally oriented at Illumina’s own descriptions [66, 67] and Canzar et al. [68]. Illumina’s sequencing workflow is subdivided into three basic steps, as shown in Figure 1: (i) Library Preparation, (ii) Cluster Generation and (iii) Sequencing itself [66, 68]. Every sequencing experiment starts with the purification of nucleic acids from a sample. DNA can be sequenced directly while RNA needs to be translated into cDNA first [69].
Introduction
11
Figure 1. Workflow of the Illumina sequencing process. (i) Library preparation: Fragmentation of nucleic acids and ligation of adapter sequences, (ii) cluster generation on the flow cell, and (iii) sequencing by synthesis itself. ©2015 IEEE. Adapted and reprinted with friendly permission from Stefan Canzar and Steven Salzberg.
In step (i), the purified DNA is then randomly sheared into shorter fragments either physically, e.g. by sonication, or enzymatically [70]. Adapters, sequencing primers and indices are ligated on both ends of these fragments. Indices denote short nucleotide sequences which can be used to distinguish different samples which are sequenced together. This process is called multiplexing, while the assignment of reads to their indices after sequencing is called demultiplexing. Methods combining fragmentation and adapter ligation are also called “tagmentation” methods. The target DNA is located between the adapters and also denoted as “insert”. The complete adapter-ligated fragments are amplified by PCR and get purified afterwards.
For the Cluster Generation step (ii), the prepared library is submitted to the sequencer. The chemical reaction underlying the sequencing process is conducted on a so called flow cell. A flow cell is a glass slide with a varying number of lanes, depending on the instrument and the sequencing mode. On the surface of the lanes, two types of short oligonucleotides are attached. Each of them is the complementary sequence of one of the adapters on the fragments. For hybridization, the first adapter is ligated to the first
Introduction
12
type of oligonucleotides. Then, a polymerase creates a complement of the hybridized template strand. The template strand is then washed away, leaving only the complementary strand. The second adapter region is then hybridized to the second type of oligonucleotides on the flow cell, forming a bridge, which is again turned into a double-stranded DNA by a polymerase. By repeating this so called bridge amplification step several times, large numbers of identical sequences and their complements are produced forming clusters on a flow cell. After the bridge amplification step, all complementary strands from the original template are washed off. All of this happens for all clusters simultaneously, resulting in one cluster of identical sequences for each of the billions of fragments.
The sequencing process itself (iii) begins with the binding of the first sequencing primer to the primer region of the template. A polymerase then synthesizes the complementary strand of the template, using fluorescently tagged nucleotides with a reversible terminator. This ensures that only one base is attached per cycle, which is always the complementary base of the corresponding base in the template. Then, the sequencing machine detects which base has been attached to a cluster in a given cycle by the fluorescent signal sent out by a complete cluster on excitation. Based on the measured signal of each cluster, the base call including a measure of base quality for a given cycle is calculated and saved. The first few bases of a template are used to identify the clusters on a flow cell, as their location is not predefined. Therefore, the signals sent out from a cluster in the early cycles must differ from those of a neighboring cluster to enable successful cluster distinction. Afterwards, the terminator is removed and the next cycle starts. After the first read has been sequenced, usually after 50-350 cycles, the product of the polymerase is removed. Then, the first index is sequenced in the same manner as the read before. After this product has been removed as well, the template is bound to the second type of oligonucleotides on the flow cell. Then, the second index is sequenced and the product is removed. A polymerase produces the complement of the bridged template and the original template is then removed, leaving only the complementary strands on the flow cell. For the last step of the procedure, the second read is sequenced in the same way as the first read at the beginning of the process. [66-68]
For single-end-read sequencing, protocols and other types of indexing, the procedure slightly differs.
Notably, the sequencing process is executed cycle-wise for all clusters at the same time, which is denoted as massively parallel sequencing. Billions of reads are therefore elongated by one base per cycle in parallel.
Introduction
13 Third generation sequencing
Third generation sequencing was first introduced by PacBio in 2011 and enables read lengths of >10 kilobasepairs (kbp). Oxford Nanopore, the second big player in the field of third generation sequencing, claims to achieve read lengths up to 950 kbp [71]. This advantage comes at cost of comparably low throughput rates of less than 10 billion bases per run, high per base costs and error rates up to 10%.
Since third generation sequencers do not parallelize sequencing in a way comparable to second generation sequencing, they are able to make the reads available in real-time during the sequencing procedure. Therefore, these techniques are also called real-time long-read sequencing approaches [65]. This feature allows starting analyses even before the sequencing run has finished. Especially Oxford Nanopore has been widely used for real-time analyses of reads [17, 18].
With HiLive [72] and PriLive [19], we were able to show that real-time analyses are also possible using second generation sequencing devices. This combines the advantages of second generation sequencers, namely low per-base costs, low error rates and high sequencing depths, with a smaller overall turnaround time of a real-time experiment.
Both types of NGS have advantages and are suitable for certain tasks. Since all questions in this work could be answered best using second generation sequencing data from Illumina sequencers, the term NGS will by now be used interchangeably with Illumina’s technology.
1.5
NGS data analysis
As shown above, NGS provides scientists with powerful tools to answer a variety of questions in different fields of research. In general, any sequence of nucleic acids can be sequenced. As each of the reads contains only very little information on its own, it is necessary to process NGS data with a variety of bioinformatics methods. I will describe some of the more basic methods relevant for my work in the following paragraphs 1.5.1 to 1.5.3. All the described algorithms have large impact on NGS-based pathogen related research.
Introduction
14
1.5.1 Read mapping
If a reference sequence is known, it can be used as a basis for a broad variety of analyses. Read mapping, as one of the most prominent ones, allows determining the exact genomic position a read stems from. This information obviously also implies what references the reads in a sample stem from.
While the read mapping problem as such has just grown relevant with the rise of NGS, it can be thought of as an abstraction of the sequence alignment problem. Due to sequencing errors as well as genuine differences between a read and a reference sequence, the alignment of two sequences is anything but a trivial problem. Alignment methods useful for sequencing data analysis need to account for mismatches, insertions and deletions. Needleman and Wunsch proposed the first precursor of most modern alignment algorithms in 1970 [73]. It is used to calculate the global alignment between two sequences, meaning that the optimal alignment of the full length of both sequences is computed. In 1981, Smith and Waterman adapted the Needleman-Wunsch algorithm for local alignments, such that similarities between smaller parts of larger sequences could be detected as well [74].
The first big step from pure alignment algorithms towards read mapping was taken by Wilbur and Lipman [75] and later implemented in the FASTA program suite [76] and subsequently in BLAST [77]. Both of these rely on the principle of pre-filtering candidate sequences which have high chances of allowing a valid alignment. As the filtering step is computationally much more efficient than the actual alignment, these methods enabled new fields of applications in times of rapidly growing reference databases. On the other hand, most of the tools are based on heuristics and do no longer guarantee to find all valid alignments. With the growth of datasets as well as reference databases, using BLAST as a read mapper is not feasible anymore as it is too time consuming.
Today, there is a huge variety of read mappers which rely on different algorithmic principles [78]. What all of them have in common is that they include only small parts of a given reference database for the actual read alignment. Large parts of the reference database are excluded via highly efficient sequence searches, leaving only little candidate positions for the search of a read’s origin via real alignments. I will shortly provide an introduction to read mapping at the example of HiLive [72], as it is the basis for some of my follow-up work. This illustration is based on Martin Lindner’s description in the supplementary material of [72].
Introduction
15
HiLive builds on a k-mer-based approach, where a k-mer is defined a subsequence of a read or a reference of length k. The reference database on which HiLive is built is a k-mer index: For every k-mer that occurs in the reference sequences, all positions of its occurrence are stored and can easily been looked up. For each read produced by the sequencer, candidate alignments are calculated in parallel. To account for better understandability, I will describe how these calculations are conducted for one read only. Whenever the sequencer provides a new base for the read, the alignments are calculated in the following steps: database lookup, seed extension, seed creation and seed filtering.
Database lookup
As soon as a read reaches a predefined length k, the last k bases of the read are considered the current k-mer. This k-mer is then searched in the k-mer index, returning a list of (genome ID, position)-pairs, denoted as matches. Negative positions denote reverse hits. All matches are then sorted by positions.
Seed extension
Existing seeds are being extended using the new matches. Whenever a new match lies in a window of w bases from an existing seed and shares the same genome ID, the new match is used to extend the existing seed. If more than one candidate database match exists, the one closest to the expected position is used for extension. Each database match may extend more than one seed.
Seed creation
All matches which cannot be used for seed extension are saved as new seeds, if there is a chance that they start an alignment that fulfills the user-specified criteria. In other words, after the completion of a certain cycle, no new seeds are created anymore. Seed filtering
As all alignments must be kept in memory for the whole time, it is necessary to keep the number of existing seeds as low as possible. HiLive provides users with different instruments to discard seeds: exact filters, which exclude only alignments that cannot reach a given threshold and optional heuristics, which bear the risk of rejecting valid alignments. [72]
Introduction
16
1.5.2 Read binning
One of the most fundamental steps in many metagenome workflows is read binning. This denotes grouping the reads into bins, which correlate to their operational taxonomic units (OTUs), which are defined as clusters of organisms with high sequence similarity.
Generally speaking, there are two kinds of binning tools: tools based on supervised [43, 46, 47, 79-85] and tools based on unsupervised [86-88] algorithms. Supervised methods rely on a predefined set of groups, to which the reads are assigned. In most cases, the sets are defined based on the taxonomic origin of sequences. E.g., a set of all sequences below a certain taxonomic rank may be grouped together and constitute one bin.
Supervised binning tools may either be based on alignments or make use of sequence characteristics such as GC-content, codon usage bias, k-mer frequencies and the like. In simple terms, certain sequence characteristics (including the nucleotide sequence itself for alignment-based methods) are measured in a set of reference sequences and assigned to predefined bins. In the next step, the reads are assigned to the bins based on the same characteristics.
Unsupervised methods are not provided with references but form bins without a priori
information. For example, abundanceBin bins reads based on their k-mer frequencies which it compares to the overall frequency of k-mer abundances in the complete dataset [87].
Unsupervised binning tools, but also some of the more sensitive alignment free supervised binning tools, may be of great help when working with sequences for which no close reference is known. Relying on vague sequence characteristics, it is sometimes possible to correctly assign reads which do not even have an alignable counterpart in a reference. This may either happen due to a massive amount of single nucleotide polymorphisms or in case of structural variations such as insertions or deletions. There are different underlying techniques used for read binning. Read mappers and other alignment-based methods can be very helpful for this purpose, as presented in MetaPhlAn2 [89], DiScRIBinATE [90], SPHINX [91], taxator-tk [92] and MEGAN [46]. Still, in some cases the use of a read mapper is not necessary or suitable in order to retrieve the desired information from an NGS dataset. The calculation of an actual alignment may take unnecessarily long. Especially calculating highly sensitive read alignments as performed by BLAST [77] is still computationally challenging. To circumvent this restriction, various methods based on different classification principles
Introduction
17
without the need for error-tolerant alignments have been proposed, which yield comparable or even better results in reasonable time frames.
Most of these methods rely on k-mer-based approaches [93-98]. I will shortly explain the principle of one k-mer-based classifier at the example of Kraken, as it was the first rapid metagenome classification tool and therefore serves as the reference tool for
k-mer based classification approaches [99].
As a basis for the read classification, Kraken builds a k-mer database using the Jellyfish
k-mer counter [100] with k being set to 31 bp as a default. For each occurring k-mer, the lowest common ancestor (LCA) of all sequences containing it is calculated. Here, this is defined as the lowest taxonomic clade under which all sequences containing the given
k-mer are joined.
All k-mers occurring in a given read are searched within the k-mer database. All paths from the root to an LCA taxon of a read are combined to a pruned subtree. The count of each appearing in a read is stored. Next, the sums of these counts of all possible root-to-leaf (RTL)-paths are calculated. The leaf of the highest scoring RTL-path is selected as the resulting classification. If more than one RTL-path reaches the maximum score, the read is assigned to the LCA of their leafs. If a read contains no
k-mer from the database it is left unclassified [94].
As Marchesi and Ravel [101] discussed, real metagenome classification is not to be confused with metataxonomics, a field of research relying on the amplification and sequencing of certain marker regions. The most wide spread example of metataxonomic methods is 16s RNA sequencing, which can be used for the study of microbial community composition analysis only [102, 103]. As there is an explicitly biased amplification step and large parts of most environments are excluded from sequencing, this is not a real metagenomic application. For example, there exists no universal marker region for viruses. Due to these limitations of metataxonomics, I will focus on true whole genome metagenome applications in this thesis.
Furthermore, we must distinguish between metagenome classification and abundance estimation methods. While metagenome classification means to assign each read to its taxon of origin, the latter aim at estimating the abundance of OTUs. For example, MetaPhlAn2 only uses a set of marker genes instead of a whole genome database, potentially leaving a large number of reads unassigned [89]. On the other hand, pure sequence classification tools do often not allow precise abundance estimation, as for groups with many rather similar subclades, reads may be stuck in higher taxonomic ranks [94]. Lu et al. have for this reason developed Bracken [104], a tool which enables precise abundance estimation based on the results of Kraken.
Introduction
18
1.5.3 De novo assembly
If a nucleic acid sequence stems from a yet unknown source or is expected to be distinct from known references, it may be necessary to reconstruct the sequence from scratch. Although this is often more complicated than the described reference-based methods, it can avoid introducing biases into the data analysis and may thus be performed even if a reference is available.
As short reads carry very little information themselves, it is necessary to assemble the reads to a longer sequence in order to gain deeper insights. If no a priori information from a reference sequence is used, we speak of a de novo assembly. In principle, all
de novo assemblers combine overlapping reads into contiguous sequences (contigs) using different strategies.
A first simplified theoretical concept of de novo assembly algorithms was published by Lander and Waterman in 1988 [105]. Algorithms based directly on this concept use so called greedy algorithms. An example of these is implemented in SSAKE [106]: All reads in a dataset are stored in a list of unclassified reads. Then, a first read is moved to a list of contigs and all unassembled reads are searched for overlaps of a given minimum length, which is reduced stepwise when no more overlaps of any read and the contig are found. These algorithms are comparably inefficient and prone to sequencing errors. Moreover, repetitive regions cannot be resolved using this concept.
The next bigger innovation was introduced through Overlap-Layout-Consensus (OLC)-based algorithms. These are also based on the idea of identifying overlaps between reads, but overlapping reads are not unconditionally accepted as contigs. Instead, an overlap graph is built, where every read is considered a node. Whenever two reads can be aligned and therefore overlap, their nodes are linked by an edge in the graph. In this overlap graph, a Hamilton path – a path visiting all nodes of a connected graph exactly once – is searched. This reduces the graph to a smaller number of nodes, where every node represents one contig. Finally, the consensus sequence of all reads constituting a contig is calculated.
Software based on this concept was for the first time able to assemble large genomes [107]. Still, it has the disadvantage to be computationally expensive, both concerning memory and computational power, as every read is a node in a graph and calculating Hamilton graphs is an NP-hard problem.
Most modern assembly algorithms such as SPAdes [108], EULER [109], Velvet [110]. ALLPATHS [111, 112] or SOAPdenovo2 [113] are therefore based on de Bruijn graphs. In contrast to the methods described previously, de Bruijn graph-based assemblers
Introduction
19
work without calculating an error-tolerant alignment between reads. Instead, reads are dissected into overlapping k-mers. These k-mers are used to build a de Bruijn graph. In contrast to the graphs from OLC-based algorithms, sequences do not represent nodes but edges in the graph. This switch allows searching for an Euler path instead of a Hamilton path. In an Euler path, not every node but every edge is visited exactly once. For the Eulerian path problem, algorithms which need only quadratic runtime are known. Furthermore, the size of the graph does not depend on the number of reads, as duplicate sequences are merged into one edge. As most de novo assemblies are based on a large number of short reads, de Bruijn-based algorithms can solve this problem far more efficiently than alignment-based methods. Since sequencing fewer but longer reads becomes more influential again, it is quite possible that OLC assemblers will as well experience a revival [114, 115].
All aforementioned assemblers are intended to be used on sequencing data from single organisms. Yet, they may of course be used on metagenomic datasets after the reads have been binned. These groups may then yield good assembly results when treated like sequencing data from isolated source organisms. Still, binning tools may falsely assign reads, or, more often and worse, leave reads unassigned which are then lacking in the assembly.
To circumvent preceding binning and its negative side effects such as the risk of misclassified reads, efforts have also been made in the field of direct metagenome assemblers [116-123]. The assemblers described previously often face difficulties when run on metagenomic data. These may have several causes including different abundance levels of different species, shared conserved regions between different organisms and mixtures of strains, combining both mixed abundances and highly similar genomes [116]. This may lead to falsely connected contigs or unnecessarily short contigs. Metagenome assemblers are designed to solve these challenges. They often rely on splitting de Bruijn graphs into smaller subgraphs based on features like coverage or graph connectivity [117, 118]. Therefore, they can assemble metagenomic data directly.
Most NGS-based metagenomic research questions can be answered by one or a combination of the aforementioned methods. The choice of methods does of course depend on the exact question, the type of the sample, the availability of reference sequences and more.
Introduction
20
1.6
Terminology and abbreviations
auc Area under the curve
bam Binary sequence alignment/map
BerSQPV Berlin squirrelpox virus
bp Basepairs
BSL Biosafety level
contig Contiguous sequence
DNA Deoxyribonucleic acid
ds-cDNA Double-stranded cDNA
EM Electron microscopy
ERV Endogenous retrovirus
FTP File Transfer Protocol
gbp Gigabasepairs
GC guanine-cytosine
HERV Human endogenous retrovirus
kbp Kilobasepairs
LCA Lowest common ancestor
NCBI National Center for Biotechnology Information
NGS Next generation sequencing
OLC Overlap-Layout-Consensus
OPV Orthopoxvirus
OTU Operational taxonomic unit
PCR Polymerase chain reaction
PPV Parapoxvirus
RAMBO-K Read Assignment Method Based On K-mers
RNA Ribonucleic acid
ROC Receiver operating characteristic
RTL Root to leaf
sam Sequence alignment/map
SQPV Squirrelpox virus
Introduction
21
1.7
Thesis outline
In this thesis, I will approach the problem of rapid and sensitive diagnostics for known and unknown pathogens based on NGS from different angles. In the following chapters 2, 3, 4 and 5, I show our contributions to the field of research. Each of them tackles different research gaps and thereby enables new applications or provides new insights. The chapters are arranged in the order in which the described applications could be used on a metagenomic NGS dataset if very little information is available beforehand. I will finish with a chapter which shows the application of some of my introduced work as well as several other bioinformatic analyses in a real setting.
In Chapter 2, I describe LiveKraken, a tool that enables the use of Kraken’s core algorithm [94] on Illumina sequencing data in real-time. LiveKraken enables accurate classification of reads even up to days before the sequencer has finished. This very general approach facilitates getting a first insight into a dataset without investing extra time, making it suitable as a standard application for any sequencing project. I conceptualized the real-time reporting feature, the visualization and the user interface of LiveKraken, designed and performed the benchmarks and wrote the manuscript for this project. The tool was developed by Benjamin Strauch, who implemented the new data handling into Kraken’s source code. Andreas Andrusch helped with the implementation of the visualization. Andreas Nitsche assisted writing the manuscript. Tobias Loka gave substantial input on the concept and helped writing the manuscript. Benjamin Strauch, Martin Lindner, and Bernhard Renard had the initial idea LiveKraken is based on. The project was performed under the guidance of Martin Lindner and Bernhard Renard. LiveKraken has been published at the journal Oxford Bioinformatics:
Simon H. Tausch1, Benjamin Strauch1, Andreas Andrusch, Tobias P. Loka, Martin S.
Lindner, Andreas Nitsche, Bernhard Y. Renard. LiveKraken – Real-time metagenomic classification of Illumina data. Bioinformatics, 2018. [124]
Chapter 3 addresses a more profound and exhaustive approach of a real-time application on Illumina data, which is tailored to accurate pathogen diagnostics. The described software tackles not only the problem of long turnaround times of NGS-based
Introduction
22
diagnostics using the enhanced core algorithm of HiLive [72], but also implements a new approach of contamination and background masking and visualizes the results in an intuitive way. This allows getting actionable results in minimal time. I conceptualized the workflow, implemented the visualization and the result evaluation including the pathogenicity rating, designed the scoring method and invented the novel background masking method. Tobias Loka, Jakob Schulze and Kristina Kirsten helped enhancing HiLive to enable real-time output, gapped k-mer functionality and implemented many more necessary features. Jeanette Klenner produced the dataset used for benchmarking. Andreas Nitsche gave virological insights and supervised the generation of the benchmarking datasets. Wojtek Dabrowski, Martin Lindner and Andreas Andrusch gave substantial input on general questions regarding algorithmics, parametrization, visualization, and scoring methods. Bernhard Renard led the project.
Simon H. Tausch, Tobias P. Loka, Jakob M. Schulze, Andreas Andrusch, Kristina Kirsten, Jeanette Klenner, Piotr Wojciech Dabrowski, Martin S. Lindner, Andreas Nitsche, Bernhard Y. Renard. PathoLive – Real-time pathogen identification from metagenomic Illumina datasets. (Manuscript under final internal revision before submission)
Chapter 4 describes an efficient alignment-free read classifier. Especially when sequencing viruses, analyses are hampered by large proportions of background reads from the host cells. When no reference with appropriate similarity for a meaningful alignment exists, as it is common for viruses, a sensitive selection of relevant reads is difficult. RAMBO-K assigns reads to fore- and background using a Markov Chain-based classifier, yielding more precise classifications than its competitors in minimal time. I designed and implemented the Markov Chain-based scoring model in, the visualization, the read simulation and the user interface in Python and also designed and performed the benchmarks. Furthermore, I helped with writing the manuscript. Wojtek Dabrowski helped with the conceptualization and reimplemented the read scoring method and Markov Chain trainer in Java in a more efficient manner. Moreover, he guided the project and wrote the manuscript. His contributions have also been described in his doctoral thesis [115]. Bernhard Renard and Andreas Nitsche helped writing the manuscript and co-designed the idea of the tool. I have discussed the basic concept and implementation of RAMBO-K in my Master’s thesis [125]. Beyond that, I guided the development of a Geneious [126] plugin for the tool, which is work in progress, with help of Wojtek Dabrowski, René Kmiecinski and Alona Tyshaieva. I also conceptualized
Introduction
23
the idea for a high-level-binning based on RAMBO-K to classify reads as viral, bacterial or eukaryotic. This has been implemented by Sophie-Meier zu Ummeln but yielded no significant results.
RAMBO-K has been published in PlosOne:
Simon H. Tausch, Bernhard Y. Renard, Andreas Nitsche, Piotr Wojciech Dabrowski.
RAMBO-K: Rapid and Sensitive Removal of Background Sequences from Next Generation Sequencing Data. PLoS One, 2015. 10(9): p. e0137896. [85]
An example use case of RAMBO-K and a number of general bioinformatics analyses are shown in Chapter 5. There, the discovery of a novel squirrelpox virus which is believed to establish a whole new genus of poxvirinae is presented. Studying the dataset using the established default mapping tools, no viable results could be found. Only after I assigned the viral reads using RAMBO-K, I was able to assemble the genome. I also assembled and aligned resequenced samples from other specimens, helped with genomic analyses and wrote parts of the manuscript. Gudrun Wibbelt wrote major parts of the manuscript and conducted the electron microscopy as well as the histology. Olivia Kershaw provided the samples to RKI. Wojtek Dabrowski performed the phylogenetic analysis. Andreas Nitsche designed the PCRs and gave valuable input to all parts of the complete project. Livia Schrick guided the project. All authors contributed in writing the manuscript. This chapter has been published in the Journal Emerging Infectious Diseases:
Gudrun Wibbelt1, Simon H. Tausch1, Piotr Wojciech Dabrowski, Olivia Kershaw, Andreas Nitsche, Livia Schrick. Berlin Squirrelpox Virus, a New Poxvirus in Red Squirrels, Berlin, Germany.Emerg Infect Dis, 2017. 23(10): p. 1726-1729. [127]
Further contributions
Besides these first author contributions which are presented in detail in this thesis, I also contributed methodology I developed and data analysis based on it in the following journal publications:
Introduction
24
Andreas Andrusch, Piotr W. Dabrowski, Jeanette Klenner, Simon H. Tausch, Claudia Kohl, Abdalla A. Osman, Bernhard Y. Renard, Andreas Nitsche. PAIPline: Pathogen identification in metagenomic and clinical next generation sequencing samples. Bioinformatics, 2018 (in press)
With PAIPline, we present a pathogen identification pipeline, enabling the alignment based taxonomic classification of metagenomic reads with a focus on clinical samples. I gave input on the conceptualization of the workflow and parametrization of the modules. Furthermore, I conducted extensive testing and proof-read the manuscript.
Tobias P. Loka, Simon H. Tausch, Piotr Wojciech Dabrowski, Aleksander Radonic, Andreas Nitsche, Bernhard Y. Renard. PriLive: Privacy-preserving real-time filtering for Next Generation Sequencing.Bioinformatics, 2018. [19]
In this project, we present a real-time filtering tool for Illumina sequencing data which removes host reads while they are being produced and at the same time minimize the risk of deleting relevant data. I gave input on the algorithmics of HiLive and especially on the adaption of the algorithm to real wet lab settings. I furthermore tested Tobias Loka’s developments and proof-read the manuscript.
Livia Schrick, Simon H. Tausch, Piotr Wojciech Dabrowski, Clarissa R. Damaso, José Esparza, Andreas Nitsche. An Early American Smallpox Vaccine Based on Horsepox. New England Journal of Medicine, 2017. 377(15): p. 1491-1492. [128]
This letter in the New England Journal of Medicine is based on the sequencing of an ancient smallpox vaccine capillary from 1902. We were able to show that this vaccine was probably derived from horsepox instead of cowpox, gaining new insights to the
mystery surrounding the history of smallpox vaccines. I analyzed the data from the
highly fragmented genomic material using Trimmomatic [129], RAMBO-K [85] and SPAdes [108], which resulted in the complete genome of the ancient vaccine after manual correction. I furthermore calculated alignments using MAFFT [130] to related vaccinia, cowpox and horsepox genomes, finding major vaccinia-typical deletions in the ends of the ancient vaccine genome. Based on these, I designed figure 1B of the paper. I also wrote parts of the manuscript.
Introduction
25
Martin S. Lindner, Benjamin Strauch, Jakob M. Schulze, Simon H. Tausch, Piotr Wojciech Dabrowski, Andreas Nitsche, Bernhard Y. Renard. HiLive: real-time
mapping of illumina reads while sequencing. Bioinformatics, 2017. 33(6): p. 917-319. [72]
HiLive is the first real-time read mapper for Illumina data giving results by the end of a sequencing run. After extensive testing, I conceptualized several enhancements of HiLive, making it easier applicable to real world settings. My most relevant contributions were made on user interface design and efficient and understandable output including demultiplexing and the handling of paired-end reads.
Tobias P. Loka, Simon H. Tausch, Bernhard Y. Renard. Reliable variant calling during runtime of Illumina sequencing. (under review)
This paper introduces HiLive2, a follow-up version of HiLive with a novel underlying alignment method, and combines it with xAtlas to enable SNP-calling while the sequencer is still running. I continuously supported the development of HiLive2 in technical as well as algorithmic questions and evaluated the performance of HiLive2 on different types of data.
Cesare E. M. Gruber, Emanuela Giombini, Marina Selleri, Simon H. Tausch, Andreas Andrusch, Alona Tyshaieva, Giusy Cardeti, Raniero Lorenzetti, Giuseppe Manna, Fabrizio Carletti, Andreas Nitsche, Maria R. Capobianchi, Gian Luca Autorino, Concetta Castilletti. Whole genome characterization of OPV Abatino, a zoonotic virus representing a putative novel clade of Old World Orthopoxviruses. (Manuscript under final internal revision before submission)
In this project, we assembled and characterized the genome of a novel poxvirus from Macaques, revealing hints towards genomic recombination. I helped assembling and annotating the genome with the aid of RAMBO-K and a self-developed assembly pipeline. Furthermore, I designed and implemented data analyses measuring the similarity of open reading frames to genes of different related species and drew figures visualizing these results.
Introduction
26
Simon H. Tausch, Andreas Andrusch, José Esparza, Andreas Nitsche1, Clarissa R.
Damaso1. Genome analysis of the Mulford 1902 smallpox vaccine. (Manuscript under
final internal revision before submission)
In this project, we further characterize the genome of the ancient smallpox vaccine from [128]. This includes genome annotation, phylogenetic and metagenomic analyses as well as detailed investigations on gene level. I designed and implemented data analyses measuring the similarity of open reading frames to genes of different related species and drew figures visualizing these results. Moreover, I co-performed the metagenomic and gene level analyses and helped writing the manuscript.
Real-time metagenomic classification using LiveKraken
27
2
Real-time metagenomic classification using LiveKraken
In metagenomics, Kraken is one of the most widely used tools due to its robustness and speed. Yet, the overall turnaround time of metagenomic analysis is hampered by the sequential paradigm of wet and dry lab. In urgent experiments, it can be crucial to gain a timely insight into a dataset.
Here, we present LiveKraken, a real-time read classification tool based on the core algorithm of Kraken. LiveKraken uses streams of raw data from Illumina sequencers to classify reads taxonomically. This way, we are able to produce results identical to those of Kraken the moment the sequencer finishes. We are furthermore able to provide comparable results in early stages of a sequencing run, allowing saving up to a week of sequencing time on an Illumina HiSeq in High Output Mode. While the number of classified reads grows over time, false classifications appear in negligible numbers and proportions of identified taxa are only affected to a minor extent.
LiveKraken is available at https://gitlab.com/rki_bioinformatics/LiveKraken.
2.1
Introduction
Real-time analyses of genome sequencing data have been gaining particular attention over the last years, as they enable to analyze data while the sequencer is still running. Yet, the possibilities of live analysis approaches based on MinION sequencers are still limited due to low throughput rates and sequence qualities of these devices. With HiLive [72] we proposed the first method for real-time analyses of high-throughput sequencing data from Illumina machines, enabling a new field of applications. For metagenomic studies, classification tools such as Kraken [94] have also been used in time-relevant applications. These are, however, affected by the sequential paradigm of wet and dry lab, setting the lower limit of the overall duration of an experiment to the runtime of the sequencing machine. To tackle these limitations, we present LiveKraken, a real-time taxonomic classification tool based on the core algorithm of Kraken. We show that it yields results comparable to those of established tools long before the sequencer has even finished and that it guarantees results identical to those of Kraken as soon as a sequencing run has ended. LiveKraken has been tested on HiSeq and MiSeq systems and is as robust and easy to use as Kraken. The field of applications may range from controlling sample composition, contamination identification, or outbreak detection in real-time.
Real-time metagenomic classification using LiveKraken
28
2.2
Materials and methods
Originally, Kraken has a linear workflow [94]. Sequencing reads are read from FASTA or FASTQ files and subsequently classified using a precomputed database. Since the reads are independent of each other, they can be processed in parallel. The LCA classification results found for each read are written to Kraken’s tabular report file. To make this workflow fit for the purpose of live taxonomic classification, similar to the approach taken in HiLive [72], a new sequence reader module was implemented which allows reading sequencing data from Illumina’s binary BCL format. LiveKraken can be used to analyze continuously and refine the metagenomic sample composition, using the same database structure as the original Kraken.
Illumina sequencers process all reads in parallel in so called cycles, appending one base to all reads per cycle. For each cycle, basecall (BCL) files are produced in Illumina’s BaseCalls directory, which is declared as input for LiveKraken instead of FASTA or FASTQ files. New data is collected by the BCL sequencing reader module in user-specified intervals of j sequencing cycles, starting with the first k-mer of size k. The collected data is sent to the classifier which refines the stored partial classification with the new sequence information. Temporary data structures of Kraken are stored for each read, such as the LCA list, a list of ambiguous nucleotides, and the number of k-mer
occurrences in the database. This leads to an overall increase of memory consumption proportional to the number of LCAs found for each read sequence. Additionally, and crucial for the iterative refinement, a variable is stored that is holding the position up to which each read was classified. After each refinement step, output in the same tabular format as known from Kraken is produced. This enables early classification while also ensuring that the classification output after reading the data from the last sequencing cycle is exactly the same that Kraken would produce (cf. Figure 2a).
LiveKraken can be installed via the included script install_kraken.sh analogous to Kraken with an additional dependency to the boost library. It has been tested with gcc v. 4.9.2 and v. 7.2.0 and boost v. 1.5.8. Furthermore, a Conda package is available [131]. LiveKraken uses the same command line interface as Kraken.
Rea
l-t
ime
m
et
a
g
en
o
m
ic
c
la
ss
if
ic
a
tio
n
u
si
n
g
L
iv
eKra
ken
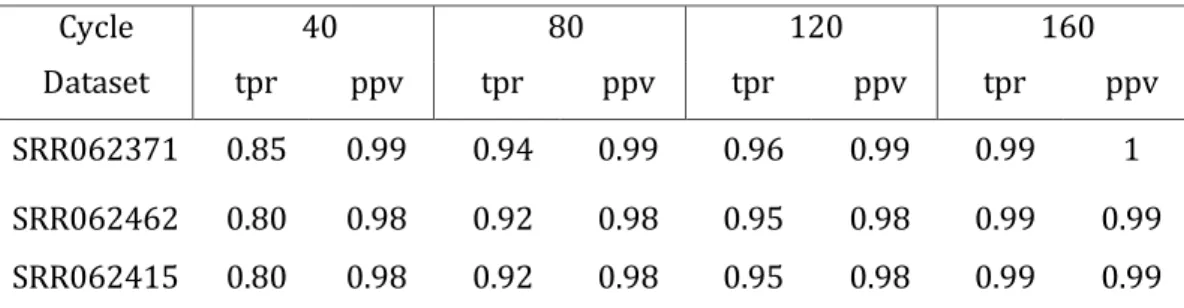
29Figure 2 Timeline of LiveKraken: Upper part (a) showing the method, lower part (b) an exemplary result. (a) Method: Raw parts of sequenced reads are streamed directly from the sequencer into Kraken’s classification algorithm. K-mers are taxonomically classified using Kraken’s precomputed map of each k-mer to the lowest common ancestor of all genomes containing the k-mer, as color coded in the taxonomy tree. The highest scoring path from the pruned subtree of the taxonomic tree is selected as classification of each read [88].(b) Results: In this example (SRR062462), results are reported after 40, 80, 120, 160, and 200 sequencing cycles or approximately 12, 9, 6, 3, and 0 hours on an Illumina MiSeq before the sequencer finishes and data can be prepared for other tools to start. The results are visualized in a Sankey diagram of read classifications on species level after all cycles are reported. The top five groups with the most hits are shown, while groups with fewer hits are conflated as “other”. Reads which cannot be assigned on species level are denoted as unclassified. The unclassified nodes are optically narrowed by approximately 1,500,000 reads each for better recognition of relevant groups. Thickness of the flows encodes the number of reads going from one node to another, where blue flows represent unchanged or new classifications and red ones show changed classifications. While the number of unclassified reads decreases, the overall proportions of taxa stay the same. Misclassifications occur in negligible magnitude. The visualization of results as an interactive Sankey-plot is part of LiveKraken., put color to white