Acknowledgements
I would sincerely like to thank my thesis advisor, Professor Neville Francis, for his patience,
guidance, and persistent enthusiasm for this project. He has tirelessly pushed me to pursue
and crystallize the merits of this research, and for that I am eternally grateful.
I would like to thank my faculty advisor, Professor Hendricks, and my peers in the economics
thesis program who served as valuable mentors and provided a shared sense of progress as we
worked on our individual projects.
I am grateful to Professor Jaime Arguello and Professor Stephanie Haas of the UNC School
of Information Sciences for serving as my teachers within the field of natural language
pro-cessing. Our conversations have been so enjoyable and your expertise has been invaluable.
I would like to extend my deepest appreciation to Dr. Michael T. Kiley, whose interest in
understanding the evolution of FOMC conversations by means of computational linguistics
inspired this thesis.
Lastly, this thesis could not have been possible without the love and support of my family.
They never fail to show me that with hard work and patience, I can always do more than I
1
Introduction and Motivation
Central bank transparency is continuously called into question within monetary policy.
Ana-lyzing the degree of openness in the communication of monetary policy is required to enable
accountability and to safeguard the democratic legitimacy of independent central banks
(Ger-aats 2002). However, issues of communication issues have become the subject comes up fairly
frequently in FOMC meetings and speeches by FOMC members (Poole 2005). It is hardly
surprising that central bankers are more talkative than they were just a decade or so agoand
more concerned about how to improve transparency and communication with the market
(Poole 2005). Although important, transparency is hard to achieve because
miscommuni-cation is so easy. Clearly, more talk does not necessarily mean greater transparency (Poole
2005).
The Federal Reserves actions to promote itself as a transparent system has evolved over time,
and several institutional changes have been put in place to encourage a greater quantity and
more timely release of the once-private and sanctimonious dialogue of the FOMC.
Notewor-thy to this research are the transcripts and statements of the FOMC meetings. These
state-ments are the publics main source for US economic policy decisions and content of FOMC
meetings, and are the agent to understanding the nature of the deliberations that
under-lie monetary policy decisions. We operate under the premise that the immediately-released
and carefully crafted statements summarize the transcripts, the dialogue spoken within the
closed-door FOMC meetings. With this premise, we define central bank transparency in the
same way the Federal Reserve does, which is three fold: (i) transparency about the objectives
of monetary policy, (ii) transparency about current monetary policy actions, and (iii)
trans-parency about expected future monetary policy actions.(Poole 2001)
However, transparency means nothing unless this communication can be conveyed, seen, and
digested by households. The best outlet for attempting to interpret public understanding of
FOMC decisions is to go straight to the news that reports on such. Within news articles that
the e↵ects of their actions are, at times, faced with intense scrutiny. Given the importance
of the topics contained in these documents, it is not surprising that, over the years, both the
public and the FOMC itself have favored greater transparency.(Acosta 2014)
There are two main goals of this paper. The first goal for this paper is to create a
quantifi-able measure for transparency that captures public interpretation of FOMC policy decisions.
We focus on the extent to which the FOMC conveys itself and its policy decisions with their
official statements, which are released immediately after each meeting, to the public at large.
To do this, we create an index that attempts to isolate the communicative success between
the FOMC and the public in a twofold process that involves a trio of documents.
First, we need to account for how the Federal Reserves practice of transparency has evolved
over time. Namely, we need to be sensitive toward (i) the Fed’s institutional changes in its
release of materials and (ii) the di↵ering lag times at which these materials were released. To
do this, we first establish transparency by computing the similarity values between discourse
within the transcripts and reporting in the statements (previously the Record of Policy
Ac-tions) are high. This step is necessary as it not only establishes the Fed’s definition of central
bank transparency, but it also acts as a proof of concept in preparation for our second step.
Next, we compute the similarity between the statements and the news articles that report on
the statements. If we want to provide meaning to this definition of transparency,
understand-ing public interpretation of Fed policy is necessary.
To establish our transparency index, I use a methodological procedure called Latent
Dirich-let Allocation (LDA) (Blei, Ng, and Jordan 2003). LDA is a particularly attractive model to
use for this research, as it has the ability to consistently estimate topics that appear
natu-rally, without requiring any pre-assigned labels. In a more technical sense, LDA is an
unsu-pervised learning algorithm, meaning that since it produces no meaningful topic labels, any
attribution of meaning to topics requires a subjective judgment on the part of the researcher.
Thus, I can measure transparency by first scraping for any number of topics, both within
the FOMC statements and within the respective news reporting of the particular FOMC
modeling technique called cosine similarity. I create a transparency index series from 1984
to 2012 using this technique, and the idea is that a higher similarity number indicates that
the FOMC is more transparent in their communication. My second goal is to understand if
transparency a↵ects the way monetary policy is propagated.
The paper proceeds as follows. Section 2 reviews the related literature. Section 3 provides
motivation for our research. Section 4 then describes how we construct the transparency
in-dex with use of computational linguistic techniques. Section 5 establishes the exogeneity of
our index. Section 6 presents the conditional applications on which we embed our estimation.
2
Previous Studies and Theory
As addressed by Schonhardit-Bailey in their comprehensive handbook, Text Mining for
Cen-tral Banks, text mining may be worth the attention of cenCen-tral banks. Text mining techniques
make tractable a range of data sources which matter for assessing monetary and financial
stability and cannot be quantitatively analyzed by other means.(Schonhardit-Bailey 2015)
Key text data for central banks include news articles, financial contracts, social media,
su-pervisory and market intelligence, and written reports of various kinds. With computational
linguistic techniques such as these, we can analyze any collection of documents.
The use of textual analysis to measure economic variables is rapidly growing in practice. A
number of papers use variables generated from publicly released FOMC documents to study
FOMC communication, including Boukus and Rosenberg (2006), Ehrmann and Fratzscher
(2007), Meade and Stasavage (2008), Schonhardt-Bailey (2013), Acosta and Meade (2014),
Acosta (2015), and Husted et. al (2015). For example, Schonhardt-Bailey (2008, 2013) use
text analysis to examine FOMC transcripts. Utilizing a computational package called
Al-ceste, they emphasize the arguments and persuasive strategies adopted by policymakers
dur-ing three di↵erent periods: 1979-1981, 1991-1993, and 1997-1999.
Text mining can also be utilized as a means of constructing indices of economic variables.
This practice has started to become popular in the literature. For example, Husted et. al
(2015) constructs a news-based monetary policy uncertainty index to capture the degree
of uncertainty that the public perceives about central bank policy actions and their
conse-quences. The news-based search has been recently adopted to construct new measures for
a broad economic policy index (Baker, Bloom, and Davis (2015). Husted et. al (2015)
sug-gests that newspaper searches can deliver useful proxies of uncertainty tracing back decades.
They claim that this allows measures to be constructed for earlier periods and/or in countries
where economic and financial data is less available than in the United States.
Additionally, vector space modelling, a classic mode in the text mining area, represents
similar-ity among the documents. These techniques, such as the one presented here, have been
ap-plied extensively in constructing indices of economic variables. Indices created to measure
central bank transparency have the advantage of providing a simple, quantitative summary
of this multifaceted concept, although they inevitably reflect subject choices and omissions
(Geraats 2002). A central bank relevant application of a vector-space modeling technique,
called Latent Semantic Analysis (LSA), is a paper by Acosta (2014), who studies the e↵ect
of greater transparency on US Federal Reserve Open Market Committee (FOMC) meetings.
Acosta finds increased conformity after the publication of transcripts when he applies
sin-gular value decomposition components to measure document similarity. That is, LSA
calcu-lates the linear combinations of terms that explain most of the variance of terms across
doc-uments, and vice versa. The hypothesis is that the principal components of said document
represent shared topics, and the discarded components represent arbitrary words choices.
However, one weakness of LSA is that the topics it produces are not probabilistic. Latent
Dirichlet Allocation (LDA) rectifies this. LDA is a mixed-membership model in which words
and documents are assigned probabilities and related to multiple topics. This contrasts with
deterministic single-membership models in which words and documents are assigned only
to one topic. Hansen, McMahon, and Prat (2014, 2017) introduce LDA to the existing
cen-tral bank literature, and attempt to measure the e↵ect of increased transparency on debate
within FOMC transcripts and minutes. Their approach to measuring transparency is based
on basic text counts and on topic models, a class of machine learning algorithms for natural
language processing that estimates what fraction of time each speaker in each section of each
meeting spends on a variety of topics.
We also take advantage of the LDA algorithm, such as in Hansen, McMahon, and Prat (2014,
2017) and follow a similar approach, but highlight some important advantages of ours. We
use a greater number of materials in an attempt to construct a more comprehensive
mea-sure of transparency, analyzing not only FOMC transcripts and statements, but also public
news reporting covering each released FOMC statement over a nearly 30-year period of time.
We also compute the similarity between topics within our trio of documents using multiple
Ul-timately, the key application behind our transparency index is to see what e↵ect it has on
monetary policy. Hansen et al (2014) and a few others attempt to apply their central bank
transparency measure to explore e↵ects of transparency on the macroeconomy. However, this
paper is the first in the surrounding literature to apply a transparency index incorporating
3
Defining Transparency
3.1
History of Federal Reserve Transparency
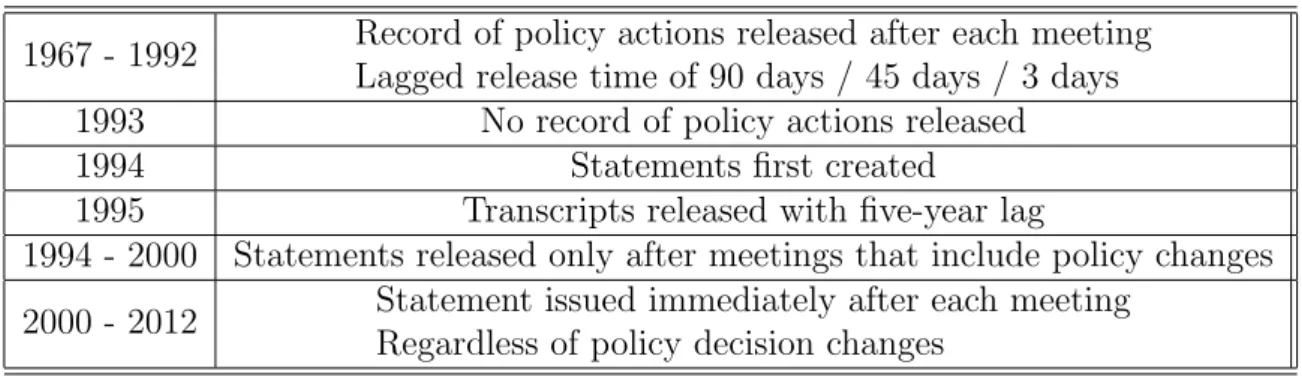
Table 1: Materials Released by the FOMC: Timeline of Communication
1967 - 1992 Record of policy actions released after each meeting Lagged release time of 90 days / 45 days / 3 days
1993 No record of policy actions released
1994 Statements first created
1995 Transcripts released with five-year lag
1994 - 2000 Statements released only after meetings that include policy changes
2000 - 2012 Statement issued immediately after each meeting Regardless of policy decision changes
The public dissemination of the Federal Reserves communication materials has evolved over
time, and with it, the Feds practice of transparency. Originally, the materials of the FOMC
meetings were not made public, but in response to passage of the Freedom of Information
Act, which became e↵ective in 1967. As outlined by the timeline in Table 1, the FOMC
be-gan releasing the Record of Policy Actions, a document that provided background,
reason-ing, and a summary of each policy decision made. While also serving six decades as official
statements of FOMC policymaking, these records started with a few paragraphs of
back-ground and reasoning behind each action but eventually grew, reaching an average of about
five pages per meeting in the mid-1960s and over 15 pages by the 1990s. Improvements in
timeliness and efficiency were evident as the release schedule from 1967 was reduced from 90
days after the meeting to 45 days in 1975, and then to 30 days in 1976. However when the
frequency of meetings were changed from monthly meetings to eight meetings per year, the
post-subsequent-meeting schedule increased the publication lag.
In response to congressional pressure, the FOMC agreed in February 1995 to release, with a
lag of five years, verbatim transcripts created from the tapes of FOMC meetings and to
publically available of all FOMC meetings from 1979 through 2012. The Federal Reserve is
the only existing central bank that provides such complete and explicit records of its policy
deliberations.(Poole 2005)
Another important step toward more predictable policy was for the FOMC to confine
pol-icy decision making to the eight regularly scheduled meetings per year.(Poole 2005) The first
official FOMC statement release occurred after the February 1994 meeting under Chairman
Alan Greenspan, and occurred from then on at the conclusion of every meeting at which a
policy action was initiated. It was celebrated in February 1995 that chances in the stance
of monetary policy would be shared with the public. In January 2000, the Committee
an-nounced that it would issue a statement following each regularly scheduled meeting,
regard-less of whether there had been a change in monetary policy.
Now equipped with a better understanding of the evolution of FOMC transparency and the
history of its communication materials, we can now define transparency more rigorously.
I consider baseline transparency to be the measure of similarity between FOMC
commu-nication materials: statements and transcripts. We lead with a hypothesis that given the
FOMC’s definition of the statements to be a summary of the dialogue spoken in the FOMC
meetings. For proof of concept, we compute the similarity of the statements and the
tran-scripts by means of textual analysis, and find the two documents to be highly correlated.
3.2
Linking to the News
It is natural to ask why central banks need to be transparent. One answer is that central
banks are governmental agencies and as such are accountable to the public for their actions.
For years, Federal Reserve officials argued that immediate release of policy decisions would
make markets more unstable and policy implementation more costly and difficult; creating
these e↵ects through disclosure would obviously be inconsistent with the Feds public
respon-sibilities. Views on whether immediate release of policy decisions would damage monetary
policy have changed. Thus, the premise of our paper is this: without consideration for public
Transparency means nothing unless this communication can be conveyed, seen, and digested
by households. The best outlet for attempting to interpret public understanding of FOMC
decisions is to go straight to the news that reports on such. Within news articles that report
on the eight FOMC meetings per year, the intentions of monetary policymakers and the
ef-fects of their actions are, at times, faced with intense scrutiny. 1
This index makes its best attempt to capture how well the public understands conveyed
top-ics by the FOMC, but it is important we not throw too much caution into the wind. As
con-spicuous as it may sound, the Federal Reserve can either be considered transparent or not
transparent. In the times when the Fed is transparent and their actions are the focal point
of reporting in the news, our index will compute a high value. However, there are and will
always be periods of time when the news circulating FOMC meetings will be clouded with
current events considered more pressing. For example, pressing events, such as a natural
dis-aster or election might disrupt the current news of the day and take up the space
tradition-ally allocated for the FOMC meeting reporting. As a result, there will be instances when
the FOMC is as open as it can be in the communication policy decisions, but the news will
report minimally on Fed actions. If the Fed is not forefront in the minds of the public, in
other words if the news does not pay much attention to the results from the FOMC meeting,
the Fed will appear less transparent within the confines of our index and will compute a low
value. This being said, we make creative and rigorous attempts to account for the sensitivity
of FOMC-related news reporting, outlined in section 4.2.
4
Measuring Transparency with LDA
4.1
Preparing the Dataset
A major challenge for the analysis is to convert the raw text in the transcript files into
mean-ingful quantities for the dependent variables in the regressions. Thus, a key aspect of text
mining is to reduce the dimensionality of bag-of-word representations to eliminate noise and
hone in on documents distinctive content. There are a number of techniques available to deal
with words that are superfluous to the content of the corpus (Schonhardt-Bailey). In order
to achieve this, we clean each of the text documents before conducting the LDA analysis by
tokenizing each statement, removing all non-alphabetic terms, removing all stop words, and
stemming all remaining words to their linguistic root. A detailed guide to this process can be
found in Appendix E.
Within news sources, I search for articles containing variations on key variable terms,
partic-ularly ”Federal Reserve” or ”the Fed” or ”Federal Open Market Committee” or ”FOMC”.(Husted
et al 2015) My search is then narrowed down to only include articles containing the phrases:
Federal Reserve, The Fed, or monetary policy within a 20-word maximum zone. Husted et al.
(2016) takes a similar approach with proximity refinement, and concludes that this restriction
has a smaller type II error, as it filters out more of both false articles and correct articles.
This is done for all New York Times, Wall Street Journal, Bloomberg, and Financial Times
articles that report immediately following the FOMCs release of any statement post-meeting.
Often, this occurs on either the day of or day after the statement is released to the public.
Since FOMC decisions are made on pre-specified meeting dates, our index allows us to
incor-porate information arrival following each FOMC meeting and capture any e↵ects that FOMC
(in)actions have on the transparency between the Fed and the public. In order to account
for the occasional inconsistency with news articles reporting on non-FOMC statement release
dates and better understand the trade-o↵s associated with this proximity refinement, we
process involves extracting and reading through the bulk of our scraped news sources. This
has helped us guarantee the chosen news articles building our transparency index is drawing
from the correct source, regardless of the amount of trust we have in the automation of our
programs.
While this proximity search does filter out articles that mention all the keywords, it is diffi
-cult to analyze these articles, as the explicit term transparency is not indicative of describing
Fed policy action by these news sources. There are certain lexicons that may describe Fed
policy actions, with words that contain clear-cut terms, such as action verbs and explicit
ad-jectives. A direct approach such as this is foreseeable to be problematic and extremely
sub-jective. Thus, it is important to human audit the news-based approach as a robustness check
after the transparency index has been applied to monetary policy data. By doing so, we will
be able to identify only articles that pertain to reactionary e↵ects of the FOMCs released
policy decisions and assess the level of readership and understanding afterwards.
Once our corpus for topic extraction is completed, we will be able to start incorporating the
LDA model which will lay out the underlying statistical model and describe given
estima-tions. Once this is completed, the LDA model will be able to discuss transforming output of
the estimation into a measure of communication.
4.2
Statistical Model and Extraction of Topics
Developed by Blei, Ng, and Jordan (2003), Latent Dirichlet Allocation (LDA) is a
genera-tive probabilistic model designed for information retrieval. Because of its flexible clustering
algorithm, we can use LDA to discover topics groups of words based on their repeated
co-occurrence across paragraphs discussed within a document. LDA is a particularly attractive
model to use for this research, as it has the ability to consistently estimate topics that
ap-pear naturally, without requiring any pre-assigned labels. In a more technical sense, LDA is
an unsupervised learning algorithm, meaning that since it produces no meaningful topic
researcher. This technique can be contrasted to supervised machine learning, where
super-vised machine learning starts with a researcher classifying observations to train an algorithm
under human supervision to learn the correlation between the researchers ascribed classes
and words characteristic of documents in those classes (Grimmer and Stewart (2013), we can
scrape for any number of topics within the FOMC statements, based on the parameters set.
For this research, we have two parameterized conditions. The first input we supply is a
cor-pus of the text documents to prepare for scraping, which in this case, is the full history of
FOMC statements and accompanying news articles reporting the decisions of the FOMC.
The second input we supply is the number of words per topic and the number of topics per
document the algorithm will extract. These numbers can di↵er, but for simplicity, we keep to
a standard ten words per topic with five topics per document.
4.2.1 Extraction of Topics
For the construction of the transparency index, we need to account for how the Federal
Re-serves practice of transparency has evolved over time. Namely, we need to be sensitive
to-ward (i) the Fed’s institutional changes in its release of materials and (ii) the di↵ering lag
times at which these materials were released. To do this, we first establish transparency by
computing the similarity values between discourse within the transcripts and reporting in the
statements (previously the Record of Policy Actions) are high. This step is necessary as it
not only establishes the Fed’s definition of central bank transparency, but it also acts as a
proof of concept in preparation for our second step. Next, we compute the similarity between
the statements and the news articles that report on the statements. If we want to provide
meaning to this definition of transparency, understanding public interpretation of Fed policy
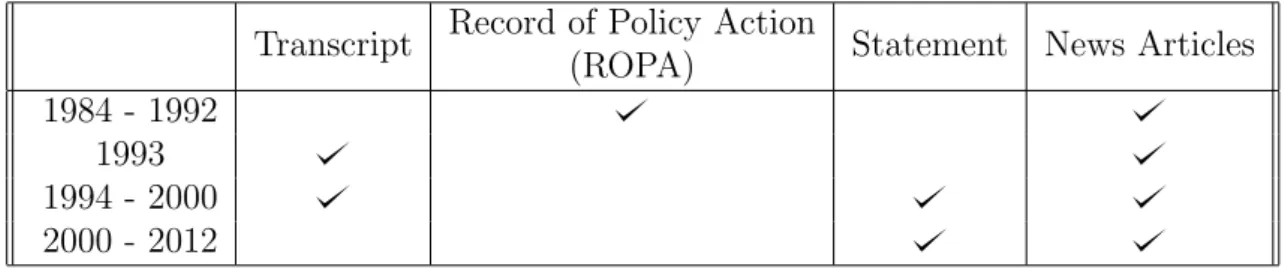
Table 2: Similarity Construction based on FOMC Materials Available
Transcript Record of Policy Action
(ROPA) Statement News Articles
1984 - 1992 1993 1994 - 2000 2000 - 2012
Based on the materials we have available and in order to ensure the correct sources are scraped,
we have accounted for our periods of analysis between 1984 and 2012 (outlined in Table 2) in
a few di↵erent ways:
1. Historically, between the period of 1967 and 1992, the FOMC consistently released a
Record of Policy Actions (ROPA) after each meeting. Here, we analyze the relationship
directly between the ROPA and the news articles that report on the ROPA.
2. The year 1993 is unique such that it is the only year in which the Federal Reserve
re-leased neither a ROPA nor any official statement during this year. As a result, we scrape
the transcripts of every meeting date in 1993. It is important to note that we take both
the statements and ROPA to be a summary of the FOMC meeting transcripts, as the
content of the reporting should be an accurate reflection of what was said during the
FOMC meetings. For proof of concept, this is illustrated in Appendix C, where we
show the full similarity measure between the topics contained in the transcripts and
ROPA/statements.
3. In 1994, the ROPA was replaced by what we know to be the first official FOMC
state-ment. From then on, statements became the primary information source for policy
changes to the public, especially since they were issued for immediate release post FOMC
meetings. Between years 1994 to 2000, statements were released only after meetings
where policy changes to the interest rate occurred. For the meeting dates in which no
statement was released, we use the transcripts in lieu of the statements and compute
in 1993. This is an e↵ort to fill in missing data in order for our transparency series to
remain uninterrupted.
4. Lastly, from 2000 to 2012, the FOMC decided to continuously release statements
im-mediately after every meeting, regardless of whether a policy change occurred or not.
Thus, we analyze the relationship directly between the statements and their respective
news sources.
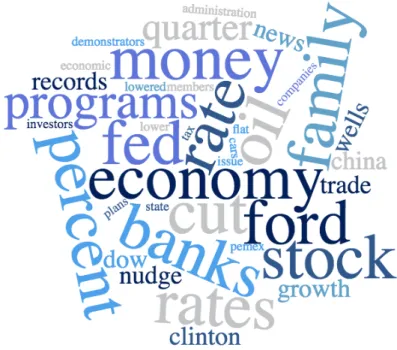
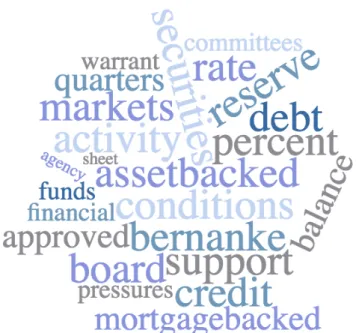
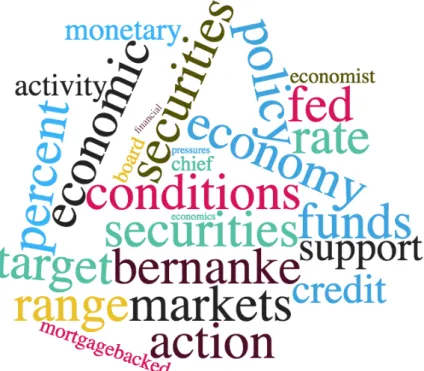
4.2.2 Connecting Topics to External Events
These word clouds showcase the highest ranked topics extracted from a given document. The
four documents showcased here are the August 1996 statement, the news articles reporting
on the August 1996 statement, the December 2008 statement, and the news articles
report-ing on the December 2008 statement. The size of each word within the word cloud is
pro-portional to the probability of the word occurring within the topic. The largest words within
the 1996 statements and news article word clouds resemble each other, as does the 2008 set.
However, when comparing 1996 and 2008, even at a glance, we can see the discourse within
and about the FOMC has changed drastically over the years. A common approach for
as-sessing the quality of the output of machine learning algorithms is to validate them against
external data. Since we do not rely heavily on specific topic labels, such an exercise is not
crucial for interpreting our results, but for interest we have explored the relationship of the
estimated topics between 1996 and 2008. Topics extracted from materials in December 2008,
a historical peak in the Great Recession, consist of words reflective of that particular time
pe-riod, such as mortgage-backed and asset-backed. Additionally, words featured in these topic
extractions also pick up the sentiment and tone of the FOMC and news articles. For
exam-ple. vocabulary such as petrified and pressures o↵er a peak into the tense financial discourse
of 2008. Comparatively, words within the topics extracted from the 1996 materials consist of
generic and traditionally economic terms, and we are not surprised by such, as the August
1996 topics should be reflective of untroubled and a non-recessionary time. In conclusion, we
Figure 1: Topics scraped from 1996 Statements
Figure 3: Topics scraped from 2008 Statements
4.3
Computing Topic Similarity
Vector space modeling is an algebraic model for representing text documents as vectors and
words within a document as indexed values. When documents are represented as term
vec-tors, the similarity between documents is determined by word overlap. There are a variety of
distance measures to calculate the similarity between topics within a set of documents, such
as cosine similarity, the Jaccard correlation coefficient, Euclidean distance, and the
Manhat-tan disManhat-tance. Given the diversity of measures available, the di↵erence in their e↵ectiveness
in text document clustering has been contested. For this research, we have applied each of
these measures to compute the topic similarity within our set of documents, and have found
that the cosine similarity measure performed the best, by measure of highest log likelihood.
Acosta (2015) has also applied the cosine similarity method to analyze the resemblance
be-tween FOMC transcripts and minutes.
Cosine similarity is quantified as the cosine of the angle between vectors. The similarity of
two document vectors, a and b, with m elements ai and bi, is the cosine of the angle that lies
between a and b.
Figure 5: Formula for cosine similarity between document vectors, a and b:
For this research, we compute the similarity between specific topics and topic words. LDA
is a topic model that generates a probability distribution over words in the training corpus.
Each probability attached to a word within a ranked topic represents the word’s
distribu-tion within that topic which, which is non-negative. Thus, words that have a pattern of high
co-occurrence will likely appear within the same topic. The similarity between two topics is
computed as the average pairwise cosine similarity between the words within the topics. As a
prac-tice, a news article that reports the released FOMC statement verbatim would receive a
simi-larity value of 1. However, when comparing a traditional FOMC statement and a news article
that covers an NBA championship, the similarity value would be very close to 0.
Additionally, an important property of the cosine similarity is its normalization of document
length. In other words, documents with the same composition but di↵erent word totals will
be treated identically. This is a highly convenient attribute to our studies, as our documents
of comparison: transcripts and statements, statements and news articles, etc. vastly di↵er in
word length. A graphical representation and detailed discussion of cosine similarity can be
found in the Appendix.
4.3.1 Interpretation
The two word clouds featured in this section capture topic similarity across documents from
(1) the August 1996 statement and news articles and (2) the December 2008 statement and
news articles. The August 1996 materials reveal a relatively high similarity value of 0.7608
between documents, whereas the December 2008 materials reveal a lower similarity value of
0.5364 between documents.2 In this particular case, the news articles discourse and
vocabu-lary surrounding the FOMCs December 2008 statement varied widely from the actual
state-ment itself.
It is worth noting that presidential elections also occurred a few months post-August 1996
and one month prior to December 2008. The news articles for these two respective dates
in-volved discourse about their own nearing elections, but not enough to cloud our topic
extrac-tion methods for FOMC-related vocabulary.
Figure 6: Topics scraped from 1996 statements and news
5
Analyzing the Index
5.1
General Discussion
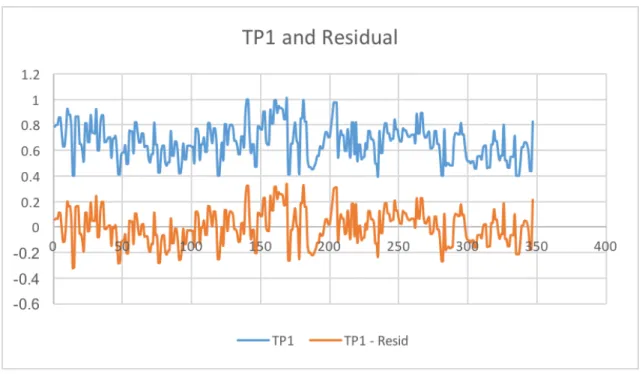
Presented in figure 8, we plot our raw transparency series and the purged series.3 An
inter-esting finding in our results is the pattern at which transparency dips and rises in accordance
with the largest financial crises over this nearly 30 year horizon. The alignment of our index
coincides consistently clearly with the 1987 stock market crash, the 1989 Junk bond crash,
the Dotcom bubble from 1999 to 2000, and the Global financial crisis from 2007 to 2008.
In the height of each of these financial crises, we find that transparency tends to spike. In
other words, the FOMCs discussions of economic activity in their statements align with
con-versations within the news. However, transparency tends to taper o↵ after the peak of the
financial crisis passes. Graphically, we find decreasing levels of transparency, meaning that
the information the FOMC releases to the public moving on from each financial crisis is not
at the forefront of the publics minds. One could interpret this as the FOMC seeking to move
the economy away from discussions about crises and toward improvement, whereas the crises
tend to perpetrate discourse within the news. A look at a number of financial crises over the
last 30 years is suggestive of a few characteristics in transparency: excessive exuberance, poor
regulatory oversight, dodgy accounting, herd mentalities and, in many cases, a sense of
infal-libility.
Figure 8: Transparency Index
5.2
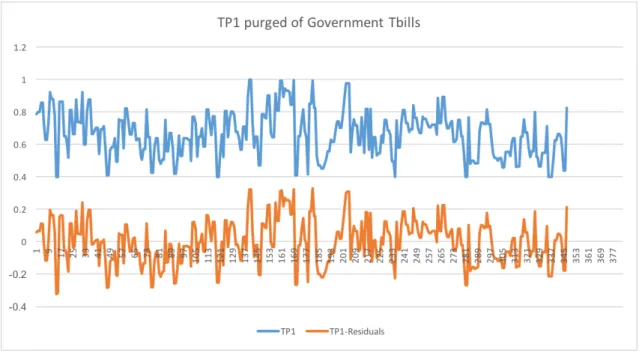
Establishing Exogeneity: Hall-Evans Tests
Hall (1988) and Evans (1992) argued that technology shocks should not in principle be
cor-related with other exogenous shocks that are not cor-related to technology.4 We conduct similar
exogeneity tests for our measure of transparency, considering four types of shocks that have
been used in the literature: monetary indicators, fiscal shocks, oil shocks, and interest rate
spreads.
T ransparency =↵0+ 1X+u (1)
where X contains exogenous instruments from various sources: monetary policy [Romer and
Romer (2004), Barakchian and Crowe (2013), Gertler and Karadi (2011, 2015)], fiscal policy
[Government T-Bill rate], innovations to oil [Ramey and Vine (2010)] and interest rate spread
[Gilchrist and Zakrajsek (2012)]. We run each instrument, one at a time, on our transparency
measure, and find that the one-year government Treasury bill rate and the Ramey-Vine oil
shocks have significant e↵ects on transparency; even though the R-squares are small. Having
both in the same regression renders the Ramey-Vine oil shocks insignificant. To this end, we
create two transparency indexes: one purged of One-year government Treasury bill rate only
(hereafter, TP1), and the other purged of both the Tbill rate and the Ramey-Vine shocks
(hereafter, TP2). That is, our measure of transparency is the residual u from the two
regres-sions. Given the similarity of the two indexes we present results using TP1 only.5
Figure 9: Plot of the Raw and Purged Transparency Series
6
Conditional Applications
The salient macroeconomic application regarding our transparency index is what e↵ect it has
on the propagation of the Federal Funds rate onto the macroeconomy. As a test of our index,
we examine whether the FOMC was more or less likely to surprise the markets with their
interest rate decisions.(Husted et al 2015) We apply our measure of transparency to
empiri-cal monetary policy models. Given transparency is measured on events surrounding FOMC
meeting days we thought it prudent that innovations to monetary policy should be
simi-larly defined.(Husted et al 2015) As such we employ the recently popularized estimation of
monetary shocks from the federal funds rate futures and the Eurodollar markets. In order to
identify the structural monetary policy shocks, we employ high frequency measures of policy
surprises as external instruments like that of the methodology proposed by Kuttner (2001),
Gertler and Karadi (2015), and Husted et al (2015).6 The key identifying assumption is that
news within a given window about the rest of the economy within that window on FOMC
days is solely driven by monetary policy. That is, surprises in Fed Funds futures on FOMC
dates are orthogonal to within-window movements in other shocks a↵ecting economic and
fi-nancial variables.(Husted et al 2015) These surprises in principle reflect revisions in beliefs on
FOMC dates about the future path of short-term rates.7
Under the assumption that both the transparency and external monetary policy shock
in-struments are exogenous we can directly study monetary policy impacts without the usual
ad-hoc timing assumptions imposed in Vector AutoRegressions (VARs). To this end we use
Oscar Jorda’s Local Projection perturbation method with dependent variabes output,
infla-tion, commodity prices and M2.8
LetZ = [y, ⇡,P COM,M2] where y is log output,⇡ is the (log of) CPI, P COM is an index of commodities prices and M2 is a (log of) stock of money. The sample period is from 1984
6To isolate the impact of news about monetary policy, the surprises in futures rates are measured within a tight window around the FOMC decision.
7We also calculated shocks for other maturities of the fed futures and Eurodollar instruments and results are robust. We thank Michael Kiley and John Rogers for data of these innovations.
to 2012, to coincide with the 5-year lagged transcript data and the futures market data. We
make the necessary transformations to make the variables stationary. We run:
Z(t+h) =↵0+ (L)Z(t 1) +✓(h)M P(t) + (h)[M P(t)⇤T P1(t)] +u(t) (2)
Forh = 0,1.2, ... we are interested in whether transparency impacts monetary policy (MP)
propagation through the components of Z. We use 4 lags of each of the variable in the
re-gression and look at responses up to h=5.
6.1
Forward Guidance
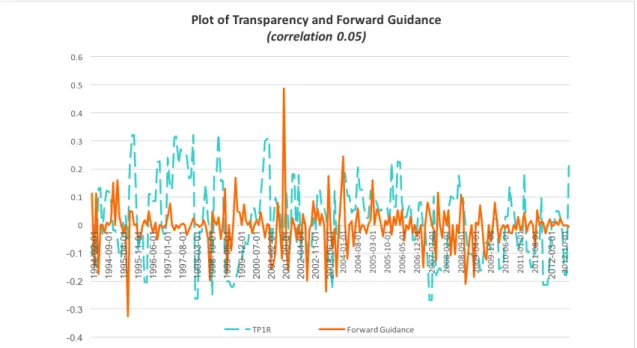
Since the recent financial crisis, a popular tool of the Fed has been forward guidance.
Al-though forward guidance is a small subset of transparency, we check for similarities between
transparency and measures of forward guidance that exist in the literature.9 On it’s face,
for-ward guidance is a small subset of monetary policy transparency, as the latter includes more
than just policymakers directives of future policy actions. We find that this is indeed the case
as the correlation value between transparency and forward guidance is positive, but has a low
value of 0.05. Thus, our measure of transparency is picking up more than forward guidance.
Figure 10: Plot of Transparency and Forward Guidance
6.2
Monetary Policy Uncertainty
Recently, monetary policy researchers have derived indexes from news sources intended to
capture the degrees of uncertainty (denoted as MPU) with policymaker’s actions (Husted et
al (2015), Rogers et al (2018)). It is worth noting the di↵erence between our transparency
index and Husted et al’s (2015) MPU index. The MPU index is derived solely from scraped
news sources to gauge the uncertainty that the public perceives about Federal Reserve
pol-icy actions and their consequences. Our transparency index strives to capture how well the
Federal Reserve conveys topics to the public, gathered from scraped official FOMC
mate-rials and news sources together. Regardless if the Fed conveys uncertainty about a certain
policy or event, as long as the central bank’s message is clearly conveyed to the public, this
receives high marks for transparency. This is the subtly between the MPU index and our
transparency index. For proof of concept, we plot the MPU index against our transparency
measure to gauge the extent which the latter is a proxy for the former.
Husted et al (2015) constructs a measure of monetary policy uncertainty index to capture the
con-sequences. The index was constructed through a news source-based text scraping approach
in order to gauge the publics expectations. According to Husted et al, the constructed
se-ries correlated with positive shocks to monetary policy uncertainty lower output and
infla-tion with about the same dynamic pattern as do identified contracinfla-tionary monetary policy
shocks. With these specifications in mind, our transparency index and the MPU index has
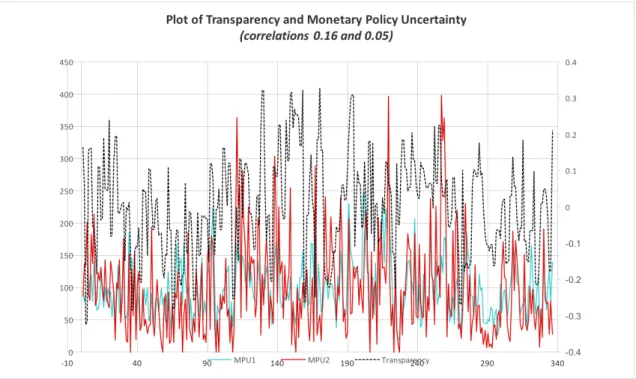
correlation values of 0.16 with MPU110 and 0.05 with MPU211. The MPU index never had
any material e↵ect in our OLS regressions on transparency, so we do not report these results.
Figure 11: Plot of Transparency and Monetary Policy Uncertainty
6.3
Impulse Responses to Monetary Policy Shocks
6.3.1 Fed Funds Futures Shock
Armed with exogenous monetary policy innovations and our exogenous measure of
trans-parency, we employ local projection (Jorda 2012) to trace out the dynamical e↵ects of real
and financial variables to surprises to monetary policy.
Figure 12 displays the direct responses to an identified monetary policy shock. In each case,
the panels report the estimated values of ✓(h) along with 95 percent confidence bands (cap-tured by the length of each bar). We find a significant positive output response at the one
step ahead horizon and a delayed commodity price increase 5 months ahead. While the
out-put response appears a temporary blip that quickly reverse, the latter seems to capture
ex-pectation of future inflation. All other responses are insignificant over the 5 month-horizon.
Figure 12: Plots of ✓(h) over horizon h when Monetary Policy derived from Fed Funds Fu-tures Market
6.3.2 Monetary Policy-Transparency Interactions
We now address the salient application of our transparency index: if and how does
trans-parency impact monetary policy transmission? Figure 13 displays the coefficients of the
in-teraction term (h) over select horizon h. In each case, the panels report the estimated
co-efficient along with 95 percent confidence bands (captured by the length of each bar). We
observe no significant values for the interaction terms for any of the horizons. Only inflation
appears that it could be significant if we were to increase the acceptance region a little.12
7
Conclusion
We create a quantitative method for measuring transparency, a subset of central bank
trans-parency that studies the transmission of language on macro variables. In order to capture
transparency quantitatively, we measure the similarity of topics discussed in each of two
dif-ferent sources (i) the official FOMC statements / record of policy actions released
immedi-ately after the meetings and (ii) news articles reporting on each FOMC meeting. By
com-puting a similarity measure between the topics discussed within the two sources, we believe
to be answering this question two fold: (i) how well does the FOMC convey topics in the
re-porting of their policy decisions to the public? and (ii) how well are these official statements
interpreted by public news sources? If we can answer these questions, which we believe to be
best answered by understanding the similarity between the two sources, then we have found a
quantitative measure of transparency.
By means of natural language processing techniques, we create an index that captures the
success of communication between the FOMC and a variety of public news sources. We
quan-tify the e↵ectiveness of this current method of policy communication by analyzing the
reac-tions, and thus relationship, between publicly available FOMC meeting materials and federal
funds futures rate fluctuations around FOMC meeting dates. This is an e↵ort to not only
un-derstand the history and chronology of circulating, policy and economic-related conversations
between the Fed and the public, but is also to understand to what magnitude the release of
information can contribute to reactionary e↵ects in the aggregate economy. Finally, in the
conditional applications of our transparency index, we find that our transparency is
uncor-related with forward guidance and monetary policy uncertainty. While output and money
do not respond significantly to transparency shocks, positive transparency shocks leads to a
Bibliography
[1] Kuttner, Kenneth N., Monetary policy surprises and interest rates: Evidence from the
Fed funds futures market, Journal of Monetary Economics Volume 47, Issue 3, June
2001, Pages 523544.
[2] Grkaynak, Refet S., Brian Sack and Eric Swanson, The Sensitivity of Long-Term Interest
Rates to Economic News: Evidence and Implications for Macroeconomic Models,
Ameri-can Economic Review, Vol. 95, No. 1 (Mar., 2005), pp. 425-436
[3] Campbell, Je↵rey R., Charles L. Evans, Jonas DM Fisher, and Alejandro Justiniano.
”Macroeconomic e↵ects of federal reserve forward guidance.” Brookings Papers on
Eco-nomic Activity (2012): 1-80.
[4] Cochrane, John and Monika Piazzesi, 2002. ”The Fed and Interest Rates - A
High-Frequency Identification.” American Economic Review, 92(2): 90-95.
[5] Faust, Jon, Eric T. Swanson, and Jonathan H. Wright (2004), Identifying VARS based
on high frequency futures data, Journal of Monetary Economics, Volume 51, Issue 6,
September 2004, Pages 1107113.
[6] Barakchian, S. Mahdi and Christopher Crowe, Monetary Policy Matters: Evidence from
New Shocks, Journal of Monetary Economics, Volume 60, Issue 8, November 2013, Pages
950966.
[7] Gertler, Mark and Peter Karadi, Monetary Policy Surprises, Credit Costs, and Economic
[8] Nakamura, Emi, and Steinsson, Jn, High Frequency Identification of Monetary
Non-Neutrality, October 2015 working paper.
[9] Acosta, Miguel (2015). FOMC Responses to Calls for Transparency, Finance and
Eco-nomics Discussion Series 2015-060. Washington: Board of Governors of the Federal
Re-serve System, http://dx.doi.org/10.17016/FEDS.2015.060.
[10] Geraats, Petra (2014). Monetary Policy Transparency, CESifo Working Paper No. 4611.
Category 7: Monetary Policy and International Finance (January 2014).
[11] Husted, Roger, Sun (2017). Monetary Policy Uncertainty, Federal Reserve Working
Pa-per.
[12] Geraats, Petra, Central Bank Transparency, The Economic Journal, 112 (November
2002), F532F565.
[13] Faust, Swanson, Wright, Identifying VARS Based on High Frequency Futures Data
Jour-nal of Monetary Economics 51 (2004) 11071131.
[14] Barakchian, Crowe, Monetary policy matters: Evidence from new shocks data Journal of
Monetary Economics (2013) 950-966.
[15] Bernanke, Ben S. and Frederic S. Mishkin. ”Inflation Targeting: A New Framework For
Monetary Policy?,” Journal of Economic Perspectives, 1997, v11(2,Spring), 97-116.
[16] Hall, R.E., 1988, The relation between price and marginal cost in U.S. industry, Journal
of Political Economy 96, 921-947.
[17] Evans, C.L., 1992, Productivity shocks and real business cycles, Journal of Monetary
Economics 29, 191-208.
[18] Hamilton, James D., Daily Changes in Fed Funds Rates Journal of Money, Credit and
Banking, Vol. 41, No. 4 (June 2009)
[19] Hamilton, James D., Daily Monetary Policy Shocks and New Home Sales, Journal of
[20] Thornton, D. L. (2003), Monetary policy transparency: transparent about what?. The
Manchester School, 71: 478497. doi:10.1111/1467-9957.00363
[21] Faust, Svensson, Transparency and Credibility: Monetary Policy with Unobservable
Goals, International Economic Review, Vol. 42, no. 2 (May 2001): 369-397
[22] Poole, William.”FOMC Transparency. ”Federal Reserve Bank of St. Louis Review,
Jan-uary/February 2005, vol. 87, no. 1, pp. 1-9.
[23] Bholat, David, Hansen, Stephen, Santos, Pedro and Schonhardt-Bailey, Cheryl (2015)
Text mining for central banks: handbook. Centre for Central Banking Studies (33). pp.
1-19. ISSN 1756-7270
[24] Stephen Hansen, Michael McMahon, Andrea Prat; Transparency and Deliberation
Within the FOMC: A Computational Linguistics Approach, The Quarterly Journal of
8
Appendix
8.1
Appendix A: List of English Stopwords
Table 3: STOPLIST (ALPHABETICAL)
a able about above according accordingly across
after afterwards again against ain’t all allow
allows almost alone along already also although
always am among amongst an and another
any anybody anyhow anyone anything anyway anyways
anywhere apart appear appreciate appropriate are aren’t
around as aside ask asking associated at
available away awfully b be became because
become becomes becoming been before beforehand behind
being believe below beside besides best better
between beyond both brief but by c
c’mon c’s came can can’t cannot cant
cause causes certain certainly chairman changes clearly
co com come comes committee concerning consequently
consider considering contain containing contains corresponding could
couldn’t course currently d definitely described despite
did didn’t di↵erent do does doesn’t doing
don’t done down downwards during e each
edu eg eight either else elsewhere enough
entirely especially et etc even ever every
everybody everyone everything everywhere ex exactly example
except f far federal few fifth first
five followed following follows fomc for former
formerly forth four from further furthermore g
get gets getting given gives go goes
going gone got gotten greetings h had
hadn’t happens hardly has hasn’t have haven’t
having he he’s hello help hence her
here here’s hereafter hereby herein hereupon hers
herself hi him himself his hither hopefully
how howbeit however i i’d i’ll i’m
i’ve ie if ignored immediate immediate in
inasmuch inc indeed indicate indicated indicates inner
insofar instead into inward is isn’t it
it’d it’ll it’s its itself j just
k keep keeps kept know known knows
l last lately later latter latterly least
less lest let let’s like liked likely
little look looking looks ltd m mainly
mrs much must my myself n name
namely nd near nearly necessary need needs
neither never nevertheless new next nine no
nobody non none noone nor normally not
nothing novel now nowhere o obviously of
o↵ often oh ok okay old on
once one ones only onto open or
other others otherwise ought our ours ourselves
out outside over overall own p particular
particularly per perhaps placed please plus possible
presumably probably provides q que quite qv
r rather rd re really reasonably regarding
regardless regards relatively release respectively right s
said same saw say saying says second
secondly see seeing seem seemed seeming seems
seen self selves sensible sent serious seriously
seven several shall she should shouldn’t since
six so some somebody somehow someone something
sometime sometimes somewhat somewhere soon sorry specified
specify specifying still sub such sup sure
t t’s take taken tell tends th
than thank thanks thanx that that’s thats
the their theirs them themselves then thence
there there’s thereafter thereby therefore therein theres
thereupon these they they’d they’ll they’re they’ve
think third this thorough thoroughly those though
three through throughout thru thus to today
together too took toward towards tried tries
truly try trying twice two u un
under unfortunately unless unlikely until unto up
upon us use used useful uses using
usually uucp v value various very via
viz vs w want wants was wasn’t
way we we’d we’ll we’re we’ve welcome
well went were weren’t what what’s whatever
when whence whenever where where’s whereafter whereas
whereby wherein whereupon wherever whether which while
whither who who’s whoever whole whom whose
why will willing wish with within without
won’t wonder would would wouldn’t x y
yes yet you you’d you’ll you’re you’ve
8.2
Appendix B: Transparency Index
Table 4: Similarity Values of TP1 and TP2
Date Transparency 1 Transparency 2
2/1/1984 0.78349346 0.78349346
3/28/1984 0.798735351 0.798735351
4/1/84 0.798735351 0.827828131
5/23/84 0.856920911 0.856920911
6/1/84 0.856920911 0.797441102
7/18/1984 0.737961294 0.737961294
8/22/1984 0.62850354 0.62850354
9/1/84 0.62850354 0.733804977
10/3/1984 0.733804977 0.733804977
11/8/1984 0.919254774 0.919254774
12/19/1984 0.878117933 0.878117933
1/1/85 0.878117933 0.825683881
2/14/1985 0.773249829 0.773249829
3/27/1985 0.4 0.4
4/18/1985 0.4 0.631481481
5/17/1985 0.862962963 0.862962963
6/1/85 0.862962963 0.863002665
7/11/1985 0.863042367 0.863042367
8/20/85 0.649075403 0.649075403
9/6/1985 0.649075403 0.619937115
10/2/1985 0.590798828 0.590798828
11/6/1985 0.516842843 0.516842843
12/18/1985 0.81067115 0.81067115
1/1/86 0.81067115 0.736458943
2/13/1986 0.662246735 0.662246735
3/7/1986 0.662246735 0.768793919
4/2/1986 0.875341102 0.875341102
5/21/1986 0.736494866 0.736494866
6/5/1986 0.736494866 0.732599285
7/10/1986 0.728703704 0.728703704
8/14/1986 0.920251837 0.920251837
9/24/1986 0.597151844 0.597151844
10/1/86 0.597151844 0.701989135
11/6/1986 0.806826426 0.806826426
12/17/1986 0.873689633 0.873689633
1/15/1987 0.873689633 0.768309916
2/12/1987 0.6629302 0.6629302
3/1/87 0.6629302 0.672498199
4/1/1987 0.682066197 0.682066197
Date Transparency 1 Transparency 2
6/1/87 0.701202194 0.620688761
7/8/1987 0.540175329 0.540175329
8/19/1987 0.690619097 0.690619097
9/3/1987 0.690619097 0.700607125
10/23/1987 0.710595153 0.644564141
11/4/1987 0.578533128 0.578533128
12/17/1987 0.409054317 0.409054317
1/28/1988 0.409054317 0.485471624
2/11/1988 0.561888932 0.561888932
3/30/1988 0.581086336 0.581086336
4/4/88 0.581086336 0.609463824
5/9/1988 0.637841313 0.637841313
6/22/1988 0.491413793 0.491413793
7/1/1988 0.491413793 0.622839768
8/9/1988 0.754265744 0.754265744
9/21/1988 0.746444526 0.746444526
10/1/88 0.746444526 0.660766046
11/2/1988 0.575087566 0.575087566
12/15/1988 0.818968375 0.818968375
1/5/1989 0.818968375 0.778786676
2/9/1989 0.738604977 0.738604977
3/29/1989 0.658241578 0.658241578
4/1/89 0.658241578 0.731597319
5/17/1989 0.731597319 0.731597319
6/6/1989 0.731597319 0.677639063
7/7/1989 0.623680806 0.623680806
8/23/1989 0.632473907 0.632473907
9/1/89 0.632473907 0.580502106
10/4/1989 0.528530304 0.528530304
11/7/1989 0.504275943 0.504275943
12/20/1989 0.568325082 0.568325082
1/1/90 0.568325082 0.691746664
2/8/1990 0.815168246 0.815168246
3/28/1990 0.642901682 0.642901682
4/1/90 0.642901682 0.533727001
5/16/1990 0.424552319 0.424552319
6/1/90 0.424552319 0.503826464
7/5/1990 0.583100609 0.583100609
8/22/1990 0.635891049 0.635891049
9/1/90 0.635891049 0.570074128
10/3/1990 0.504257207 0.504257207
11/14/1990 0.478446454 0.478446454
12/7/1990 0.505258199 0.505258199
1/8/1991 0.505258199 0.627578706
2/1/1991 0.749899213 0.749899213
Date Transparency 1 Transparency 2
4/30/1991 0.556144012 0.612511699
5/15/1991 0.668879387 0.668879387
6/1/91 0.668879387 0.624790032
7/5/1991 0.580700677 0.580700677
8/6/1991 0.419418391 0.419418391
9/13/1991 0.419418391 0.462022931
10/2/1991 0.50462747 0.50462747
11/6/1991 0.652416199 0.652416199
12/6/1991 0.526830777 0.526830777
1/1/92 0.526830777 0.581114551
2/6/1992 0.635398324 0.635398324
3/1/92 0.635398324 0.631341323
4/1/1992 0.635398324 0.629312823
5/20/1992 0.627284323 0.627284323
6/1/92 0.627284323 0.563207885
7/2/1992 0.499131448 0.499131448
8/19/1992 0.768334527 0.768334527
9/4/1992 0.768334527 0.747833067
10/7/1992 0.727331607 0.727331607
11/18/1992 0.523225993 0.523225993
12/23/1992 0.646451985 0.646451985
1/1/93 0.646451985 0.672735797
2/4/1993 0.699019608 0.699019608
3/24/1993 0.586394448 0.586394448
4/1/93 0.586394448 0.699885732
5/19/1993 0.813377017 0.813377017
6/1/93 0.813377017 0.770241544
7/8/1993 0.727106071 0.727106071
8/18/1993 0.654640546 0.654640546
9/22/1993 0.770760493 0.770760493
10/1/93 0.770760493 0.718682474
11/17/1993 0.666604455 0.666604455
12/22/1993 0.4 0.4
1/1/94 0.4 0.472882047
2/4/1994 0.545764094 0.545764094
3/22/1994 0.659197729 0.659197729
4/18/1994 0.521382595 0.731557131
5/17/1994 0.803916533 0.803916533
6/1/94 0.803916533 0.72332321
7/6/1994 0.642729887 0.642729887
8/16/1994 0.752694047 0.752694047
9/27/1994 0.799594251 0.799594251
10/1/94 0.799594251 0.788281384
11/15/1994 0.776968517 0.776968517
Date Transparency 1 Transparency 2
1/1/95 0.673975459 0.655740145
2/1/1995 0.637504831 0.637504831
3/28/1995 0.567558122 0.567558122
4/1/95 0.567558122 0.637850761
5/23/1995 0.7081434 0.7081434
6/1/95 0.7081434 0.667033715
7/6/1995 0.625924029 0.625924029
8/22/1995 0.890786093 0.890786093
9/26/1995 0.99684937 0.99684937
10/1/95 0.99684937 0.863487208
11/15/1995 0.730125046 0.730125046
12/19/1995 0.577373128 0.577373128
1/31/1996 0.646308407 0.646308407
2/1/96 0.646308407 0.557734412
3/26/1996 0.469160417 0.469160417
4/1/96 0.469160417 0.62783722
5/21/1996 0.786514024 0.786514024
6/1/96 0.786514024 0.775030465
7/3/1996 0.763546907 0.763546907
8/20/1996 0.760843918 0.760843918
9/24/1996 0.902421322 0.902421322
10/1/96 0.902421322 0.785717558
11/13/1996 0.669013793 0.669013793
12/17/1996 0.642349546 0.642349546
1/1/97 0.642349546 0.778130232
2/5/1997 0.913910919 0.913910919
3/25/1997 0.807208544 0.807208544
4/1/97 0.807208544 0.899475238
5/20/1997 0.991741932 0.991741932
6/1/97 0.991741932 0.941724741
7/2/1997 0.891707551 0.891707551
8/19/1997 0.944333695 0.944333695
9/30/1997 0.929150262 0.929150262
10/1/97 0.929150262 0.924488861
11/12/1997 0.91982746 0.91982746
12/16/1997 0.841941738 0.841941738
1/1/98 0.841941738 0.91775934
2/4/1998 0.993576941 0.993576941
3/31/1998 0.40982709 0.40982709
4/1/98 0.40982709 0.530013665
5/19/1998 0.65020024 0.65020024
6/1/98 0.65020024 0.697913015
7/1/1998 0.74562579 0.74562579
8/18/1998 0.815103717 0.815103717
Date Transparency 1 Transparency 2
10/15/1998 0.642821466 0.642821466
11/17/1998 0.415003001 0.415003001
12/22/1998 0.848292784 0.848292784
1/1/99 0.848292784 0.920010715
2/3/1999 0.991728646 0.991728646
3/30/1999 0.822651676 0.822651676
4/1/99 0.822651676 0.675214537
5/18/1999 0.527777399 0.527777399
6/30/1999 0.468700449 0.468700449
7/1/99 0.468700449 0.459739114
8/24/1999 0.450777779 0.450777779
9/1/99 0.450777779 0.464100146
10/5/1999 0.477422513 0.477422513
11/16/1999 0.507211253 0.507211253
12/21/1999 0.554886295 0.554886295
1/1/00 0.554886295 0.591599589
2/2/2000 0.628312882 0.628312882
3/21/2000 0.61461411 0.61461411
4/1/00 0.61461411 0.649565456
5/16/2000 0.684516803 0.684516803
6/28/2000 0.741418735 0.741418735
7/1/00 0.741418735 0.721198136
8/22/2000 0.700977538 0.700977538
9/1/00 0.700977538 0.741468899
10/3/2000 0.78196026 0.78196026
11/15/2000 0.880463883 0.880463883
12/19/2000 0.973917036 0.973917036
1/3/2001 0.973917036 0.762381209
2/1/01 0.973917036 0.656613295
3/20/2001 0.550845381 0.550845381
4/18/2001 0.67309478 0.67309478
5/15/2001 0.752107002 0.752107002
6/27/2001 0.717753303 0.717753303
7/1/01 0.717753303 0.655631717
8/21/2001 0.593510132 0.593510132
9/1/01 0.593510132 0.679022298
10/2/2001 0.764534464 0.764534464
11/6/2001 0.647757802 0.647757802
12/11/2001 0.546144407 0.546144407
1/30/2002 0.817733677 0.817733677
2/1/02 0.817733677 0.692676109
3/19/2002 0.567618541 0.567618541
4/1/02 0.817733677 0.542055378
5/7/2002 0.516492214 0.516492214
Date Transparency 1 Transparency 2
7/1/02 0.643512311 0.586687935
8/1/2002 0.529863559 0.529863559
9/24/2002 0.545116139 0.545116139
10/1/02 0.545116139 0.599607387
11/6/2002 0.654098634 0.654098634
12/10/2002 0.610270187 0.610270187
1/29/2003 0.750712436 0.750712436
2/1/03 0.750712436 0.71838861
3/18/2003 0.686064784 0.686064784
4/1/03 0.686064784 0.671198764
5/6/2003 0.656332745 0.656332745
6/25/2003 0.495042779 0.495042779
7/1/03 0.495042779 0.447521389
8/12/2003 0.4 0.4
9/16/2003 0.746806739 0.746806739
10/28/2003 0.577722226 0.577722226
11/1/03 0.577722226 0.652618133
12/9/2003 0.72751404 0.72751404
1/28/2004 0.810874101 0.810874101
2/1/04 0.810874101 0.77101219
3/16/04 0.731150278 0.731150278
4/1/04 0.731150278 0.703517262
5/4/2004 0.675884247 0.675884247
6/30/2004 0.690020947 0.690020947
7/1/04 0.690020947 0.764772742
8/10/2004 0.839524536 0.839524536
9/21/2004 0.763617965 0.763617965
10/1/04 0.763617965 0.732823199
11/10/2004 0.702028432 0.702028432
12/14/2004 0.667797373 0.667797373
1/1/05 0.667797373 0.718441156
2/2/2005 0.76908494 0.76908494
3/22/2005 0.755940142 0.755940142
4/1/05 0.755940142 0.741288716
5/3/2005 0.72663729 0.72663729
6/30/2005 0.70458815 0.70458815
7/1/05 0.70458815 0.71185407
8/9/2005 0.71911999 0.71911999
9/20/2005 0.721222605 0.721222605
10/1/05 0.721222605 0.689917804
11/1/2005 0.658613002 0.658613002
12/13/2005 0.884191154 0.884191154
1/31/2006 0.729569258 0.729569258
2/1/06 0.729569258 0.810502676
Date Transparency 1 Transparency 2
4/1/06 0.891436093 0.81913963
5/10/2006 0.746843166 0.746843166
6/29/2006 0.69843341 0.69843341
7/1/06 0.69843341 0.714964013
8/8/2006 0.731494617 0.731494617
9/20/2006 0.743873192 0.743873192
10/25/2006 0.613965733 0.613965733
11/1/06 0.613965733 0.624458674
12/12/2006 0.634951614 0.634951614
1/31/2007 0.750157606 0.750157606
2/1/07 0.750157606 0.699253712
3/21/2007 0.648349817 0.648349817
4/1/07 0.648349817 0.598250019
5/9/2007 0.548150222 0.548150222
6/28/2007 0.4 0.4
7/1/07 0.4 0.582073162
8/7/2007 0.764146325 0.764146325
9/18/2007 0.479242885 0.479242885
10/31/2007 0.497757736 0.497757736
11/1/07 0.497757736 0.48926541
12/11/2007 0.480773084 0.480773084
1/22/08 0.480773084 0.440386542
2/1/08 0.480773084 0.410096636
3/18/2008 0.684398229 0.684398229
4/30/2008 0.73384734 0.73384734
5/1/08 0.73384734 0.728447605
6/25/2008 0.723047869 0.723047869
7/1/08 0.723047869 0.767922091
8/5/2008 0.812796314 0.812796314
9/16/2008 0.722796314 0.722796314
10/29/08 0.722796314 0.672796314
11/25/08 0.622796314 0.604582793
12/16/08 0.536369272 0.536369272
1/28/2009 0.51364106 0.51364106
2/1/09 0.51364106 0.505601598
3/18/2009 0.497562136 0.497562136
4/29/2009 0.51338364 0.51338364
5/1/09 0.51338364 0.484469598
6/24/2009 0.455555556 0.455555556
7/1/09 0.455555556 0.503648861
8/12/2009 0.551742167 0.551742167
9/23/2009 0.553407098 0.553407098
10/1/09 0.553407098 0.540505741
11/4/2009 0.527604384 0.527604384
12/16/2009 0.613696879 0.613696879
Date Transparency 1 Transparency 2
2/1/10 0.636523635 0.547686312
3/16/2010 0.458848989 0.458848989
4/28/2010 0.464531053 0.464531053
5/1/10 0.464531053 0.554814546
6/23/2010 0.645098039 0.645098039
7/1/10 0.645098039 0.698430637
8/10/2010 0.751763235 0.751763235
9/21/2010 0.671996337 0.671996337
10/1/10 0.671996337 0.625684813
11/3/2010 0.579373288 0.579373288
12/14/2010 0.521450841 0.521450841
1/26/2011 0.556484242 0.556484242
2/1/11 0.556484242 0.6777713
3/15/2011 0.799058358 0.799058358
4/27/2011 0.519849296 0.519849296
5/1/11 0.519849296 0.491085465
6/22/11 0.462321634 0.462321634
7/1/11 0.462321634 0.505312915
8/9/2011 0.548304197 0.548304197
9/21/2011 0.547799392 0.547799392
10/1/11 0.547799392 0.629006667
11/2/2011 0.710213942 0.710213942
12/13/2011 0.4 0.4
1/25/2012 0.4 0.4
2/1/12 0.4 0.447873749
3/13/2012 0.495747498 0.495747498
4/25/2012 0.623249883 0.623249883
5/1/12 0.623249883 0.64287097
6/20/2012 0.662492057 0.662492057
7/1/12 0.662492057 0.652020385
8/1/2012 0.641548712 0.641548712
9/13/2012 0.57948026 0.57948026
10/24/2012 0.436176798 0.436176798
11/1/12 0.436176798 0.630286045
8.3
Appendix C: Graphical Representation of Cosine Similarity
There are many di↵erent techniques for measuring the similarity of topics between texts.
One way to measure document similarity is to use simple Euclidean distance. For example,
Kloptchenko et al. (2004) use Euclidean distance to find clusters of financial reports.
How-ever, as Figure 3 shows, this distance measure has limitations. The figure represents three
hypothetical documents, each containing two terms a and b. Suppose documents 1 and 2 use
terms a and b in nearly the same proportions. However, because document 1 may be much
longer than document 2, their distance is quite significant. In fact, document 3, which uses
term a relative to term b substantially more than document 2, would be measured as more
similar to document 1, simply based on its similar length.
Figure 14: Graphical Representation of Cosine Similarity
This figure represents three documents, each containing two terms a and b. Documents 1 and 2 have very similar content yet lie far apart due to di↵erences in length.
This example shows the distortions that can arise from using Euclidean distance to measure
document distance. A measure that avoids these problems is cosine similarity (CS), which
captures the angle formed by two vectors. Going back to Figure 8, we can see that the angle
formed between documents 1 and 2 is very small they point in the same direction since they
use the two terms in nearly identical proportions. However, because the term frequencies
and another only term b, the vectors would be orthogonal. So, measuring the cosine of the
angle formed by two documents in the vector space provides a similarity measure
8.4
Appendix D: Guideline to Cleaning the Dataset
1. Tokenize each statement. In other words, we break each statement into its constituent
linguistics elements: words, numbers and punctuation. One can easily then count the
number of occurrences of a given token in each statement.
2. Remove all non-alphabetic terms. This includes numbers and punctuation.
3. Remove English stop words. A custom stop word list has been modified for this
anal-ysis, and includes terms such as personal pronouns, articles, conjunctions, and
non-relevant economic terms. The full list of 500+ stop words can be found in Appendix
B.
4. Stem remaining words. Stemming involves cutting o↵ affixes and counting just
stem-sin other words reducing each word to their English root form. In practice, many text
miners simply stem words because this procedure tends to help normalize the count
of each word that appears in the document for later analysis. For example, the words
inflation and inflating contain the stem inflat and the affix -ion and -ing. Therefore,
in-flation and inflating once stemmed would be treated as two instances of the same token
(Schonhardt-Bailey).
Looking past count-based analyses, recognizing and understanding tokens can assist in
de-ciphering FOMC member discussion. To expand on this idea, many words in statements,
such as output, can be counted and utilized to formulate an index of focus on economic
ac-tivity. It should be noted these focus lists are quite subjective and may not obvious choices.
Additionally, these words can be interpreted in other circumstances. As an example, output
may be correlated with economic activity, but can also be used to describe wage growth as a
factor in inflationary pressures. With the idea of topic modeling, these uncertainties can be
addressed and settled as they can adapt a flexible statistical structure. These structures can
group words into one classification, or topic, therefore allowing the same word to appear in
Once our corpus for topic extraction is completed, we will be able to start incorporating the
LDA model which will lay out the underlying statistical model and describe given
estima-tions. Once this is completed, the LDA model will be able to discuss transforming output of