Emerging Science Journal
Vol. 1, No. 4, December, 2017
Attacks and Intrusion Detection in Cloud Computing Using Neural
Networks and Particle Swarm Optimization Algorithms
Ahmad Shokouh Saljoughi
a*, Mehrdad Mehvarz
b, Hamid Mirvaziri
ca Department of Computer Engineering, Shahid Bahonar University, Kerman, Iran b Department of Computer Engineering, University of Science and Technology, Tehran, Iran
c Assistant Professor, Department of Electrical and Computer Engineering, Shahid Bahonar University, Kerman, Iran
Abstract
Today, cloud computing has become popular among users in organizations and companies. Security and efficiency are the two major issues facing cloud service providers and their customers. Since cloud computing is a virtual pool of resources provided in an open environment (Internet), cloud-based services entail security risks. Detection of intrusions and attacks through unauthorized users is one of the biggest challenges for both cloud service providers and cloud users. In the present study, artificial intelligence techniques, e.g. MLP Neural Network sand particle swarm optimization algorithm, were used to detect intrusion and attacks. The methods were tested for NSL-KDD, KDD-CUP datasets. The results showed improved accuracy in detecting attacks and intrusions by unauthorized users.
Keywords:
Cloud Security; Intrusion Detection; Neural Networks;
Particle Swarm Optimization.
Article History:
Received: 18 September 2017
Accepted: 15 December 2017
1-
Introduction
Uploading sensitive data to public cloud storage services poses security risks such as accessibility, confidentiality and integration to organizations. Moreover, non-stop cloud services have caused high levels of intrusion and abuse. Using firewall and intrusion detection system is the only permanent solution to protect users’ data and cloud resources. Some of attacks, like DOS, are too complex for firewalls; so, one can use attack detection methods with the ability to detect various types of attacks. Recently, intelligent and meta-heuristic algorithms are the most commonly used attack detection techniques. Meta-heuristic algorithms can be used either to analyse attack database or to optimize and increase the accuracy of the classifiers. Therefore, these methods are reliable and suitable to detect attacks and anomalies. In this study, MLP was used to classify attacks and then Particle Swarm algorithm was employed to optimize and increase the accuracy of this classifier. Section 2 presents the literature review. Positioning of the proposed system in a network is determined in section 3. Section 4 explains the tools used in the proposed system. Structure of the proposed method is presented in section 5. In section 6, the proposed system is tested using KDD cup and NSL-KDD databases. Finally, section 7 presents our conclusions.
2-
Literature Review
Li et al (2012) proposed a neural network based IDS which was a distributed system with an adaptive architecture so as to make full use of the available resources without overloading any single machine in the cloud. In addition, with the machine learning ability from neural network, the proposed IDS can detect newer types of attacks with fairly accurate results. Evaluation of the proposed IDS with the KDD dataset on a physical cloud platform shows that it is a promising approach to detect attacks in cloud infrastructure. The method reached diagnostic accuracy of 99% for the KDD dataset [5]. Kannan et al (2012) introduced a new intrusion detection system using Genetic Algorithm for feature selection and Fuzzy Support Vector Machine for classification in a cloud environment. The method was tested for the KDDcup99
*CONTACT:[email protected]
DOI:http://dx.doi.org/10.28991/ijse-01120
database and the detection accuracy rate was increased while false alarms were decreased. This technique showed a detection accuracy rate of 98.51% [6]. Kumar and Pandeeswari (2015) developed an anomaly detection system at hypervisor layer named hypervisor detector to detect malicious activities in cloud environment. They concluded that a fuzzy-based intrusion detection system designed for target-based models will fail. So, they designed a successful adaptive method integrating fuzzy systems with specialized learning from neural networks named Adaptive Neural Fuzzy Inference System (ANFIS). This method showed dos attacks detection rates of 99.87%, 78.61%, 95.52%, 85.30%, and 92.82%, respectively, for probe attacks, R2L, U2R, and normal class in a cloud environment for the KDD database. The results indicated an improvement in attacks detection rate [7]. Singh et al. (2015) proposed an Online Sequential Extreme Learning Machine (OS-ELM) based method for intrusion detection. Their proposed method uses alpha profiling to reduce the time complexity while irrelevant features are discarded using consistency and correlations which reduce state space. Instead of sampling, beta profiling was used to reduce the size of the training dataset. The standard NSL-KDD dataset was used for performance evaluation of the proposed method. In this paper, space and time complexity was discussed that showed an improvement compared with the other methods. The experimental results yielded an accuracy rate of 98.66%, error rate of 1.74% and detection time of 2.43 seconds [8]. Das (2015) used two methods with gravitational search, and gravitational search plus PSO algorithms to train a neural network and compared them with other optimization algorithms such as PSO, Gradient Reduction Algorithm, Genetic Algorithm, and classification using decision tree. The tests conducted on the NSL-KDD dataset showed improved performance of the proposed method compared with the other techniques. The accuracy rates of 94.90% and 98.13% were obtained for network training using gravitational search algorithm and gravitational search plus PSO algorithms, respectively. It was also claimed that the proposed method is more suitable for unbalanced datasets [9].
Sharma et al.(2016)used artificial bee colony that is a team approach to detect and fight back DOS attacks in cloud environment. In this research, data were recalled from the network traffic, and after the bees were released, they were used to train the classifier and to test. Afterwards, attack was detected. Apparently, detection rate of artificial bee colon y was higher than QPSO. An attack detection rate of 72.4% was obtained for this method [10]. Dalmazo et al. (2016) proposed a fast feature extraction method to improve cloud abnormalities. In this method, a Support Vector Machine (SVM) was used for anomaly detection. The key solution to improve accuracy of SVM in cloud environment was to reduce the amount of data. In light of this, Poisson Moving Average predictor which is the core of the feature extraction approach. This method showed detection accuracy of 98.56 and reduced false alarms for the KDDcup DARPA dataset [11].
3-
Positioning of the Proposed System in a Cloud Network
The main objective of the present study was to develop a network intrusion detection system with a high detection rate, low computational complexity and fewer false alarms. As shown in Figure 1, there are external and internal clouds posing threats and risks to the network. In this scenario, the external cloud includes users connected to Internet who should bypass the firewall in order to access the internal cloud, which can be a private one. Here, a network-based intrusion detection system is connected to a router and captures the packets passing through the router and saves them in to a data base and then performs intrusion detection. Finally, the system sends intrusion incidents to the central server. For the internal cloud, interconnected NIDS sensors are installed on each server. If any of these NIDS sensors detects an intrusion, it will send a report to the incident capturing server. This server has a large storage space and is directly connected to the external attacks detection sensor. If its storage spaces occupied, the server can transfer data to the external attacks detection sensor. The incident capturing serveries important because it notifies the network manager or the cloud supervisor and different attack incidents can be used to further train the intrusion detection system and to adapt it tone attacks. Hence, all NIDS sensors send attack incidents to the server with a large storage space; and if necessary, this data will be used to train the proposed system.
4-
Multilayer Perceptron Neural Networks (MLP)
Figure 1. Positioning of the proposed attacks and intrusion detection system in a cloud network.
4-1- Neural Network Mechanism
Avoid hyphenation at the end of a line. Symbols denoting vectors and matrices should be indicated in bold type. Scalar variable names should normally be expressed using italics. Weights and measures should be expressed in SI units.
In this step, training set was used to generate the neural network initial structure. In the proposed model, MLP was used as the basic network. The necessary steps are explained respectively as follows:
Generation of Neural Network Initial Structure: The neural network used here had 12 inputs. In the hidden layer, the number of neurons varied depending on the inputs, number of samples and volume of input data. The number of neurons used for each sample is specified in the results section. However, for facilitating, 4 neurons were used in the hidden layer. Here, the number of classes waste same as outputs and since there were two normal and abnormal classes, there was one neuron in the output layer. Structure of a neuron in a neural network, and structure of the used neural network are displayed in Figures 2 and 3, respectively.
Figure 2. Structure of a neuron.
Figure 3. Structure of the used neural network.
Out put input
wi
b
⬚
Input Hidden layer
Output layer
12.Dst host diff srv rate
2.Src bytes 1.Service
3.Dst bytes
As shown in Figure 2, a neuron has a collector and an activation function. Tan-sigmoid activation function was used in the present study. Each neuron has a number of inputs and each input has some weights. The input values are multiplied by weights before being summed and then the activator function provides the output. This process is shown by Equation 1 and the activator function is shown by Equation 2.
𝑂𝑖 = 𝑔𝑖( 𝑥𝑖
𝑛
𝑖=1
𝑤𝑖 + 𝑏𝑖) (1)
𝑔𝑖(𝑥) = 𝑡𝑎𝑛ℎ(𝑥) =
𝑒𝑥− 𝑒−𝑥
𝑒𝑥− 𝑒−𝑥 (2)
Where, Oiis the output of neuron, giis the activator function, 𝑥i is the input to neuron, 𝑤iis the weight of each input and
𝑏iis the constant bias. All these factors make the output more precise. This bias facilitates the use of perceptron network. In the Equation 2, x is the input to the activator function, and hyperbolic tangent of x is its output. Figure 3 illustrates structure of the neural network used here. This neural network had12 inputs, 12 neurons in layer 1 and 3 neurons in layer 2. These two layers were components of the hidden layer. The output layer had one neuron because it had two components.
5-
Particle Swarm Optimization Algorithm (PSO)
This algorithm was inspired by movement of birds finding space and food. In this case, birds prefer to fly and travel in groups. In addition, if a bird spots food somewhere, it will swoop down. Therefore, both personal and group experiences inspired this method.
In this method, each particle remembers the position it was in where it had its best result at each step. The best results the best individual position of each particle. These informational particles exchange information with each other no matter where they. A d-dimensional search spaces assumed for each particle.
Particle’s motion depends on three factors:
Current position of the particle
The best position the particle has experienced so far(P best)
The best position the entire series of particles have experienced so far(G best)
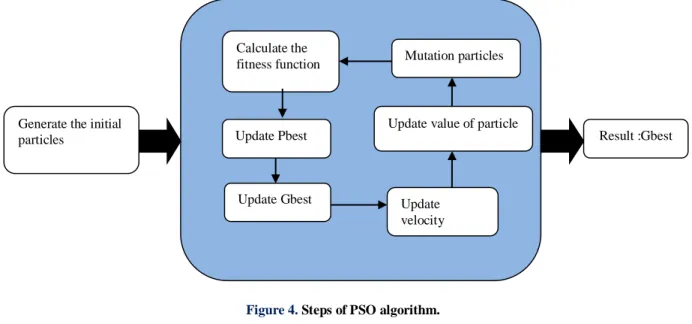
Figure 4 illustrates the simulation process:
Figure 4. Steps of PSO algorithm.
New position of each particle is obtained as follows:
present(t+1)=Present(t)+V(t+1) (3)
V(t+1)= V(t)× W+C1×Rand(0,1)× [Pbest(t)-Present(t)]+C2×Rand(0,1)× [Gbest(t)-Present(t)] (4) In the Equation 1, Present (t+1) calculates the next position of the particle, and Present (t) specifies the current position of the particle. V(t+1) is called velocity function and specifies the direction of the particle motion using Equation
Generate the initial
particles Result :Gbest
Calculate the fitness function
Update Pbest
Update Gbest Update
velocity
2. The Rand function generates random numbers in the specified interval. C1 and C2 are the effect constants, P resent (t) is position of each particle at the moment (t), and V(t) is the rate of changing location or the velocity of particle. C1 is a coefficient associated with the best position of each particle and C2 is a coefficient associated with the best position of neighborhoods that helps change the velocity of particle. These coefficients are usually equal to 2. W is a coefficient to change the previous velocity of particles. It is the velocity of the particle moving towards the previous direction. The larger w values will lead to most general search. In fact, as long as we have random initial velocity, it will lead to the basic minimum [13].
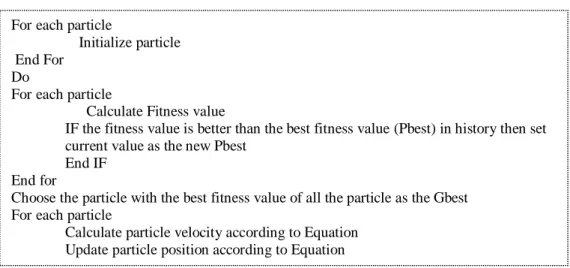
The pseudo code of this algorithm is shown in Figure 5:
Figure 5. Particle Swarm Optimization source code.
6-
Proposed Method
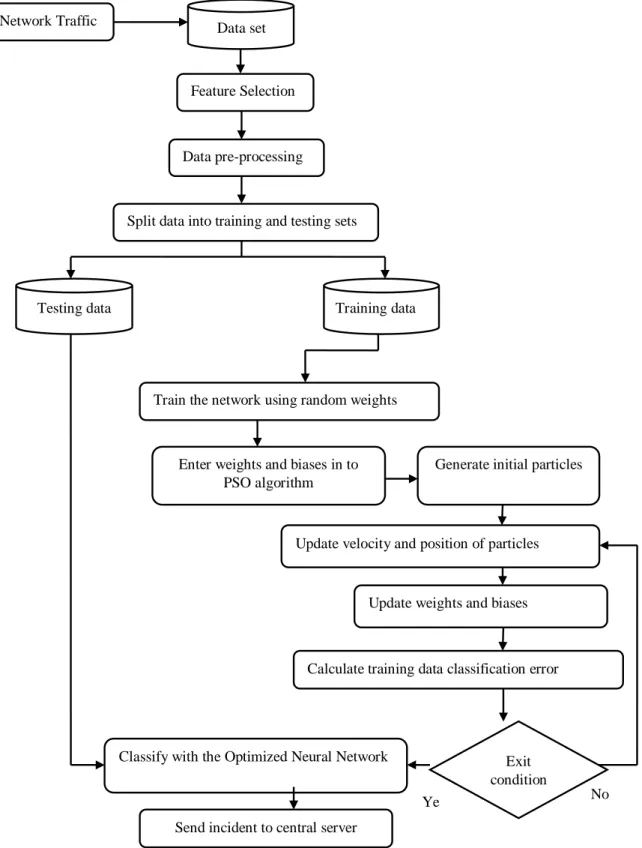
The proposed algorithm, displayed in Figure 6, contains different parts connected to one another to increase efficiency, precision and detection rates. We explain each part in separate sections. But briefly, in this structure first the transmitted packets are captured by a node in the network and then saved into a database. The following section explains feature selection methods to select proper features for intrusion detection. This section facilitates classification for training process. In the next step, selected data must be converted to numbers which can be detected by the neural network. In the following section, data is normalized between 0 and 1. Then, some of this normalized data are used for training the neural network and some others for testing the network. This data is selected randomly. The number of data varies for training and testing sets depending on the rate of precision of their variation in the experiments. In the next step, the optimal weights are extracted using PSO algorithm and the neural network is trained by training data and the obtained optimal weights. When the algorithm is run as many times as determined at the beginning (exit condition), classification is started. Data is divided into two classes: normal and abnormal. If data indicates an anomaly or intrusion, it is categorized in class 2 and otherwise, it belongs to class 1. We can consider different classes depending on the type of application. Different types of attacks are examined in the testing section in which various experiments are discussed. Finally, if there is an intrusion, the network manager or user will be given a proper signal or alarm.
6-1- Datasets
In this paper, KDDcup99 and NSL-KDD datasets were used. The KDDcup99 dataset is used to train and test the system because of its beneficial features in detecting the selected behaviors during feature selection. This database includes37 types of attack and 41 features. In the following section, the used attacks and features are separated. NSL-KDD database is the improved version of NSL-KDDcup99 in which the repetitive samples are eliminated and some new attacks are introduced. This dataset has been used in recent studies. The NSL-KDD version 2015 and KDD-CUP99 data bases were used in the present study [14, 15].
For each particle
Initialize particle End For
Do
For each particle
Calculate Fitness value
IF the fitness value is better than the best fitness value (Pbest) in history then set current value as the new Pbest
End IF End for
Choose the particle with the best fitness value of all the particle as the Gbest For each particle
Figure 6. Flowchart of the Proposed Model.
6-2- Feature Selection
Feature selection is the process of detecting irrelevant and redundant information and eliminating them as much as possible. It is a dimensional reduction process which allows the learning algorithms to act faster and more efficient. Therefore, it improves classification. In this study, a Kolmogorov-Smirnov correlation based filter was used to select a subclass of useful features in intrusion detection. According to this method, the features highly correlated with the class, but not with one another, were the best features. In this method, a fast redundancy removal filter based on modified Kolmogorov-Smirnov correlation (KS-CBF) was used to select features using class information labels while comparing the two features. 12 most proper features for intrusion detection were selected [16, 17].
Data set Network Traffic
Feature Selection
Data pre-processing
Split data into training and testing sets
Testing data Training data
Train the network using random weights
Calculate training data classification error
Ye s Classify with the Optimized Neural Network
Send incident to central server Enter weights and biases in to
PSO algorithm
Generate initial particles
No Exit
These features are listed below:
1- Service: network services at the target.
2- SRC_bytes: the number of bytes to move from source to target.
3- Dst_bytes: the number of bytes to move from target to source.
4- Logged_in: if they are successfully logged in, they are given 1 and are 0otherwise.
5- Count: the number of all connections with the same host as the connection present in the past two sections.
6- Srv_count: the number of connections to similar services as the link existed in the past two seconds.
7- Serror_rate: the percentage of connections with the “SYN” error.
8- Srv_rerror_rate: the percentage of connections with the “REG” error.
9- Srv_diff_host_rate: the percentage of connections to similar hosts.
10-Dst_host_count: the number of connections to similar hosts.
11-Dst_host_srv_count: a series of connections to the similar target port.
12-Dst_host_diff_srv_rate: the percentage of connections in various services, among the connections collected in Dst_host_count.
6-3- Data Preprocessing
Preprocessing includes two operations: data conversion (encoding) and normalization. In the data conversion (encoding) step, when the value of some features is not detectable for the neural network, they must be converted to the features with detectable values for the proposed system. This operation is called encoding. For instance, the service-type feature is non-numeric and includes http, smtp, ecr-I and etc. Thus, in order to convert these values, numeric equivalences are assigned; for example, http=1, smtp=2, ecr-i=3, etc. Then, these new values are replaced with the non-numeric ones.
6-4- Normalization
In this paper, the minimum and maximum normalization method was used. In fact, normalization puts the data in an interval, between 0 and 1 or -1 and 1. This reduces the input data, increases velocity and facilitates data analysis. Equations 5 and 6 are used for the normalization interval between 0 and 1, and -1 and 1, respectively.
𝑉́ = ((𝑉 − 𝑚𝑖𝑛 𝐴) /(𝑚𝑎𝑥 𝐴 − 𝑚𝑖𝑛 𝐴)) (5)
𝑉́ = ((𝑉 − 𝑚𝑖𝑛 𝐴) /(𝑚𝑎𝑥 𝐴 − 𝑚𝑖𝑛 𝐴)) × 2 − 1 (6)
Where, maxA is the maximum value of the observed feature; minA is the minimum value of the observed feature; V is the value of feature before normalization; V́ is the value of the normalized feature.
6-5- Training and Testing Datasets
Training and testing datasets can be randomly separated but K-fold cross validation is one of the best separation methods. In this method, K is equal to 10 and data is divided into 10 equal parts and each time one of them is selected as the testing data and the rest of them are selected as the training data. Ultimately, we calculate the mean of precisions of the operations.
6-6- Extracting Optimal Bias and Weights for Neural Network Training
At first, we divide the input data into two groups, test and train and then, the training process starts for the data in the train group. The process of training begins by training the network with random weights and the PSO method is used to improve it. At first, some values are given to the initial population based on the number of weights of the neural network (b, iw and lw weights). When the optimal weights are obtained, they are replaced with the previous b, iw and lw
weights. iw is in fact the weight of the first layer, i.e. the input layer. lw is the weight of the middle or hidden layers. b
PSO algorithm is repeated a few number of times. If all of PSO algorithm repetitions are done, it will exit. Exit condition occurs when gbest is obtained which is the best general situation. In other cases, the number of repetitions can be limited
and be considered as the exit condition. The best weights and biases have been offered by the PSO algorithm and if repetition is still needed, PSO algorithm is started again. In addition, the values of iw, lw and b matrixes are set, which is
one of the most significant stages of the neural network optimization. This process has been explained as follows:
1- Training neural network through random weights and by determining the total number of weights and biases for the initialization of PSO variables.
2- Insertion of low and high levels of weights vector between -1 and 1.
3- Random initialization of weights and biases which are obtained from training with random weights in the first step. 4- Calculating the error of classification in each step and optimizing weights and biases in each repetition of the
algorithm by considering the error of classification or categorization. At each step, particles move towards gbest
which has a lower rate of classification error.
5- Upgrading values of weights and biases which mean replacing weights of previous stage with the optimal weights. 6- If gbest is achieved or the number of limited repetitions provides an exit condition, the neural network is trained
with these optimal weights and it is tested with test data. Thus, it shows the percentage of precision of classification. However, the alarm goes off in a practical environment if an attack is detected.
6-7- Classification with Optimized Neural Network
At this stage, classification is prepared based on test and train data. Data is divided into two groups and the function of the proposed model must be evaluated and for this purpose, optimal biases and extracted weights are used from the training stage in the neural network configuration. Then, the outputs of the network achieved and finally the Minimum Square Errors (MSEs) of the train and test, classification rate, train and test classification rate, confusion matrix associated with train and the one associated with the test are calculated based on the outputs. This process is repeated for all classes and ultimately, the mean error of all classes is considered as the total error of the proposed method. In the following section, these classifications are done for all attacks to see the parameters for each attack in particular.
6-8- Attack or Intrusion Event in the Central Server
If an attack occurs, alarms can be displayed in different forms to the user or the network manager. For example, a massage on the screen, an error massage, an alarm beep, an e-massage on the mobile or email; and an action can be adopted appropriate to the alarm. For instance, after detecting an intrusion, all ports are closed, firewalls are readjusted or a honey pot is used. Based on the used environment, operations appropriate to the attack are selected. In this paper, in the case of attack occurrence and detection of the event, specifications related to the attack are sent to the central server in order that either the suitable reaction policy to be decided and or the saved data to be used for training the neural network.
7-
Experimental Results
Since effectiveness of a system is only determined by evaluation of that method, this section of the article aims to express the obtained results briefly in order to analyze and investigate the proposed model. For this purpose, the proposed model has been run in MATLAB environment and then, evaluation criteria is given, which will be introduced in the next section and then the model is evaluated again. In this section, the empirical results are obtained by using an integration of artificial neural networks and particle swarm algorithm for intrusions detection based on NSL-KDD version 2015 and KDDcup99 databases as well.
7-1- Evaluation of the Function of the Proposed Model
7-2- Results on Datasets for 2 Normal and Anomaly Classes
In this section, we perform experiments on three classes which were randomly selected from the KDDcup99 database. The first class includes 297 samples for test and 800 samples for train. There have been 15 neurons in the hidden layer for test this class and a population of 227 members are selected to test the proposed method. The second class has 250 samples for train and 750 samples for test. In this research, 13 neurons have been used in the hidden layer for the normal method and 13 neurons in the hidden layers and a 130 population member. In the third class, there were
250 samples for test, 2250 samples for train, 15 neurons in the hidden layer for the normal method and 15 neurons for the abnormal method with a population of 227 members. Obtained result of these three classes for normal and anomaly classes is shown in Table 1. These results prove that the proposed method is more accurate within testing and training data compared to neural network and our criterion for evaluation of precision rate of the anomaly or intrusion detection system is the preciseness of the test data. The mean of precision rate of each of these two methods is shown in the table as well. Classification rate or the percentage of classification accuracy is also displayed in the table. In the following section, the confusion matrix associated with the test data of the proposed method for each class is presented in table 2. The information presented in these tables depicts how many of the samples have been classified incorrectly.
Table 1. Obtained results from the three classes by the proposed model and the perceptron neural network.
Category Number of
test data Number of training
data Classification rate of
test data Classification rate of
training data Models 1 297 800 99.66 99.37 ANN 297 800 100 99.87 PSO-ANN 2 250 750 98 100 ANN 250 750 98.80 100 PSO-ANN 3 2250 250 96 99.89 ANN 2550 250 99.20 99.77 PSO-ANN 97.88 99.75
Mean for ANN method
99.66 99.88
Mean for proposed method
As it can be seen in Table 1, classification rate is more accurate by optimized method which leads to the reduction of false alarms sent by the intrusion detection system.
Table 2. Confusion Matrix associated with test data in proposed method on Category 1 to 3.
As it can be understood from these tables, the specified class must be labeled correctly. The TN criterion shows how many samples are classified accurately. For example, samples which are normal and are classified in the normal class. On the contrary, the FN criterion shows how many of the samples are classified inaccurately. For example, sample which are normal but are classified in the anomaly class. In fact, in this matrix, the higher the number of the elements on the basic diameter of a matrix is, the more precise the classification will be. Likewise, the TP criterion shows the accurate classification for the next class, i.e. anomaly class and FT shows the number of inaccurate classification for the anomaly class, which is equal to two here. This means that two samples are wrongly placed in the normal class while they belong to the anomaly class.
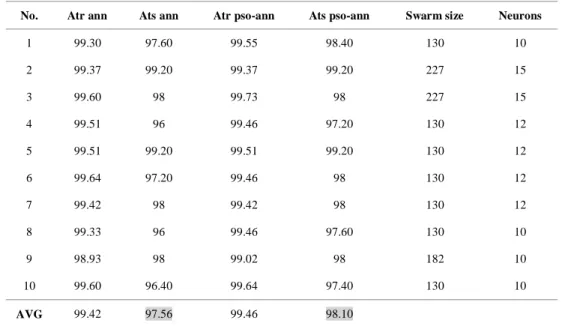
7-3- Experimental Results for Probe, U2R, R2L and DOS Attacks
In this section, the 10-Fold cross validation method is used to evaluate the proposed method i.e. 10 samples is selected randomly from the NSL-KDD2015 dataset with the size of 250. A single experiment for each attack and normal class (probe, U2R, R2L and DOS) is performed. For normal class, the number of used neurons is shown but there were
15 neurons in the hidden layer for the other classes. Also, 250 samples have been used for test the neural network and
2250 samples for train. The columns of the table can be explained as follows:
Atr ann = precision rate of train data with the MLPANN.
Ats ann = precision rate of test data with the MLPANN.
Atr pso-ann = precision rate of train data with the proposed method.
Ats pso-ann = precision rate of test data with the proposed method. Swarm size = size of the initial population for the proposed method.
Neurons = the number of neurons used in the hidden layer.
Table 3. Comparing other approaches and the proposed method.
Neurons Swarm size Ats pso-ann Atr pso-ann Ats ann Atr ann No. 10 130 98.40 99.55 97.60 99.30 1 15 227 99.20 99.37 99.20 99.37 2 15 227 98 99.73 98 99.60 3 12 130 97.20 99.46 96 99.51 4 12 130 99.20 99.51 99.20 99.51 5 12 130 98 99.46 97.20 99.64 6 12 130 98 99.42 98 99.42 7 10 130 97.60 99.46 96 99.33 8 10 182 98 99.02 98 98.93 9 10 130 97.40 99.64 96.40 99.60 10 98.10 99.46 97.56 99.42 AVG
In Table 3, swarm size shows the number of population related to the PSO algorithm. The next column presents the number of neurons in the hidden layer. In the final row, the mean of all K’s of the sample has been calculated and K has been evaluated through using the K-fold method. Obtained results show that the proposed method is averagely more precise than the normal neural network when k=10. all experiments is done similarly for other attacks, such as probe, U2R, R2L and DOS and their results are presented in Table 4.
7-4- Evaluation of the Proposed Model
In Table 4, the results obtained from the proposed model are compared with the other five methods. As it is seen, the proposed model ANN-PSO is more precise than the others when it comes to detecting intrusions. The method proposed for each of the attacks and the normal class has been compared with that of the others. It can be deducted that the PSO algorithm has been able to improve the function of the neural network by finding the best weights and biases. In Figure
1, different models have been compared with one another in terms of their function.
Table 4. Comparing other approaches and the proposed method.
used dataset Mean accuracy percentage
Attack Classes method
KDDcup99 99.66
Normal & abnormal proposed method KDDcup99 99.33 AVG proposed method NSL-KDD 98.10
Normal & abnormal proposed method
NSL-KDD 97.12
NSL-KDD 97.68 Probe proposed method NSL-KDD 97.88 R2L proposed method NSL-KDD 99.64 U2R proposed method KDDcup99 99 AVG [5] KDDcup99 98.51 AVG [6] KDDcup99 99.87 DOS [7] KDDcup99 78.61 probe [7] KDDcup99 95.52 R2L [7] KDDcup99 85.30 U2R [7] KDDcup99 92.82
Normal & abnormal [7] NSL-KDD 97.71 AVG [8] NSL-KDD 95.26 AVG [9] KDDcup99 72.40 AVG [10] KDDcup99 98.56 AVG [11]
As it is seen in Table 4, the proposed method has been more functional than the others. AVG in this table shows the mean of class of all attacks. The results of the proposed method are better both in terms of the mean of the classes and the class of attacks.
The information presented in Figures 7 and 6 depicts the functionality of the proposed model in NSL and KDD data bases. The numbers in the columns show the rate of precision and the method.
Figure 7. Comparison of the proposed model with other models for the KDD dataset
In Figure 6, the function of the proposed model is compared with other methods. This graph shows the rate of precision in a column. These experiments have all been done with KDDcup99 database. The numbers above in each column shows the rate of precision associated with each method. As we can see in Figure 7, the rates of precision of the proposed method in detecting the intrusion have been compared with other methods. These experiments have been performed on the NSL-KDD database and it is seen that the proposed method has had been better at detection, precision-wise, than the other methods.
99.44 99 98.51
90.42 72.4 98.56 50 55 60 65 70 75 80 85 90 95 100
Methods used by KDDcup99
proposed method [5] [6] [7] [10] [11]
Figure 8. Comparing the function of the proposed model with the other models for the NSL database.
8-
Conclusion
Initially, a scenario related to cloud computations and its risks was indicated and the position of the intrusion detection system was specified for internal and external attacks in order to have the most efficiency and security. In the proposed model, it is attempted to promote the rate of precision to detect different kinds of attacks. The results obtained from integrating the neural network with the Particle Swarm algorithm have been presented in this article. The proposed model is evaluated with KDDcup99 and NSL-KDD databases. In these databases, the neutral network was optimized using an integration of the neural network with the Particle Swarm algorithm to extract the optimal weights. The proposed method has better outcomes than the simple neural network. Also, it is tried to reduce the time complexities by training the neural network with random weights and if the PSO optimizer is not able to improve the preciseness of the system, it will be stopped. Many articles are used different methods to present the results and some of them do their experiments on multiple groups with different numbers of samples for train and test. Ultimately, they consider the mean or the best outcome as the input. Some researchers use a percentage of the database. For example, they do the experiments with 20 percent of the sample and some of them used K-fold method. However, in this article, it was attempted to make the experiments fair and precise. That is why we have used the K-fold method and selected a random group for analysing the results. Finally, the results of the research showed a substantial improvement in the function of the system, in terms of the precision of detecting attacks faced by the networks and reduction of time complexities.
9-
References
[1] S. J. Stolfo ,M.B. Salem ,A.D. Keromytis, “Fog computing: Mitigating insider data theft attacks in the cloud,”, IEEE Symposium on Security and Privacy Workshops (SPW), vol. 00, no. 1, pp. 125-128, 2012.
[2] C. Wang, , Q. Wang, K. Ren, W. Lou, ” Privacy-preserving public auditing for data storage security in cloud computing,”, Proceedings IEEE INFOCOM, pp. 1–9, 2010.
[3] B.R. Kandukuri, R.V. Paturi, A. Rakshit, “Cloud security issues,”, IEEE International Conference on Services Computing, Bangalore, pp. 21–25, September 2009.
[4] http://www.lockheedmartin.com/content/dam/lockheed/data/corporate/documents/Getting-Secure-in-the-Cloud.pdf
[5] L. Zhe, S. Weiqing, W. Lingfeng, “A NEURAL NETWORK BASED DISTRIBUTED INTRUSION DETECTION SYSTEM ON CLOUD PLATFORM”, International Conference (CCIS),vol. 2, 2012.
[6]K. Anand,Q. Gerald, Jr. Maguire, S. Ayush, P. Schoo, “Genetic Algorithm based Feature Selection Algorithm for Effective Intrusion Detection in Cloud Networks,”, International Conference on Data Mining Workshop, vol. 12, 2012.
[7] P. Ganeshkumar, N. Pandeeswari, “Adaptive Nauru-Fuzzy-Based Anomaly Detection System in Cloud”, Int. J. Fuzzy Syst, vol. 18 , pp. 367–378, 2015.
[8] S. Raman,K. Harish,R. K. Singlac, “An intrusion detection system using network traffic profiling and online sequential extreme learning machine,”, Expert Systems With Applications, vol.42, pp. 8609-8624, 2015.
[9] D. Tirtharaj, “A study on intrusion detection using neural networks trained with evolutionary algorithms,”, journal of soft computing, vol. 20, pp. 1-14, 2015.
98.08
97.71
95.26
90 91 92 93 94 95 96 97 98 99 100
Methods used by NSL-KDD
proposed method [8] [9]
A
c
c
u
r
ac
[10] S. Shalki, G. Anshul, A. Sanjay, ”An Intrusion Detection System for Detecting Denial-of-Service Attack in Cloud Using Artificial Bee Colony,”, Proceedings of the International Congress on Information and Communication Technology: Advances in Intelligent Systems and Computing, vol. 438, 2016.
[11] L. B. Dalmazo, P. V. Joao, S. Paulo, C. Marilia, “Expedite Feature Extraction for Enhanced Cloud Anomaly Detection,”, DISSECT, vol. 2, 2016.
[12] V. K. Asari,“Training of a Feed forward Multiple-valued Neural Networks by Error Back-propagation with a Multilevel Threshold Function,”, IEEE Transactions on Neural Networks, vol. 12(6), pp. 1512-1521, 2011.
[13] Z .Liu,X. Wang “A PSO-Based Algorithm for Load Balancing in Virtual Machines of Cloud Computing Environment,”, Advances in Swarm Intelligence, pp. 142-147, 2012.
[14] Dataset of kddcup99. 2007: http://kdd.ics.uci.edu/databases/kddcup99/corrected.gz [Accessed 16-May-2000].
[15] Dataset of NSL-KDD University of new Brunswick. Available from: http://www.unb.ca/research/iscx/dataset/iscx-NSL-KDD-dataset.html [Accessed September 2016].
[16] K. Subrahmanyam, N. S. Sankar, S. P. Baggam, R. S. Raghavendra ,” A Modified KS-test for Feature Selection,”, IOSR Journal of Computer Engineering (IOSR-JCE), 73-79, 2013.