Calhoun: The NPS Institutional Archive
Theses and Dissertations Thesis Collection
1993-03
A new branch-and-bound procedure for computing
optimal search paths
Martins, Gustavo H. A.
Monterey, California. Naval Postgraduate School http://hdl.handle.net/10945/39870
AD-A277 300
NAVAL POSTGRADUATE SCHOOL
Monterey, California
DTIC
FECTE
MAR
2 51
9 9 4THESIS
HEAT TRANSFER STUDIES ON A RECTANGULAR CHANNEL WITH OFFSET PLATE FINS
by
Jeffrey M. Masterson December, 1993
Thesis Advisor. Y.K. Joshi Approved for public release; distribution is unlimited.
REPORT DOCUMENTATION PAGE
Fom Appoved OMB No. 0704Public rmoWSq bsdm for dtis colleic t ioo'mmatm ics esiad to ap I bom w p merlkc. huhat the fa icr mvawig bunakm.
swucbing OXMsm do& s .a gaibmug msunawaniw t die do& neb md y1'doun mad muwiag fth co~cliumatc wuuarmom. Snd somu
rsgdwg dais b. ard esom orany adaw sapm at ths colbatam of btnaucmsaa nckidiag .iggmim for refthig ths buxdw. to Wadahiam
Headquas Scvic. Dima for afcmmum Opwm and Repa. 1215 isffmaw Dvi H10jw. Suat 120k AMr6m VA =W.4=. md
t the Offimof maagenm and Budgek. Pqark Rebacm Projea (0704.018) Wadnaw DC 25O3.
1. AGENCY USE ONLY (Leave blank) 2. REPORT DATE 3. REPORT TYPE AND DATES COVERED
December 1993 Master's Thesis
4. TITLE AND SUBTITLE HEAT TRANSFER STUDIES ON A 5. FUNDING NUMBERS
RECTANGULAR CHANNEL WITH OFFSET PLATE FINS 6. AUTHOR(S) Jefr~ey M~. Masterson__________
7. PERFORMING ORGANIZATION NAME(S) AND ADDRESS(ES) 8. PERFORMING
Naval Postgraduate School ORGANIZATION
Monterey CA 93943-5000 REPORT NUMBER
9. SPONSORING/MONITORING AGENCY NAME(S) AND ADDRESS(ES) 10. SPONSORING/MONITORING AGENCY REPORT NUMBER
11. SUPPLEMENTARY NOTES The views expressed in this thesis are those of the author and do not
reflect the official policy or position of the Department of Defense or the U.S. Government.
12a. DISTRIBUTION/AVAILABIL1TY STATEMENT 12b. DISTRIBUTION CODE
Approved for public release; distribution is unlimited. A
13. ABSTRACT (maximum 200 words)
Convective heat transfer characteristics of a liquid cooled rectangular channel, containing offset plate fins were investigated experimentally. The selected geometry was a lOx model of the fluid circulation passages in the commercially available SEM-E type electronic cooling modules. The test surface containing fins was made of aluminum and was heated at its base by a thermofoil heater. The Reynolds numbers were varied between 100-800, with water as the cooling fluid. Surface temperature measurements on the heated surface were used to determine the Colbum j factor. The effects of natural convection were also investigated.
14. SUBJECT TERMS Offset Plate Fins 15. NUMBER OF
PAGES 49 16. PRICE CODE
17. SECURITY CLASSIFI- 18. SECURITY CLASSIFI- 19. SECURrIY CLASSIFI- 20. LIMITATION OF
CATION OF REPORT CATION OF THIS PAGE CATION OF ABSTRACT ABSTRACT
Unclassified Unclassified Unclassified UL
NSN -/.*4"1O-2.80-350 •stau.xar= F.,ornm 29Key. 2-59)
Approved for public release; distribution is unlimited. HEAT TRANSFER STUDIES ON A RECTANGULAR
CHANNEL WITH OFFSET PLATE FINS
by
Jeffrey M. Masterson Lieutenant, United States Navy BS., United States Naval Academy, 1986
Submitted in partial fulfillment of the requirements for the degree of
MASTER OF SCIENCE IN MECHANICAL ENGINEERING from the
NAVAL POSTGRADUATE SCHOOL December 1993
Author.
Jeffrey M. Masterson
Approved by:
4
Y.K. Josh!, Thesis Advisor
6Matthew D. Kelleher, Chairman Department of Mechanical Engineering
ABSTRACT
Convective heat transfer characteristics of a liquid cooled rectangular channel, containing offset plate fins were investigated experimentally. The selected geometry was a 10x model of the fluid circulation passages found in the commercially available SEM-E type electronics cooling module. The test surface containing fins was made of aluminum and heated at its base by a thermofoil heater. The Reynolds numbers were varied between 100-800, with water as the cooling fluid. Surface temperature measurements on the heated surface were used to determine the Colburn j factor. The effects of natural convection were also investigated.
Accesion For NTIS CRA&I DTIC TAB Unannounced Justification ... By ... ..---Distribution I Availability Codes Avail and or Dist Special iii
TABLE OF CONTENTS
I. INTRODUCTION ... 1
A. ELECTRONIC COOLING ... ... 1
1. Offset Plate Fins ... ... 1
2. Offset Plate Fin Heat Exchangers .... ... 2
B. PREVIOUS RESEARCH ON OFFSET PLATE FIN HEAT EXCHANGERS ... 3
1. Air Cooled Modules ... ... 3
2. Liquid Cooled Modules ... ... 4
C. OBJECTIVES OF PRESENT STUDY ... ... 4
II. EXPERIMENTAL APPARATUS ... ... 9
A. SUPPORT SYSTEM ASSEMBLY .M ... 9
1. Fluid Circulation System ... ... 9
2. Power Distribution System ... ... .. 10
3. Differential Pressure Measurement . . . .. 10
4. Data Acquisition System ... .. 11
B.- TEST SECTION ASSEMBLY... . 11
1. Fins and Base ... ... .. 11
2. Plexiglass Cover ... ... . 13
3. Inlets and Outlets ... 13
4. Pressure Taps ... 13
6. Final Assembly ... ... 14
7. Test Section Instrumentation .... 14
C. EXPERIMENTAL PROCEDURE ... ... .. 15
III. RESULTS ... ... .. 22
A. DATA ANALYSIS ... ... .. 22
B. HEAT TRANSFER RESULTS ... ... .. 24
1. Horizontal Test Section ... ... .. 25
2. Inclined Test Section ... ... .. 27
C. Time Dependent Temperature Variation . . . . . 27
D. PRESSURE DROP RESULTS ... 28
IV. CONCLUSIONS ... ... .. 30
V. RECOMMENDATIONS ... 32
APPENDIX A ... 33
1. Reynolds Number Uncertainty ... .. 33
2. Colburn j Factor Uncertainty ... ... .. 34
APPENDIX B ... . ... ... 36
1. Characteristic Dimension .... ... .. 36
2. Water Properties [Ref. 5, p. A22] . . . .. 36
3. Reynolds Number ... ... 36
4. Nusselt Number. . ... 36
5. Colburn j Factor ... ... 36
LIST OF REFERENCES ... ... 37
LIST OF FIGURES
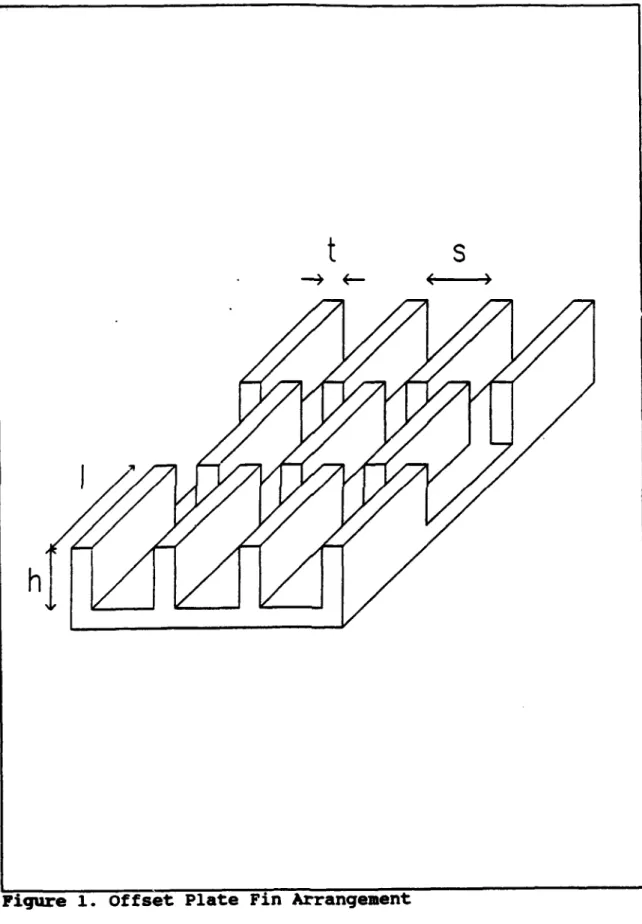
Figure 1. Offset Plate Fin Arrangement ... ... 6
Figure 2. Offset Plate Fin Heat Exchanger Design ... ... 7
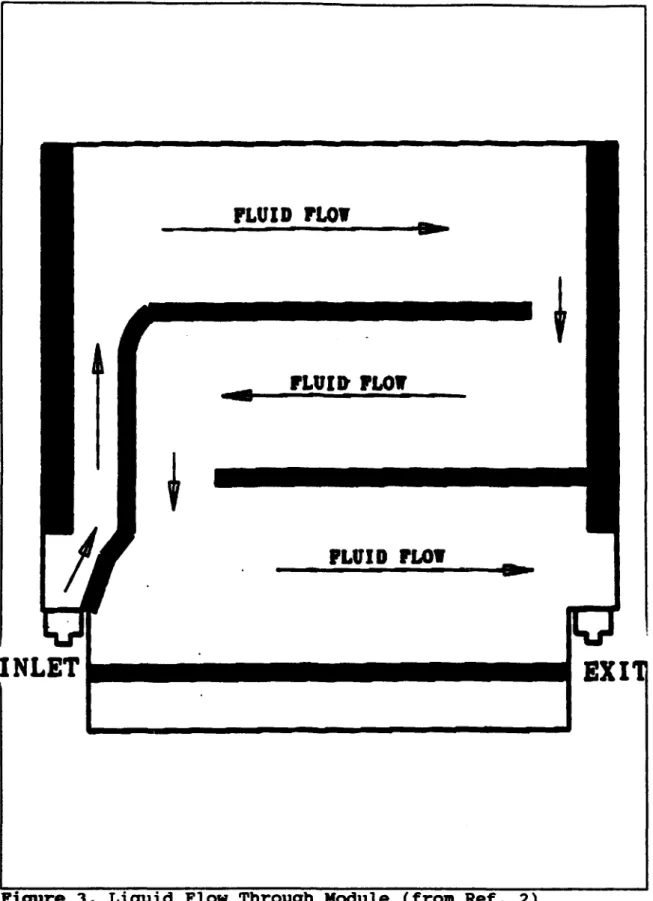
Figure 3. Liquid Flow Through Module ... ... 8
Figure 4. Overall Schematic of Experimental Apparatus . ... 17
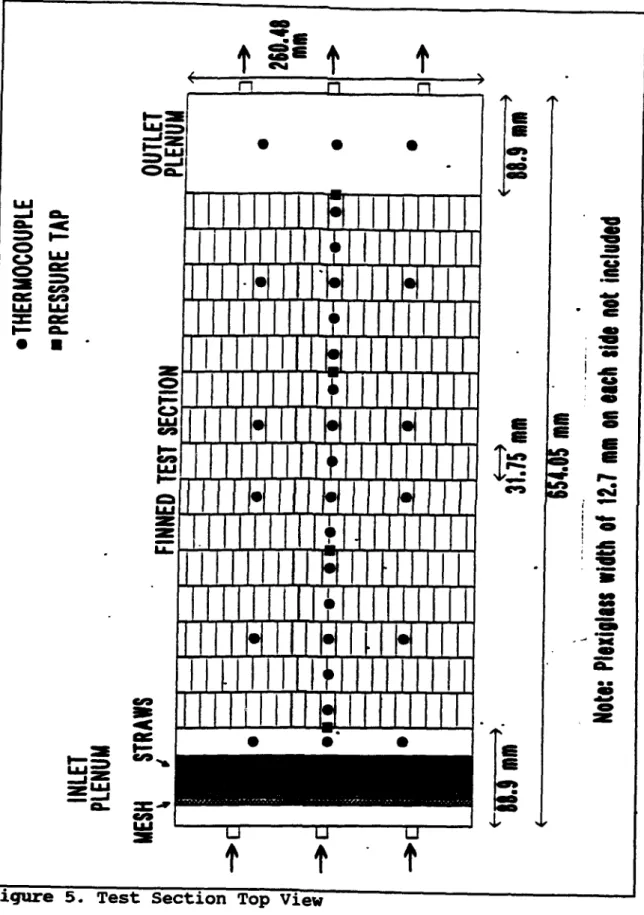
Figure 5. Test Section Top View. ... . 18
Figure 6. Test Section Fin Dimensions ... ... .. 19
Figure 7. Finned Section Design ... ... .. 20
Figure 8. Completed Test Section ... 21
Figure 9. Re vs j for Test Section ... ... .. 29
NOKENtLATURE
A. -channel free flow area (179.2 mm2)
At -total test section free flow area (3506 mm2)
Ah -test section heated area (0.1116 m2)
A/l -heat transfer area per unit fin length (0.04370 mm)
Db -hydraulic diameter (0.01641 m) f -Fanning friction factor
h -fin height (15.24 mm)
Ih -heater current (A)
j
-Colburn j factork, -fluid thermal conductivity (W/m-K) 1 -fin length (31.75 mm)
Nu -Nusselt number Pwr -heater power (W) Pr -Prandtl number
qf -heat flux. (W/m2)
Q -volumetric flow rate (m3/s)
Re -Reynolds number
s -fin spacing (11.76 mm) t -fin thickness (1.52 mm)
TA, -average test section temperature (K)
TIN -test section inlet temperature (K)
Tm -fluid property determination temperature (K) v -mean fluid velocity (m/s)
V, -heater voltage (V)
VPX -precision resistor voltage (V) p -fluid density (kg/m3)
A -fluid viscosity (m2/s)
AC3NOWLEDGKZNT
To those who helped contribute to the success and completion of this tbes's.
Professor Joshi, who always found time to help, even under the difficult circumstances we were faced with.
Jim Scholfield, whose technical expertise and vast stockpile of equipment got me over more hurdles than could have been
foreseen.
Charles Crow and Jim Selby, whose outstanding model making skills provided me with the first test section of this kind produced.
My wife, LuAnn, who gladly took care of my daughters, Samantha and MacKenzie, and provided unyielding support, so I could spend the hours necessary in the lab.
Captain George Pointon and Lieutenant Bob Clark who took time from their studies to help during calibration and testing when two hands were not enough.
I. INTRODUCTION
A. ELECTRONIC COOLING
With the advent of the transistor, designers have been faced with increasingly difficult challenges in the area of electronic cooling. Component miniaturization has progressed faster than reductions in electronic power generation. For reliable operation, the chip junction temperature typically must remain below 85°C. This requirement forces designers to use more aggressive methods of heat removal as chip power densities increase.
Many options are being investigated to provide increased heat removal capability, including conduction cooling and direct immersion cooling. This study focuses on flow through liquid cooling in offset plate fin heat exchangers.
1. Offset Plate Fins
Offset plate fins have been used in heat exchange equipment for many years. Their large surface area to volume ratio leads to increased heat transfer. This enhancement comes from the periodic interruption of the thermal boundary layer as the flow passes over the fins. The increase in heat transfer, however, is accompanied by an increase in pressure drop due to the friction and form drag of the fins.
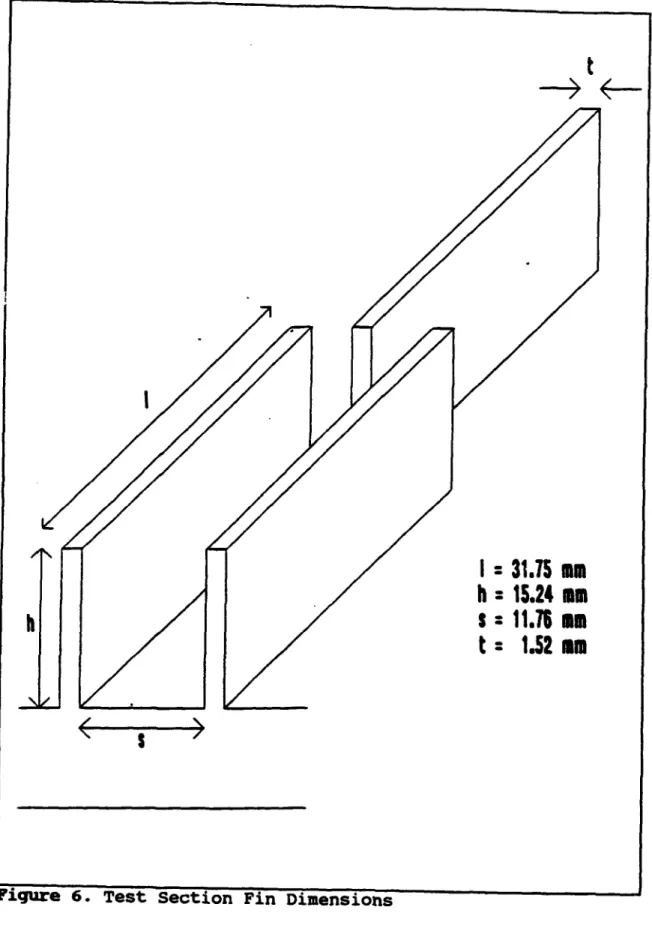
A typical offset plate fin arrangement is shown in Figure 1. The fins are characterized by their length (1), height (h), thickness (t), and spacing (s). The offset is normally half the fin spacing which places them in the center of the channel formed by the previous row. The fin geometry is expected to have an effect on the heat transfer performance and the pressure drop of the offset plate fins. The exact relationship has not been determined but is currently being researched [Ref. 1].
The complex flow path around the fins has prevented the development of good predictive models or generalized correlations. This has forced researchers to use empirical data as the basis for their heat exchanger designs.
2. Offset Plate Fin Heat Exchangers
The typical design of the offset plate fin heat exchanger is shown in Figure 2. It consists of fabricated aluminum strip fins brazed in between aluminum plates. The
fins are characterized by the same dimensions as the offset plate fins in Figure 1 with the only difference being the lateral ridge created during manufacturing. This loss of area must be taken into account for calculation of the hydraulic diameter, Dh.
One specific offset plate fin heat exchanger that is becoming widely used in electronics thermal control applications is the SEM-E (Standard Electronic Module, Format
E). This is a standard military board that uses the typical design discussed above and shown in figure 2. A complete description of the SEH-E is contained in Ref. 1.
A rough sketch of a SEM-E is shown in Figure 3 (from Ref. 2]. Three passes are used to enhance the heat transfer through the core. The offset fins are only installed in the horizontal runs to prevent impeding the flow from pass to pass.
B. PREVIOUS RESEARCH ON OFFSET PLATE FIN HEAT EXCHANGERS
1. Air Cooled Modules
Offset plate finned surfaces using air have been studied since the 1940's. One of the most comprehensive compilations of available data is by Manglik and Bergles [Ref. 3]. It includes an annotated bibliography of previous research and summarizes existing empirical correlations. Using the data previously gathered and correlating it is probably the most realistic method to predict the performance of untested offset plate fin heat exchangers [Ref. 4]. Manglik and Bergles used this technique to correct previous data for consistency and developed improved correlations for the Colburn j factor and the Fanning friction factor, f.
Their work is assumed applicable for Prandtl numbers in the range of 0.5 to 15 so the correlations could be applied when using water in normal temperature ranges. However, the correlations would not be valid using a heat transfer oil with
a Prandtl number in the range of 40 to 100. The effects of these high Prandtl number coolants on the heat transfer performance of offset plate finned heat exchangers is as yet largely unknown.
2. Liquid Cooled Modules
The low heat transfer coefficients and heat capcrities of air restrict it's use to relatively low power densities in electronics cooling. For higher power use, one option is flow through liquid cooling. Relatively little research has been done in this area. There is an experimental program under way at the CALCE Electronics Packaging Research Center at the University of Maryland to begin quantifying the effects of using high Prandtl number liquids as the coolant [Ref. 1].
Their study involves using water and PAO (polyalfaolef in, a synthetic oil) as the coolant through a variety of fin geometries. The key result of their effort so far has been to establish the clear Prandtl number dependence on the Colburn j factor. This factor can be increased without a significa'- companying increase in the Fanning friction factor by usliag high Prandtl number fluids. This result
invalidates the theory that the correlations previously mentioned for air could be applied to liquid cooled modules. C. OBJECTIVES OF PRESENT STUDY
This study experimentally investigated the capacity for heat removal of a scaled up model of the SEM-E using water as
a coolant. By varying the flow rate through the fins and the power input, j was determined over the range of interest. Specific objectives were:
- To determine the variation of Colburn j factor with Reynolds number.
- To determine the effects of natural convection on the Colburn j factor.
- To detect the presence of temperature variations in individual rows of fins.
t
S
Figu~re 2. f f set plate
'Fn''a ~ ne e
m r' e
FLUID FLOW
FLUID FLOW
FLUID FLOW
INLET
EXI
II. EXPERIMENTAL APPARATUS
The experimental system consisted of the test section and the support system. A schematic of the entire system is shown in Figure 4. Descriptions of the sub systems and their components is provided next.
A. SUPPORT SYSTE ASSUIBLY
1. Fluid Circulation System
An Endocal RTE-5 refrigerated circulating bath provided the constant temperature fluid surge volume to the inlet of the pump. The pumping power was provided by a Cole-Parmer positive displacement gear type pump driven by a variable speed motor producing Reynolds numbers in the range of interest (100 to 800). An Omega FTB-102 turbine flow meter and signal conditioner were used to measure fluid flow rates. The flow meter was calibrated by comparing the voltage output to quantities of water collected over specified times. The maximum uncertainty in measured flow rate was 0.5%.
Following the flow meter, the fluid temperature was measured using an Omega T-type thermocouple probe in the inlet tubing. The probe fed into the center of the tube through a
T-fitting. A manifold was used to distribute-the flow to three tubes that entered the test section. Three outlets from the test section returned the fluid to the circulating bath.
Interconnections between components were made with plastic and tygon tubing, and teflon fittings.
2. Power Distribution System
Power to the heater was supplied by a Kepco 0-100 V,
0-5 A power supply. The heater itself was a Minco 25.4 cm by
30.48 cm foil backed patch applied with pressure sensitive
adhesive. It had an effective heating area of 1116 cm2 and a
total resistance of 11.2 ± 1.1 n. The power supply was
connected in series with a precision resistor (R = 0.1 ± 0.001 n) for heater current determination.
Two Keithley 169 digital multimeters were used to
measure voltages. First, the voltage drop across the
precision resistor (V,) was measured so that current to the
heater could be accurately determined according to:
Ib = VV, / 0.1 n
The next measurement was the voltage drop across the heater
itself (V,). From these measurements, the power supplied to
the heater could be calculated using the following
relationship:
Pwr =Vh * Ih
3. Differential Pressure Measurement
Four pressure taps were located on the test section as
indicated in Figure 4. The taps were provided with valves so
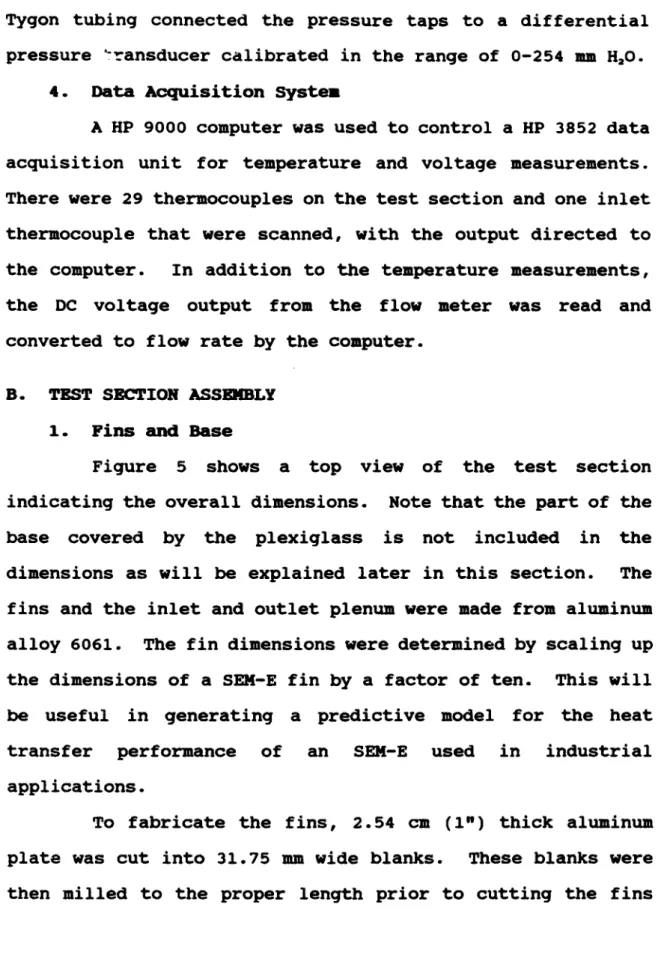
Tygon tubing connected the pressure taps to a differential pressure ýransducer calibrated in the range of 0-254 mm H20.
4. Data Acquisition System
A HP 9000 computer was used to control a HP 3852 data acquisition unit for temperature and voltage measurements. There were 29 thermocouples on the test section and one inlet thermocouple that were scanned, with the output directed to the computer. In addition to the temperature measurements, the DC voltage output from the flow meter was read and converted to flow rate by the computer.
B. TEST SECTION ASSEKBLY 1. Fins and Base
Figure 5 shows a top view of the test section indicating the overall dimensions. Note that the part of the base covered by the plexiglass is not included in the dimensions as will be explained later in this section. The
fins and the inlet and outlet plenum were made from aluminum alloy 6061. The fin dimensions were determined by scaling up the dimensions of a SEM-E fin by a factor of ten. This will be useful in generating a predictive model for the heat transfer performance of an SEM-E used in industrial applications.
To fabricate the fins, 2.54 cm (1") thick aluminum plate was cut into 31.75 mm wide blanks. These blanks were then milled to the proper length prior to cutting the fins
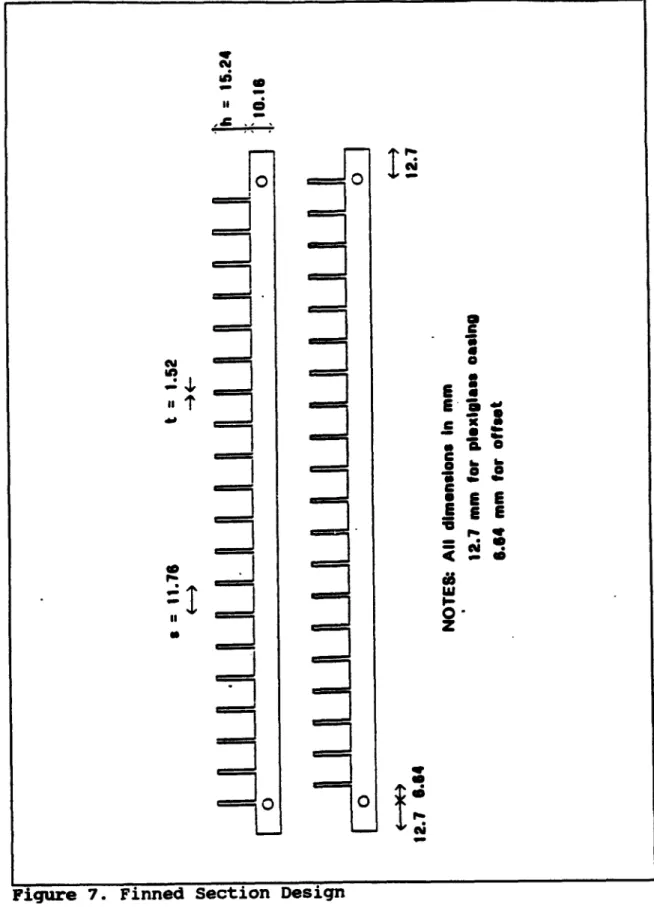
out. A specially made 11.76 mm diameter end mill was then used to mill the grooves in the blanks to form the fins with dimensions as shown in Figure 6. This left a 10.16 mm base on each fin section as indicated in Figure 7. One end of the blank was left longer than the other so that when alternated, each successive row of fins was offset by half the spacing
(see Figure 7). An extra 12.7 mm (0.5") was also left on each end to accommodate the plexiglass cover. Prior to assembling the fins, all edges were filed by hand to ensure burr free surfaces.
The inlet and outlet plenums were made from 12.7 mm
(0.5") aluminum plate. They had to be milled down to 10.16 mm to match the base of the finned sections. This prevented a ridge from disrupting the flow pattern upon entry into and exit from the fins.
Holes were drilled lengthwise through each fin section near the end to accommodate a threaded rod used to hold the 15 fin sections and the plenums together. Washers and nuts were used at each end of both rods and tightened appropriately for final assembly. Rubber insulating strips were placed between the first row of fins and the inlet plenum and similarly between the last row of fins and the outlet plenum. The purpose of the rubber strip was to minimize conduction heat
losses from the finned section longitudinally to the plenums. Prior to final assembly, a bead of RTV (silicone rubber
coating) was placed between the fin sections to prevent leakage.
2. Plexiglass Cover
With the base assembled, the final measurements could be taken to build the cover to enclose the fins and plenums. It was made from 12.7 mm (0.5") thick plexiglass sheet. The sides were milled to 15.24 mm high (the same height as the fins) and cut to length. The top was then cut to be the same size as the base and the sides were cemented and screwed in. An acrylic cement was used to seal all the plexiglass components.
3. Inlets and Outlets
Three inlets and three outlets were placed at the ends as shown in Figure 4. These consisted of 3.175 mm (1/8") pipe
thread drilled and tapped into the plexiglass wall with a 6.35
mm (1/4") tygon adapter on the opposite end of the fitting. Valves were placed on two of the outlets so they could be closed at low flow rates to provide a back pressure for filling and operating the test section as needed.
4. Pressure Taps
Four pressure taps were placed in the plexiglass cover
to allow monitoring of various lengthwise pressure drops. The holes that penetrate into the test section were 1.588 mm
(1/16") and were deburred by hand to ensure uniformity. On top of these holes, 3.175 mm (1/8") pipe taps were drilled and
threaded to accommodate the valves and tygon adapters. Valves were used since only two pressure taps were in service at a time.
5. Flow Straightening Region
In conjunction with the three inlets, a flow straightening region was used in the inlet plenum to provide "a velocity profile as uniform as possible. The flow first hit "a plastic mesh designed to distribute it evenly to the straws. The 38.1 = (1h") straws were then used to develop a straightened flow prior to reaching the fins. The placement of these components is shown in Figure 5.
6. Final Assembly
With all the fixtures mounted, the test section could be assembled. The top was fitted over the fins and screwed through the aluminum into the plexiglass. RTV was again used
as a sealant. A photograph of the completed test section is
included in Figure 8. During operation, the test section was insulated with foam rubber to minimize any heat losses to ambient.
7. Test Section Instrumentation
Once assembled, Copper Constantan (T-type) cement-on thermocouples were mounted on the back of the finned section and the inlet and outlet plenums. The thermocouples used were
flat ribbon type to allow better surface contact with the heater. Placement is indicated in Figure 5. The
thermocouples were mounted using a high thermal conductivity epoxy (Omegabond 101) along their leads. The junction of each sensor had a small amount of thermally conductive paste applied to minimize the thermal contact resistance.
After the thermocouple epoxy had cured, the heater was installed to the back of the test section. The entire finned part of the test section was covered except for 9.525 mm at each end and 3.24 mm on either side. A linoleum roller was used to apply sufficient pressure for good adhesion.
C. EXPERIMENTAL PROCEDURE
Both the Colburn j factor and the Fanning friction factor were desired as functions of Reynolds number. This required setting the flow rate as needed to obtain the Reynolds number of interest. With the flow held constant, the power to the heater was set to give a sufficient heat flux to allow a temperature gradient to be developed along the test section. After allowing time to ensure steady state, the necessary data was collected, reduced, and analyzed. This procedure was repeated for various flow rates, heat fluxes, and inlet temperatures until the entire range of Reynolds numbers obtainable with the available equipment had been covered.
Next, the test section was inclined at an angle of 450
(inlet lower) and an identical procedure as above was followed. This was to determine if there were any natural convection effects at low flow rates.
Lastly, a single temperature channel was monitored to determine if there were any time dependent temperature fluctuations within a single row of fins.
I LI
U.
a.u
II " "rl M 4 U..= U* -6IID am 40 11 11 11 H=I-, I I It I I H I I 11
It
I
J
I1 15.24 ,
s 11.7
Figure 6. Test Section Fin Dimensions
o
0
400 6S C EE"IZ--
*0
0 0 cm-III. RESULTS
A. DATA ANALYSIS
Heat transfer data is plotted against Reynolds number which was calculated by:
Re = P * V *
IL
where D. is defined by:
Dh=4 * Ac
Dh- (A/i)
In this case, A, is the free flow area of each channel (=sh ; see Fig. 6) and (A/l) is the heat transfer area per unit channel length (= [sl+2hl+2th]/l). This is different than the definition for an actual offset plate fin heat exchanger since the plexiglass cover is not considered a heat transfer surface. The velocity through the channels was determined by:
V=
Af
where Q is the volumetric flow rate from the pump and Ak is the free flow area through the test section (19 channels and 1 half channel).
The fluid properties, density (p), viscosity (M), thermal conductivity (k,), and Prandtl number (Pr), were all curve
fitted in the range of 0-40 °C to aid in data reduction. The temperature used to evaluate the properties was determined according to:
TPROP - TAVG + TmN
2
The Colburn j factor is typically used to describe the performance of offset plate fin heat exchangers. In order to calculate this, the average Nusselt number along the length of the heat exchanger is needed. It is defined by:
q1 * Dh
NuA = ~kr * (TAV-Tm)
The heat flux (qf), is determined by:
q Pwr
Ah
where Ak is the effective area of the heater.
The inlet temperature to the test section (T,,), was measured directly while the average temperature (TA.), was the
average of the test section centerline thermocouples. No correction was made for conduction through the aluminum base
because it was estimated at less than 0.2 °C at the highest heat flux and therefore neglected.
With NuA, known, the Colburn j factor could be calculated according to:
j= NUA•
Re * Pr1/3
B. HEAT TRANSFER RESULTS
The primary reason for investigating the heat transfer performance was to compare the results with published Colburn
j factor correlations and to use the data to validate a future numerical model.
The results are tabulated in Tables 1 and 2 and shown graphically in Figure 9. The solid line in Figure 9 is a frequently cited correlation developed by Wieting [Ref. 4] using air as the working fluid in the laminar flow range (Re < 1000). It is given by:
.0*162 -. 3
j=o.483 * ( ) * (Re)'
It should be noted that Wieting defines D6 differently (Db =
2sh/[s+h]) than the present study (see Chapter III, Section A) but the plotted correlation was corrected by using the fin
dimensions from this study with Wieting's definition of hydraulic diameter.
The dashed line in Figure 9 is a newer correlation developed by Manglik and Bergles [Ref. 3] using data gathered since Wieting's study. They state that their correlation is valid for a Prandtl number range of 0.5-15. This would
include water at normal temperatures but would not include high Prandtl number heat transfer oils such as PAO. The correlation is given by:
j=0.6522 * (Re)-y '54 0 3 * (*.)-°'1541 * (.• )°.1499 * (.L)-0.0678
Note that this correlation is based solely on Reynolds number and fin dimensions so does not require a correction for Db.
The data was also compared to the preliminary results of the Maryland study [Ref. 1]. While their data is not shown in Figure 9, there was very close agreement with the results of this study.
1. Horizontal Test Section
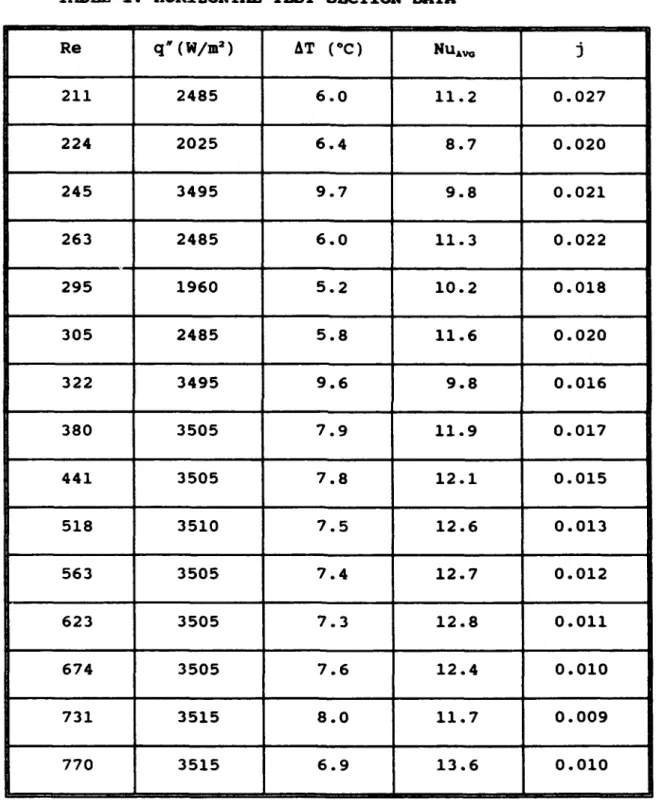
Fifteen data runs were performed with the test section in the horizontal position. The Colburn j factor data points are shown as asterisks in Figure 9. They compare favorably with the previous correlations but tend to deviate slightly at higher Reynolds numbers. This could possibly be due to nearing the transition range to turbulent flow. This range is
defined by Wieting to be between Reynolds numbers of 1000-2000 [Ref. 4].
TABLE I. HORIZONTAL TEST SECTION DATA
Re q" (W/m2) AT (-C) NUAV 211 2485 6.0 11.2 0.027 224 2025 6.4 8.7 0.020 245 3495 9.7 9.8 0.021 263 2485 6.0 11.3 0.022 295 1960 5.2 10.2 0.018 305 2485 5.8 11.6 0.020 322 3495 9.6 9.8 0.016 380 3505 7.9 11.9 0.017 441 3505 7.8 12.1 0.015 518 3510 7.5 12.6 0.013 563 3505 7.4 12.7 0.012 623 3505 7.3 12.8 0.011 674 3505 7.6 12.4 0.010 731 3515 8.0 11.7 0.009 770 3515 6.9 13.6 0.010
It should be noted that there were considerable variations in temperature between the monitored thermocouple locations. The reason for this is not entirely clear but believed to be due to the complex flow paths through the fins. The variations occurred both lengthwise and spanwise through the test section. Attempts were made to determine whether or not this was a measurement anomaly. Each test indicated that the measured temperatures were correct and they stayed
consistent throughout the duration of the experiment. 2. Inclined Test Section
Five additional data runs were performed with the test
section inclined at an angle of 450 in order to study the
effects of natural convection at low flow rates. The resulting Colburn j factor data points are plotted as circles in Figure 9. They tend to fall in line with the data points from the horizontal runs.
C. Time Dependent Temperature Variation
With the test section at steady state at Reynolds numbers between 400-600, a single channel was monitored at a sampling rate of 2.5 samples per second to attempt to detect any time dependent behavior. Each row of fins was checked but none of them varied by more than 0.1 °C.
TABLE II. INCLINED TEST SECTION DATA Re qv (W/m2) AT (-C) NUivG 141 1590 4.8 8.9 0.032 193 1590 4.6 9.3 0.025 218 2025 5.5 10.1 0.023 271 2605 6.7 10.6 0.020 367 3505 8.5 11.1 0.016
D. PRESSURE DROP RESULTS
It was not possible to measure the pressure drop through the test section so no Fanning friction factor data is included. Attempts were made with two differential pressure measurement systems but the pressure drop proved too small to measure with the equipment available. It was determined that it was on the order of a few mm H20.
p / ",1
:
" 1"m1/
z
/ Iz
""ita
A anole" uxnmqlcoFigure 9. Re vs
j
for Test SectionIV. CONCLUSIONS
This study reached the following conclusions on the heat transfer performance of an offset plate fin heat exchanger.
The Colburn j factor data agreed favorably with previous
correlations which tends to validate the experiment. The
differences between how the measurements were made in this study as opposed to previous studies also tends to validate the correlations.
Previous studies used actual heat exchanger cores, vice scaled up models, and measured an average surface temperature
of the core to use in their calculations. This study was the
first attempt, to the author's knowledge, to measure the
surface temperature of the individual rows of fins on a scaled
up model. This technique provided some insight into the
complexities of the flow within the finned region and allowed an average temperature to be calculated based on each row of
fins. This is not possible on actual cores due to the small
size of the fins.
The inclined heat transfer data showed that for Reynolds numbers as low as 140, natural convection does not appear to play any significant role in the heat exchangers performance.
The agreement of the Colburn j factor data with the correlations for air indicates that the Prandtl number for
transfer. In order to get a significant increase in performance, higher Prandtl number fluids must be used.
In general, the results of this study, when combined with the results of future studies, will allow researchers to validate numerical models in order to predict offset plate fin heat exchanger performance. These numerical models will then
hopefully be extended so that they can model heat exchangers using higher Prandtl number fluids.
V. RECOIIMND&TIONS
In continuation of this study, it is recommended that follow on studies include:
- Pressure drop data in order to determine the Fanning friction factor.
- Flow visualization using either liquid crystals or dye injection.
- The use of high Prandtl number fluids such as PAO in
order to aid in the determination of the Prandtl number dependence on heat transfer performance.
APPENDIX A UNCERTAINTY ANALYSIS
An uncertainty analysis was performed to evaluate the accuracy of the data in this study.
The uncertainty of a function F = F(X,, X2, X.), where X,2,.,
are the independent measurements is determined by:
[(OF \2 (__2 2 (F ,F8 3)1112
8F=j-
ax
2
For F = C X," X2b X3c the uncertainty can be put in the following form:
FY
1(- X1• t8X2• ( X32]/1. Reynolds Number Uncertainty
Re=p * v*Dh
and
8Re -2 +
v Dh
where, 8Dhj =A (U)2 ___8(Al)___1/ For A, 0.000179 Mn2 6A, = 0.000002 i 2 (A/1) = 0.0437 m 6(A/1) = 0.00025 m v = 0.0218 m/s 6v = 0.0003 m/s Dh= 0.0164 m 6Db = 0.00096 a p = 997.7 kg/M3 = 0.0009374 N-s/r 2 Re = 380 ± 23
The uncertainty 6Re/Re = 0.060 or 6.0% 2. Colburn j Factor Uncertainty
_Nu~v
Re * Pr 1/3
and
8N[fj;pa2
+IA!
a~e211/28NU r§If ~2+ )2+( 6AT2 11/2 Nuk q11 Dh) ATJ For q= 3505 W/m2 6q" = 36 W/m2 Db= 0.0164 m 6D, = .00096 m AT =7.9 °C 6AT =0 .1 C Nu = 11.9 6Nu = 0.7 Re = 381 6Re = 22.8 Pr = 6.458
j
= 0.017 ± 0.001 The uncertainty 6j/j = 0.085 or 8.5% 35APPENDIX B SAMPLE CALCULATIONS
The following calculation is for Q=7.63E-5 m3/s, q'=3505
W/m2, T,,=300.1 K, Tz.=292.2 K. I. Characteristic Dimension
Hydraulic Diameter (Dh) = (4)(I.79E-4)/(4.37E-2)
- 0.0164 m
2. Water Properties [Ref. 5, p. A22]
Tm = (T,,,a + Tw)/2 = 296.1 K p = 997.7 kg/m3 A = 9.374E-4 N-s/r 2 k,= 0.6076 W/m-K Pr = 6.458 3. Reynolds Number v = (7.63E-5)/(3.506E-3) = 0.0218 m/s Re = (997.7)(0.0218)(0.0164)/(9.374E-4) = 380 4. Nusselt Number NuA, = (3505) (0.0164)/(0.6076) (300.1-292.2) = 11.9 5. Colburn j Factor j = (11.9)/(380)(6.458)"/3 = 0.017
LIST OF REFERENCES
1. Herold, K.E, Srindar, S. and Hu, S., "Cooling of
Electronic Boards Using Internal Fluid Flows", Advances
Electronic Packaging, ASME, pp. 285-290, 1992.
2. Buechler, A.J. and Brough, A.J., "Liquid Flow-Through-Module Thermal Evaluation Test Report (NWSC-6043-AECS-2)", Crane Division, Naval Weapons Support Center, Mar 1993. 3. Manglik, R.M. and Bergles, A.E., "The Thermal-Hydraulic Design of the Rectangular Offset Strip Fin Compact Heat Exchanger", Compact Heat Exchanaers, Hemisphere, pp. 123-149, 1990.
4. Wieting, A.R., "Empirical Correlations for Heat Transfer and Flow Friction Characteristics of Rectangular Offset-Fin, Plate-Fin Heat Exchangers", Journal of Heat Transfer, v. 97, pp. 488-490, 1975.
5. Incropera, F.P. and DeWitt, D.P., Introduction to Heat Transfer, 2nd Ed., John Wiley & Sons, 1990.
INITIAL DISTRIBUTION LIST
No. Copies 1. Defense Technical Information Center 2
Cameron Station
Alexandria VA 22304-6145
2. Library, Code 052 2
Naval Postgraduate School Monterey CA 93943-5002
3. Prof. Y Joshi 2
Department of Mechanical Engineering 3147 Engineering Classroom Building University of Maryland
College Park, MD 20742
4. Mr. Kip Hoffer 1
Naval Weapons Support Center Code 6042
Crane, IN 47522
5. Mr. Tony Buechler 1
Naval Weapons Support Center Code 6042
Crane, IN 47522
6. Naval Engineering Curricular Officer, Code 34 1
Naval Postgraduate School Monterey, CA 93943-5002
7 LT Jeffrey Masterson 1
809 Ballantyne Lane