Hyper-Quad-Tree based K-Means Clustering Algorithm
for Fault Prediction
Swati Varade
M.E.II Year (Student) Dept.of Computer Engg. JSCOE,Hadapsar, Pune
Madhav Ingle
Asso.ProfessorDept.of Computer Engg. JSCOE, Hadapsar, Pune
ABSTRACT
Many researchers examined the need for the development of fault-free software and increase the efficiency of presented algorithms. An optimization of existing algorithms and software fault prediction are two important techniques. It is proven that this technique has to be useful in increasing effectiveness of software, software testing, examining progression costs and achieving results. This paper illustrates hyper quad tree based k-means algorithm for software fault prediction. This system overcomes the weaknesses in k-means algorithm using Hyper Quad Tree as compared to Quad Tree.
Hyper quad tree works in n-dimensions hence it finds better initial cluster centers than former algorithms. This constraint of k-means algorithm is try to solve by hyper quad tree. Another crisis is that k-means is very susceptible to the noise , which is also removed by hyper quad tree algorithm.
General Terms
Confusion Matrix, Centroid, Clusters
Keywords
Software fault prediction, Quad Tree, Dataset, Hyper-Quad Tree, and K-Means clustering.
1.
INTRODUCTION
When publications about the fault predictions are studied it was seen that in early studies static code features were used more. But afterwards, it has been understood that beside the effect of static code metrics on fault prediction, other measures similar to process metrics are also efficient and should be investigated. For example, Fenton and Neil (1999) argued that static code measures alone are not able to predict software faults accurately. Unsupervised learning refers to the problem of trying to find the hidden structure in unlabeled data, Here unsupervised techniques like clustering may be used for fault prediction in software modules, additionally so in those cases where fault labels are not available. This paper shows a Hyper Quad Tree-based K-Means algorithm is applied for predicting faults in a given modules. The aim of this paper is double first, Hyper Quad Trees algorithm is applied for finding the cluster centers which will be an input to the K-Means clustering algorithm (which is a non-hierarchical clustering procedures which allow to move the items among sets of clusters in anticipation of the preferred sets are achieved.) Hyper Quad Tree based K-Means algorithm offer better cluster center and lowers the Fault ratio as well as errors in a given data set as compared to the Quad Tree based K-means algorithm. The idea behind this paper is
to remove the shortcomings of simple K-Means clustering algorithm using Hyper Quad Tree. The proposed HQT based K-Means clustering algorithm performs the better software fault prediction than other algorithms.
The remaining part of the paper consist of the following: Section 2 presents the related work on the topic. Section 3 presents an overview on the theory of Quad Tree, Hyper Quad Tree and K-Means Clustering Algorithm. Section 4 presents the System Proposal. Section 5 presents the conclusion.
2.
RELATED WORK
Related work gives the idea of how the set of clusters are obtained from the given data, but it is not addressed that
The user has to initialize the number of clusters which is very not easy to identify in the majority of the cases. Item it requires selection of the suitable initial cluster centers which is again subject to error that is it is not providing the accurate centroid.
This paper tries to find the better centroid than Quad-tree algorithm by using Hyper Quad-tree which will give an input to the K-Means algorithm for lowers the error rate and effective software fault prediction. In short it tries to optimize the K-Means algorithm to provide good quality of results; also it will help to decrease in the total cost of the project and an increase in overall project success rate.
3.
OVERVIEW
3.1
K-Means clustering algorithm.
There are two existing basic versions of k-means clustering, a non-adaptive version introduced by Lloyd and an adaptive version introduced by MacQueen]. Adaptive k-means clustering based on the Euclidean distance is most commonly used k-means clustering technique. K-means (MacQueen, 1967) is one of the easiest unsupervised learning algorithms that solve the clustering problem. The procedure follows a straightforward and easy way to categorize a given data set through a certain number of clusters (assume k clusters) fixed a priory. The main aim is to define k centroids, one centroid for each cluster. These centroids should be placed in a wiliness way because of different position causes different outcome. So, in good health option is to place them as much as probable far away from each other. The next step is to take each point from a given data set and join it to the nearest centroid. When no point is remaining, the first step is completed and an early group page is done. At this step it needs to re-calculate k new centroids as bar centers of the clusters resulting from the previous step. Following it has these k new centroids, a new binding has to be done between the nearest new centroid and the same data set points. A loop has been generated. As a result of this loop it is noticed that the k centroids change their position step-by-step until no more changes are done.
3.1.1
The algorithm consists of the subsequent
steps [9]
Set K points into the space represented by the objects that are being clustered. These points represent initial group centroids.
Allocate each object to the set that has the closest centroid.
When all objects have been allocated, recalculate the locations of the K centroids.
Replicate Steps two and three until the centroids no longer move. This creates a separation of the objects into groups from which the metric to be reduced can be calculated.
3.1.2
Shortcomings of K-Means Clustering
The cluster centers, therefore found, serve up as input to the clustering algorithms. However, it has several intrinsic weaknesses.
The user has to initialize the number of clusters which are very not easy to identify in the majority of the cases.
arrangement of the clusters depends on the initial cluster centers this may result in an incompetent clustering.
The K-Means algorithm is extremely susceptible to noise.
3.2
Quad Tree
This tree data structure was named a Quad tree by Raphael Finkel and J.L. Bentley in 1974. A similar partitioning is also known as a Q-tree. Quad tree (4-ary tree) is the recursive data structure, this tree stands for a division of the matrix into sub matrices (nodes). Leafs of the quad tree are separated into “complete" or "blank" nodes. The Quad Tree-based method assigns the suitable initial cluster centers and removes the outliers hence overcoming the second and third weakness of K-Means clustering algorithm.
3.2.1
General features of quad tree-
They decompose space into adaptable cells. Each cell (or bucket) has a highest capacity. When highest capacity is reached, the bucket splits. The tree directory tracks the spatial decomposition of the Quad tree.
Fig. 1 shows the simple Quad tree illustration from [1]
Fig1 Simple Quad Tree
3.2.2
Margins of Quad Tree
The user has to initialize the number of clusters which are very tricky to identify using quad tree algorithm. It is not providing the accurate centroid.
3.1
Hyper Quad Tree
The hyper-quad tree is universal quad-tree, representing a total recursive division of the n-dimensional vector space. Every inner node of the hyper-quad tree includes a covering hyper-quad and 2n links to all its sub- hyper-quad. The Hyper Quad Tree-based method assigns the appropriate initial cluster centers and eliminates the outliers hence overcoming the second and third drawback of K-Means algorithm that is
Hyper Quad-Trees are applied for finding initial cluster centers for K-Means algorithm. User can generate desired number of cluster centers that can be used as input to the simple K-Means.
This paper tries to find the healthier centroid than Quad-tree algorithm by using Hyper Quad-tree, which will be given an input to the K-Means algorithm to lowers the fault rate and effective software fault prediction. Hyper Quad-Trees are expected to give improved cluster centers than the Quad-tree because
It has an eight-way branching tree whose nodes are combined with axis- parallel boxes.
A multidimensional Quad-tree and a hyper quad tree is a d-dimensional analogue.
It separates the regions recursively so that no region has more than single data point.
Fig2 shows a simple hyper quad tree representation of data set dots denotes the data
3.3.1
Proposed algorithm to generate a hyper
quad tree is as follows
1. Insert dataset.
2. Retrieve the data column wise. 3. Select attributes from different columns.
4. Get minimum and maximum from those attributes. 5. Create X axis and Y axis from min and max value. 6. Get the actual values from dataset and plot on X-Y axis.
7. Divide the graph in 4 Quad. 8. Create tree.
9. For each quad. A If quad quantity > 1 B Divide the graph in 4 Quad. C Go to line 6.
10. End for.
11. Find the sub trees which having max number of Childs.
12. Select those sub root nodes as centroid for clustering algorithm.
13. Input: Data set, Min, Max 14. Output: Centroid
Fig2 Hyper Quad Tree
4.
THE PROPOSED SYSTEM
ARCHITECTURE
The proposed system is an effective software fault prediction Using Hyper-Quad-Tree Based K-Means Clustering Algorithm that classify given data using Hyper Quad-tree algorithm. The system consists of
Hyper Quad-tree algorithm splits cells, find low and high value for the spatial decomposition and obtain a better centroid by dividing the data in N-dimensions.
K-Means clustering algorithm is applied to get healthier clusters it calculates the distance, Shuffle data points according to distance, if centroid is constant then stop. The productivity of this is the set of clusters also reduces the number of clusters.
Apply some threshold value for the set of clusters to for denoting faulty and non-faulty data in clusters using that system measures the Faults in terms of FPR, FNR and ERROR using confusion matrix given in Table1.
Fig3.PraposedSystem
5.
EXPERIMENTAL RESULTS
5.1
Dataset and Assessment Factors
Some experiments are conducted on real data sets to test HQT algorithm. These data sets are: AR1, AR3, AR4, AR5, AR6 available at [11]. All these data sets are related to software fault prediction. As Shown in Table 1. The Actual labels of data items are pointed along the rows, while the predicted labels are pointed along the columns. For example, a False Actual label implies that the module is faulty. If a non-faulty module (False- Actual label) is predicted as non-non-faulty (False- Predicted Label) then there is the condition of cell A, which is True Negative, and if it is predicted as faulty (True -Predicted label) then there is the condition of cell B, which is False Positive. Similarly True positives are modules precisely classified as faulty modules then there is the condition of cell D. False negative refer to Non-Faulty modules incorrectly labeled as faulty modules then there is the condition of cell C. The False positive rate is the percentage of not faulty modules labeled as faulty by the model and the false negative rate is the percentage of faulty modules labeled a fault free and Error is the percentage of mislabeled modules. The following equations are used to calculate these FPR, FNR and Error [1]
….. (1)
HQT K-Means
Confusion Matrix
Dataset Centroid Set of
clusters
FPR
FNR Error Rate
. . . . .
. .
. . … . . . . . .
. . .
. . ..
. . .
….. (2)
-….. (3)
The above performance indicators should be minimized. A high value of FPR would lead to wasted testing effort while high FNR value means error prone modules will escape testing. The parameter used in this experiment for AR# data sets is Lines of Code (Loc), unique operands, Here for the process, if any metric value of the centroid data point of a cluster obtained by using Hyper quad Tree is better than the threshold that cluster was labeled as faulty and otherwise it was labeled as non-faulty. After this the predicted fault labels will compare with the actual fault labels, also the clusters can be label according to the majority of its members by comparing with metrics thresholds but this increases the complexity of the labeling procedure since all the modules in the cluster need to be examined.
[image:4.595.329.523.64.615.2]Confusion Matrix for Fault Prediction
Table 1: Confusion Matrix
Predicted Labels
Ac
tu
al
Lab
els
False
(Non-Faulty
True
(Faulty)
False
(Non-Faulty)
True Negative
A
False Positive
B
True
(Faulty)
False Negative
C
True Positive
D
5.2
Result:
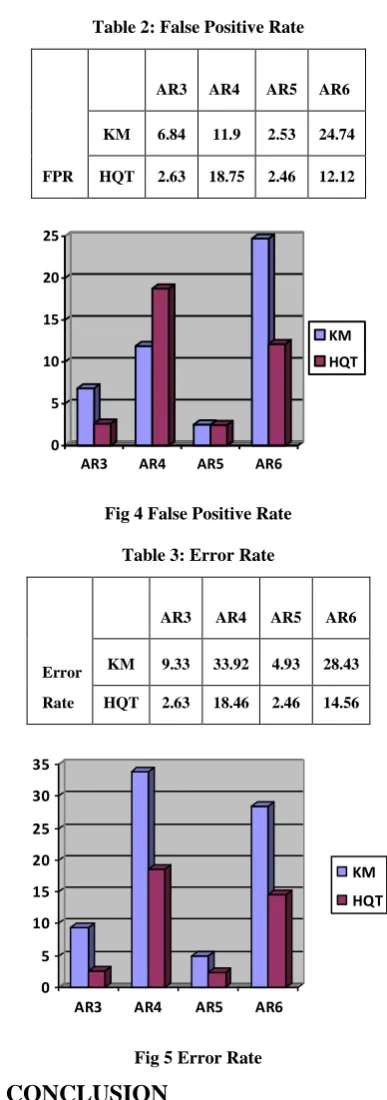
Using the formulae summarized above, Fault Positive Rate, False Negative Rate and error rates are calculated for both the clustering algorithms that are for K-Means and Hyper Quad Tree based K-means algorithm independently. The calculated result is shown via table and charts for comparison purposes. Fig4 and Fig5 points out a bar chart which shows the assessment of Fault Positive Rate and Error rates for both the algorithms. It proves that the results of Hyper-Quad Tree algorithm are more accurate than Quad Tree [1] and K-Means algorithm due to lesser error rates as shown in Table2 and Table3. Fault Positive Rate and Error rate found using Hyper Quad Tree is better For AR3 and AR5 data sets as compared to Quad Tree and K-Means. AR4 data set shows somewhat different result for Hyper Quad Tree, but better than K-Means Algorithm.
Table 2: False Positive Rate
FPR
AR3 AR4 AR5 AR6
KM 6.84 11.9 2.53 24.74
HQT 2.63 18.75 2.46 12.12
0 5 10 15 20 25
AR3 AR4 AR5 AR6
[image:4.595.83.253.67.149.2]KM HQT
[image:4.595.345.515.74.319.2]Fig 4 False Positive Rate
Table 3: Error Rate
Error
Rate
AR3 AR4 AR5 AR6
KM 9.33 33.92 4.93 28.43
HQT 2.63 18.46 2.46 14.56
0 5 10 15 20 25 30 35
AR3 AR4 AR5 AR6
KM
HQT
Fig 5 Error Rate
6.
CONCLUSION
[image:4.595.73.263.346.503.2]The future process for superior software fault prediction using clustering approach focused on automatic initialization of number of clusters now which is manually initialized by the user and it is the third drawback of k-means algorithm. It defiantly save the time for an initialization of number of clusters manually to the user also saves a cost for it which also improves the quality of K-Means algorithm.
7.
ACKNOWLEDGEMENTS
This is my post graduate project work that has been completed I especially thankful to my project guide for their suggestions and support and also thankful to my all staff members for their assistance.
8.
REFERENCES
[1] P.S. Bishnu and V. Bhattacherjee, Member, IEEE” Software Fault Prediction Using Quad Tree-Based K-Means Clustering Algorithm” IEEE Transactions on Knowledge and Data Engineering, Vol. 24, No. 6, June 2012
[2] P.S. Bishnu and V. Bhattacherjee, “Outlier Detection Technique Using Quad Tree,” Proc Int’l Conf. Computer Comm. Control and Information Technology, pp. 143-148, Feb. 2009.
[3] P.S. Bishnu and V. Bhattacherjee, “Application of K-Medoids with kd-Tree for Software Fault Prediction,” ACM Software Eng. Notes, vol. 36, pp. 1-6, Mar. 2011.
[4] V. Bhattacherjee and P.S. Bishnu, “Software Fault Prediction Using KMedoids Algorithm,” Proc. Int’l Conf. Productivity, Quality, Reliability, Optimization and Modeling (ICPQROM ’11), p. 191, Feb. 2011.
[5] J. Han and M. Kamber, “Data Mining Concepts and Techniques”, second Ed, pp. 401-404. Morgan Kaufmann Publishers, 2007.
[6] Parvinder S. Sandhu, Jagdeep Singh, Vikas Gupta, Mandeep Kaur, Sonia Manhas, Ramandeep Sidhu” A K-Means Based Clustering Approach for Finding Faulty Modules in Open Source Software Systems” ,World Academy of Science, Engineering and Technology 48 2010
[7] Michael Laszlo and Sumitra Mukherjee, Member, IEEE, “A Genetic Algorithm Using Hyper-Quad trees for Low-Dimensional K-means Clustering”, IEEE transactions on pattern analysis and machine intelligence, vol. 28, no. 4, April 2006
[8] Leela Rani.P, Rajalakshmi.P,” Clustering Gene Expression Data using Quad-tree based Expectation Maximization Approach” International Journal of Applied Information Systems (IJAIS) – ISSN : 2249-0868 Foundation of Computer Science FCS, New York, USA Volume 2– No.2, June 2012 – www.ijais.org
[9] Meenakshi PC, Meenu S, Mithra M, Leela Rani.P,” Fault Prediction using Quad-tree and Expectation Maximization Algorithm”, International Journal of Applied Information Systems (IJAIS) – ISSN : 2249-0868 Foundation of Computer Science FCS, New York, USA Volume 2– No.4, May 2012 – www.ijais.org
[10] P.S. Bishnu and V. Bhattacherjee “A New Initialization Method for K-Means Algorithm Using Quad Tree”, Proc. Nat’l Conf. Methods and Models in Computing (NCM2C), pp. 73-81, 2008.
[11] http://promisedata.org/, 2012.