A COMPARATIVE ANALYSIS ON FEATURE SELECTION TECHNIQUES
FOR CLASSIFICATION PROBLEMS
Munirah M. Y1, Rozlini, M1, Nawi N. M1, Wahid, N.1 and Shukran M. A. M2
1Computer Science and Information Technology, Universiti Tun Hussein Onn Malaysia, Batu Pahat, Johor, Malaysia 2Defence Science and Technology, National Defence University of Malaysia, Kuala Lumpur, Malaysia
E-Mail: [email protected]
ABSTRACT
Feature selection has become the vital step in many data mining application for instances classification. Feature selection eliminates irrelevant attribute to obtain high quality features that may contribute in enhancing classification process and producing better classification results. This study is conducted with the intention to find out the most appropriate features that may lead to the best accuracy for various datasets of same domain, which is medical domain. During the experiments, comparisons were made between six benchmark feature selection methods based on eight medical datasets. Then, the performance were analyzed based on two machine learning algorithms; Naïve Bayes and KNN with and without feature selection in term of F-Measure and ROC on those medical datasets. From the experiment the optimum feature subsets are found. Moreover, the findings effectively support the fact that feature selection helps in increasing the classifier performance with existence of minimum number of features. However, no single feature selection methods that best satisfy all datasets and learning algorithms and this will simplify by assumption that features are independent for a given class variable. Hence, it still enables to obtain the optimal dimensionality of the feature subsets within the respective medical datasets.
Keywords: feature selection, medical datasets, ROC value, F measure, accuracy.
INTRODUCTION
Medical datasets are often classified by a large number of diseases measurements when some of the measurements are not important and irrelevant. This amount of data measurement will lead to low quality, unreliable, redundant and noisy data which affect the process of observing knowledge and pattern during training. Therefore it is vital to produce more reliable data from this amount of large and unimportant data by using feature selection methods (Ashraff et al, 2013).
Feature selection is an essential part of knowledge discovery. It is used to improve the classification accuracy and to reduce irrelevant data (Han and Kamber, 2006). The main objective of feature selection is to choose a subset of input variables by eliminating features, which are irrelevant or of no predictive information. By using feature selection methods, quality data is obtained which help raises the quality of medical data classification results.
In the current work, we focus on eight medical datasets obtained from UCI repository. This datasets is varies from the context of attributes and instances. This study employs six future selection methods in order to identify the best possible features subset and then examined the performance of classifiers with those selected features. This paper begins with related works of future selection in medical domain. Then, we will describe our experiments and the results in the next section. Finally we end this paper with a conclusion.
FEATURE SELECTION
Feature selection has been an active and fruitful field of research area in pattern recognition, machine learning, statistics and data mining communities (Han and Kamber, 2006). It is a dimensionally reduction technique
that main goal is to reduce irrelevant data and finding a features that increase classification accuracy. The main objective of feature selection is to choose a subset of input variables by eliminating features, which are irrelevant or of no predictive information. It has been proven in both theory and practice to be effective in enhancing learning efficiency, increasing predictive accuracy and reducing complexity of learned results (Almuallim and Dietterich, 1994), (Koller and Sahami, 1996).
Feature selection framework algorithm
There are four basic steps in a typical feature selection process as shown in Figure-1.
i. The generation procedure to generate the next candidate subset from original feature set
ii. The evaluation function to evaluate the subset to determine the relevancy towards the classification
task using measure for instances distance, dependency, information and consistency
iii. Stopping criteria to decide when to stop. This is where it determine the relevant subset or optimal feature subset
iv. Validation procedure is to check whether the selected feature subset is valid
Related work on feature selection
Feature selection is often applied to optimize the classification process. Numerous feature selection methods have been broadly used for different domains for instances for medical, educational, computer security and agriculture domain (Ashraf et al, 2013) (Ramaswami and
Bhaskaran, 2009) (Aggarwal, M. and Amrita, 2013) (Phadikar, S. et al, 2013). Though, this study will focus on feature selection on medical domain. These studies were reported in Table-1 focusing of medical dataset using various feature selection methods and classification techniques.
Table-1. Example of works of feature selection.
Author Purposes Techniques Outcome
Ashraf et. al,
2013 Feature Selection
Correlation based feature selection (CFS),
Consistency based subset evaluation (CB),
Information gain,
Symmetrical uncertainty, Relief (RF), Principle component analysis (PCA)
The study found that feature selection methods are capable to improve the performance of learning
algorithms.
Lavanya and
Usha Rani, 2011 Feature Selection
and classification Decision tree classifier-CART
The results show that a particular feature selection using CART has enhanced the classification
accuracy of a particular dataset Nahar et al.,
2013 and classification Feature selection Motivated feature selection process (MFS)
improved the performance especially in terms of accuracy, for most of the classifiers for the
majority of the datasets
Shilaskar et al., 2013
Feature selection and classification
Forward inclusion method Forward selection
Backward elimination search techniques Hybrid forward selection techniques
Experimental result shows proposed method able to finds smaller subsets and increases the accuracy
of diagnosis.
Chen et al., 2011
Feature selection Genetic Algorithm + one nearest neighbor (GA + 1-NN)
Experimental results demonstrate the proposed RS_SVM able to achieve very high classification
accuracy and detect a combination of five informative features.
Wang et al.,
2006 and classification Feature selection
Particle Swarm Optimization (PSO) Neural Networks Decision Trees Fuzzy Min–Max Neural Networks
(FRE-FMMNN)
Experimental results show that proposed algorithm select the feature more efficient and
generate better rules with better classification performance. Jothi and Hannah Inbarani, 2012 Feature Selection and clustering
Unsupervised Soft Set based Quick Reduct (SSUSQR).
KMeans
Self Organizing Map (SOM) clustering algorithms
The results show that the proposed method effectively removes redundant features.
Polat and Gunes,
2007 Feature Selection
and classification Fuzzy weighted pre-processing
The reduction attribute able to obtained classification accuracy that very promising
Abraham, Simha and Iyengar (2009) Feature Selection and classification Chi Square Wrapper Subset Selector.
Proposed algorithm using generative Naïve Bayesian classifier on the average is more efficient than using discriminative models, Logistic Regression and Support Vector Machine Chen et. al.,
(2011) Feature Selection and classification
Rough set (RS) based supporting vector machine classifier (RS_SVM)
Experimental results demonstrate the proposed RS_SVM able to achieve very high classification
accuracy and detect a combination of five informative features.
Overall, all related work studies found that feature selection methods are capable to improve the performance of learning algorithms. Hence, it increases the accuracy of the classifier because it eliminates irrelevant attributes. High quality features may contribute in enhancing classification process and produce better
EXPERIMENTAL RESULTS
Datasets
In this experiment, datasets related to medical domain is chosen from UCI machine learning repository which is publicly available. We have chosen seven
datasets that are ranged in sizes. The smallest dataset contains 27 attributes and the largest dataset contains 768 attributes. Number of attributes also ranges from 6 to 69 while all data contains two classes. The description of the datasets is given in Table-2.
Table-2. Datasets characteristics.
Dataset Instances attributes Num. of after reduction by PCA Num. of attributes
Appendicitis 106 7 3
Audiology 226 69 63
Prima Diabetes 768 8 8
Breast Cancer 683 9 7
Heart 270 13 12
Parkinson 195 22 8
Lung Cancer 27 56 21
Liver 345 6 5
The experiments are conducted using WEKA tool which is available publicly and DPSORS tool (Chung and Wahid, 2012). WEKA provides the environment to perform many machine learning algorithm and feature selection methods while DPSORS focus on feature selection using DPSO-RS technique.
In this study, the experiments are conducted using seven datasets with and without feature selection methods. An evaluation of four feature subset methods with rank search (Correlation-based Attribute evaluation (CB), Chi-Square Attribute evaluation (CH), Information-Gain Attribute evaluation (IG) and Symmetrical Uncertainty Attribute evaluation (SU)) (Sayes et al.,
2007), one feature reduction method; Princple Component Analysis (PCA) and one feature selection method namely DPSO-RS proposed by Chung and Wahid (2012) was performed to find out the best feature sets. The rank search feature subset methods could assess the relevances of features on the basis of the inherent properties of the data while PCA has been widely used as feature reduction method. Feature selected using DPSO-RS method been proven by Chung and Wahid (2012) for its higher classification accuracy.
Feature selection often increases classifier efficiency through the reduction of the size of the effective
features. Therefore, it is needed to verify the relevance of all the features by performing the above feature selection methods on performance measure to choose the best subsets for a given cardinality. We used NaiveBayes and KNN classification algorithm, to select the final best subset among the best subsets across different cardinalities. Two performance measure; F-Measure and ROC area been used in analyzing the performance of all datasets classification model. These two classifiers are conducted towards the originals datasets and datasets with selected featured with the intention to find out the most appropriate attributes or features that may lead to best accuracy for various datasets of same domain.
The first algorithm is Naïve Bayes from Bayes category. Naïve Bayes classification has been demonstrated to be better than several other classification methods when applied to medical data (Al-Aidaroos, et al.
2012). The second algorithm is K-NN from lazy learning category. KNN is the instance based statistical analysis approach to perform data classification. It is tis one of the most widely used for classification problem (Jabbar, et al.,
(2013). It is the most simple and straightforward classifier which stores all cases and classifies new cases based on similarity measure. Classification is attain by identifying the nearest neighbor to determine the class of a sample.
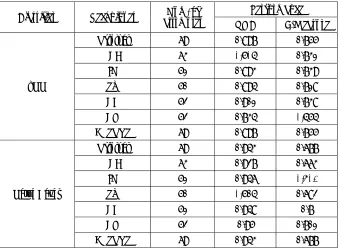
Table-3. Results for attribute selection methods with appendicitis datasets.
Classifier Techniques attributes Num. of Performance
ROC F-Measure
kNN
Original 7 0.752 0.825
PCA 3 0.699 0.804
IG 6 0.724 0.799
CB 7 0.752 0.825
CH 6 0.724 0.799
DPSORS 7 0.752 0.825
Naïve Bayes
Original 7 0.811 0.86
PCA 3 0.843 0.86
IG 6 8.29 0.87
SU 6 0.829 0.87
CB 7 0.811 0.86
CH 6 0.829 0.87
[image:4.612.129.479.65.247.2]DPSORS 7 0.811 0.86
Table-4. Results for attribute selection methods with audiology datasets.
Classifier Techniques attributes Num. of Performance
ROC F-Measure
kNN
Original 69 0.897 0.755
PCA 63 0.908 0.731
IG 51 0.893 0.739
SU 50 0.894 0.718
CB 52 0.901 0.738
CH 52 0.734 0.898
DPSORS 69 0.897 0.755
Naïve Bayes
Original 69 0.943 0.677
PCA 63 0.927 0.663
IG 51 0.946 0.702
SU 50 0.948 0.682
CB 51 0.948 0.7
CH 52 0.95 0.701
DPSORS 69 0.943 0.677
Table-3 until Table-10 shows results for attribute with and without selection methods. We observed from Table 3 the ROC and F-Measure on Appendicitis dataset. The ROC value is 0.752 and F-Measure value is 0.825 which is highest with 7 attributes with kNN classifier. While for Naïve Bayes classifier, the result is better with 0.843 for ROC with 3 attributes and 0.87 for F-Measure with 6 attributes.
Table-4 shows that the ROC and F-Measure on Audiology dataset. We observed that the highest ROC for kNN is 0.908 with 63 attributes and highest F-Measure value is 0.898 with 52 attributes. While for Naïve Bayes classifier, the highest ROC value is 0.948 with 50 attributes and 52 attributes and highest F-Measure is 0.702 value with 51 attributes. However, based on higher accuracy values (72.03%), 50 attributes is selected for ROC.
Table-5. Results for attribute selection methods with PIMA diabetes datasets.
Classifier Techniques attributes Num. of Performance
ROC F-Measure
kNN
Original 8 0.65 0.698
PCA 8 0.65 0.698
IG 8 0.65 0.698
[image:4.612.138.477.269.519.2]CB 8 0.65 0.698
CH 8 0.65 0.698
DPSORS 4 0.658 0.683
Naïve Bayes
Original 8 0.819 0.76
PCA 8 0.819 0.76
IG 8 0.819 0.76
SU 8 0.819 0.76
CB 8 0.819 0.76
CH 8 0.819 0.76
DPSORS 4 0.829 0.769
Table-6. Results for attribute selection methods with breast cancer wisconsin datasets.
Classifier Techniques attributes Num. of Performance
ROC F-Measure
kNN
Original 9 0.973 0.951
PCA 7 0.976 0.959
IG 9 0.628 0.697
SU 9 0.628 0.697
CB 9 0.628 0.697
CH 9 0.628 0.697
DPSORS 8 0.973 0.953
Naïve Bayes
Original 9 0.989 0.960
PCA 7 0.989 0.962
IG 9 0.701 0.708
SU 9 0.701 0.708
CB 9 0.701 0.708
CH 9 0.701 0.708
DPSORS 8 0.988 0.962
Table-5 shows that the ROC and F-Measure on Pima Diabetes dataset. We observed that the highest ROC for kNN is 0.658 with 4 attributes and highest F-Measure value is 0.698 with 8 attributes. While for Naïve Bayes classifier, the highest ROC value is 0.829 and highest F-Measure is 0.769 value both with 4 attributes.
Table-6 shows that the ROC and F-Measure on Breast Cancer Wisconsin dataset. We observed that the
highest ROC for kNN is 0.976 and highest F-Measure value is 0.959 both with 7 attributes. While for Naïve Bayes classifier, the highest ROC is 0.989 with 9 and 7 attributes and F-Measure value is 0.962 with 7 and 8 attributes. Based on higher accuracy values, 7 attributes is selected for both ROC (72.03%) and F-Measure (96.14%).
Table-7. Results for attribute selection methods with heart datasets.
Classifier Techniques attributes Num. of Performance
ROC F-Measure
kNN
Original 13 0.75 0.752
PCA 12 0.75 0.752
IG 10 0.757 0.759
CB 13 0.75 0.752
CH 10 0.757 0.759
DPSORS 12 0.759 0.763
Naïve Bayes
Original 13 0.898 0.837
PCA 12 0.898 0.837
IG 10 0.898 0.84
SU 10 0.898 0.837
CB 13 0.837 0.898
CH 10 0.898 0.84
DPSORS 12 0.898 0.837
Table-8. Results for attribute selection methods with Parkinson datasets.
Classifier Techniques attributes Num. of Performance
ROC F-Measure
kNN
Original 22 0.967 0.964
PCA 8 0.867 0.867
IG 20 0.962 0.959
SU 20 0.962 0.959
CB 20 0.962 0.959
CH 20 0.962 0.959
DPSORS 12 0.873 0.752
Naïve Bayes
Original 22 0.858 0.713
PCA 8 0.774 0.608
IG 20 0.861 0.733
SU 20 0.861 0.733
CB 20 0.861 0.733
CH 20 0.861 0.733
DPSORS 12 0.906 0.928
Table-7 shows that the ROC and F-Measure on Heart dataset. We observed that the highest ROC for kNN is 0.759 and highest F-Measure value is 0.763 with 12 attributes. While for Naïve Bayes classifier, the highest ROC is 0.898 for multiple feature subsets andF-Measure value is 0.898 with 13 attributes. For ROC, we have selected feature subsets with 10 attributes as it hold higher value of accuracy (84.07%).
T able-8 shows that the ROC and F-Measure on Parkinson dataset. We observed that the highest ROC for
kNN is 0.967 and highest F-Measure value is 0.964 with 22 attributes. While for Naïve Bayes classifier, the highest ROC is 0.906 and F-Measure value is 0.928 with 12 attributes. Table-9 shows that the ROC and F-Measure on Lung Cancer dataset. We observed that the highest ROC for kNN is 0.633 with 25 attributes and F-Measure value is 0.65 with 54 attributes. While for Naïve Bayes classifier, the highest ROC is 0.715 and F-Measure value is 0.713 both with 54 attributes.
Table-9. Results for attribute selection methods with lung cancer datasets.
Classifier Techniques Num. of
attributes
Performance
ROC F-Measure
kNN Original 56 0.597 0.368
IG 54 0.529 0.609
SU 54 0.529 0.609
CB 54 0.529 0.609
CH 54 0.529 0.609
DPSORS 54 0.423 0.65
Naïve Bayes
Original 56 0.635 0.713
PCA 25 0.674 0.468
IG 54 0.635 0.713
SU 54 0.715 0.6
CB 54 0.635 0.713
CH 54 0.635 0.713
DPSORS 54 0.714 0.6
Table-10. Results for attribute selection methods with liver datasets.
Classifier Techniques attributes Num. of Performance
ROC F-Measure
kNN
Original 6 0.63 0.629
PCA 5 0.624 0.641
IG 1 0.568 0.576
SU 1 0.568 0.576
CB 6 0.640 0.544
CH 1 0.568 0.576
DPSORS 6 0.63 0.629
Naïve Bayes
Original 6 0.64 0.544
PCA 5 0.619 0.51
IG 1 0.579 0.566
SU 1 0.579 0.566
CB 6 0.630 0.629
CH 1 0.579 0.566
DPSORS 6 0.64 0.544
Table-9 shows that the ROC and F-Measure on Lung Cancer dataset. We observed that the highest ROC for kNN is 0.633 with 25 attributes and F-Measure value is 0.65 with 54 attributes. While for Naïve Bayes classifier, the highest ROC is 0.715 and F-Measure value is 0.713 both with 54 attributes.
Table-10 shows that the ROC and F-Measure on Liver dataset. We observed that the highest ROC for kNN is 0.640 with 6 attributes and highest F-Measure value is 0.641 with 5 attributes. While for Naïve Bayes classifier,
Table-11. Results for attribute selection methods after PCA reduction with audiology datasets.
Classifier Techniques attributes Num. of Performance
ROC F-Measure
kNN
IG 46 0.910 0.728
SU 45 0.900 0.717
CB 47 0.907 0.722
CH 47 0.738 0.911
DPSORS 63 0.908 0.731
Naïve Bayes
IG 46 0.934 0.647
SU 45 0.934 0.642
CB 47 0.934 0.651
CH 47 0.93 0.651
DPSORS 63 0.927 0.663
Table-12. Results for attribute selection methods after PCA reduction with Pima diabetes datasets.
Classifier Techniques attributes Num. of Performance
ROC F-Measure
NN
IG 8 0.65 0.698
SU 8 0.65 0.698
CB 8 0.65 0.698
CH 8 0.65 0.698
DPSORS 6 0.607 0.654
Naïve Bayes
IG 8 0.819 0.76
SU 8 0.819 0.76
CB 8 0.819 0.76
CH 8 0.819 0.76
DPSORS 6 0.803 0.749
We observed from Table-11 the ROC and F-Measure on Audiology dataset. The ROC value is 0.910 with 46 attributes and F-Measure value is 0.911with 47 attributes with kNN classifier. While for Naïve Bayes classifier, the highest ROC is 0.934 for multiple feature subsets andF-Measure value is 0.663 with 63 attributes. For ROC, we have selected feature subset with 45 attributes as it hold higher value of accuracy (74.34%).
Table-12 shows that the ROC and F-Measure on Pima Diabetes dataset. We observed that the highest ROC for kNN is 0.65 and highest F-Measure value is 0.698 with
8 attributes. While for Naïve Bayes classifier, the highest ROC is 0.819 and F-Measure value is 0.76 with 8 attributes.
Table-13 shows that the ROC and F-Measure on Breast Cancer Wisconsin dataset. We observed that all selection method produce same ROC and F-Measure values with kNN classifier. The ROC is 0.976 and the F-Measure is 0.959 with 7 attributes. While for Naïve Bayes classifier, the highest ROC is 0.989 and F-Measure value is 0.962 with 7 attributes.
Table-13. Results for attribute selection methods after PCA reduction with breast cancer datasets.
Classifier Techniques attributes Num. of Performance
ROC F-Measure
kNN IG 7 0.976 0.959
CB 7 0.976 0.959
CH 7 0.976 0.959
DPSORS 7 0.976 0.959
Naïve Bayes
IG 7 0.989 0.962
SU 7 0.989 0.962
CB 7 0.989 0.962
CH 7 0.989 0.962
DPSORS 7 0.989 0.962
Table-14. Results for attribute selection methods after PCA reduction with heart datasets.
Classifier Techniques attributes Num. of Performance
ROC F-Measure
kNN
IG 9 0.781 0.785
SU 9 0.781 0.785
CB 12 0.758 0.76
CH 9 0.781 0.785
DPSORS 11 0.815 0.818
Naïve Bayes
IG 9 0.869 0.814
SU 9 0.869 0.814
CB 12 0.87 0.825
CH 9 0.869 0.814
DPSORS 11 0.869 0.836
Table-14 shows that the ROC and F-Measure on Heart dataset. We observed that the highest ROC for kNN is 0.815 and highest F-Measure value is 0.818 with 11 attributes. While for Naïve Bayes classifier, the highest ROC is 0.87 with 12 attributes and F-Measure value is 0.836 with 11 attributes.
Table-15 shows that the ROC and F-Measure on Parkinson dataset. We observed that the highest ROC for kNN is 0.874 and highest F-Measure value is 0.888 with 7
attributes. While for Naïve Bayes classifier, the highest ROC is 0.775 with 7 attributes and F-Measure value is 0.687 with 5 attributes.
Table-16 shows that the ROC and F-Measure on Lung Cancer dataset. We observed that the highest ROC for kNN is 0.576 with 24 attributes and highest F-Measure value is 0.688 with 25 attributes. While for Naïve Bayes classifier, the highest ROC is 0.754 with 12 attributes and F-Measure value is 0.723 with 25 attributes.
Table-15. Results for attribute selection methods after PCA reduction with Parkinson datasets.
Classifier Techniques Num. of
attributes
Performance
ROC F-Measure
kNN
IG 7 0.874 0.888
SU 7 0.874 0.888
CB 7 0.874 0.888
CH 7 0.874 0.888
DPSORS 5 0.823 0.871
Naïve Bayes
IG 7 0.774 0.639
SU 7 0.774 0.639
CB 7 0.775 0.639
CH 7 0.774 0.639
Table-16. Results for attribute selection methods after PCA reduction with lung cancer datasets.
Classifier Techniques attributes Num. of Performance
ROC F-Measure
kNN
IG 24 0.5 0.684
SU 24 0.576 0.684
CE 24 0.5 0.684
CS 25 0.57 0.684
DPSORS 25 0.565 0.688
Naïve Bayes
IG 24 0.601 0.679
SU 24 0.601 0.706
CE 24 0.601 0.679
CS 25 0.604 0.679
DPSORS 25 0.754 0.723
Table-17. Results for attribute selection methods after PCA reduction with liver datasets.
Classifier Techniques attributes Num. of Performance
ROC F-Measure
kNN
IG 1 0.568 0.576
SU 1 0.568 0.576
CB 5 0.624 0.641
CS 1 0.568 0.576
DPSORS 5 0.624 0.641
Naïve Bayes
IG 1 0.579 0.566
SU 1 0.579 0.566
CB 5 0.619 0.51
CS 1 0.579 0.566
DPSORS 5 0.619 0.51
Table-17 shows that the ROC and F-Measure on Liver dataset. We observed that the highest ROC for kNN is 0.624 and highest F-Measure value is 0.641 with 5 attributes. While for Naïve Bayes classifier, the highest ROC is 0.619 with 5 attributes and F-Measure value is 0.566 with 1 attributes.
Clearly the classifier results with higher ROC and F-Measure reflect the usage of selected attribute from feature selection methods. However for some results, more that one ROC and F-Measure performance analysis
produce the same highest value. These values produce the similar total number of selected attributes but with different features subsets. To strengthen the output, we run this similar total number of attributes but with different feature subsets with Naïve Bayes classifier to obtained optimal results. With this it enable us to obtain the optimal dimensionality of the feature subsets.
The top ranking features for further predictive analysis are presented in Table-18.
Table-18. Results for attribute selection methods.
Datasets Attributes Original Selected attributes
Top ranking attribute numbers
based on ROC values
Appendicitis 7 1, 2 ,3
Audiology 69 1-8, 11,12,14-20, 24-27, 29, 31, 33, 34,37-41,43,44,50-67, 69
Breast Cancer 9 1-7
Heart 13 1-3, 7-13
Parkinson 22 1-22
Lung Cancer 56 1-25
Liver 6 1-6
Top ranking attribute numbers
based on F-Measure values
Appendicitis 7 1, 2, 3
Audiology 69 1-8, 10, 11, 13-20, 24-27, 29, 32, 33, 37-40, 43, 47-63
Pima Diabetes 8 2, 6, 7, 8
Breast Cancer 9 1-7
Heart 13 1-13
Parkinson 22 1-22
Lung Cancer 56 1-25
Liver 6 1-5
CONCLUSIONS
In this paper, we carried out a comparative study of six feature selection methods that could help in finding the optimal feature subsets. Benchmarking of this feature selection methods was carried out by applying two classifier models. The results obtained by the current work effectively support the facts that feature selection help in increasing the classifier performance with existence of minimum number of features. However, no single feature selection methods that best satisfy all datasets and learning algorithms. This will simplify by assumption that features are independent for a given class variable.
Future work should compare between selected feature in this study and the associated learning algoritms with regards of accuracy.
REFERENCES
Han, J. and Kamber, M. 2006. Data Mining: Concepts and Techniques. 2nd edition. Morgan Kaufmann, San
Francisco, CA.
Almuallim, H. and Dietterich, T. G. 1994. Learning boolean concepts in the presence of many irrelevant features. Artificial Intelligence, vol. 69, no. 1-2, pp. 279-305.
Koller, D. and Sahami, M. 1996. Toward optimal feature selection. In Proceedings of the Thirteenth International Conference on Machine Learning, pp. 284-292.
Hall, M. A. and Smith, L. A. 1997. Feature Subset Selection: A Correlation Based Filter Approach, In 1997 International Conference on Neural Information Processing and Intelligent Information Systems, pp. 855-858.
Ashraf, M, Chetty, G. and Tran, T. 2013. Feature selection techniques on thyroid, hepatitis, and breast cancer datasets. International Journal on Data Mining and Intelligent Information Technology Applications (IJMIA), vol. 3, no. 1, pp. 1-8.
Ramaswami, M. and Bhaskaran R. 2009. A study on feature selection techniques in educational data mining. Journal of Computing 1(1): pp. 7-11.
Aggarwal, M. and Amrita. 2013. Performance Analysis of Different Feature Selection Methods in Intrusion Detection. International Journal of Scientific and Technology Research, vol. 2, no. 6.
Phadikar, S., Sil, J. and Kumar Das, A. 2013. Rice diseases classification using feature selection and rule generation techniques. Computers and Electronics in Agriculture, vol. 90, pp. 76–85.
Lavanya, D. and Usha Rani, K. 2011. Analysis of feature selection with classification: Breast cancer datasets, Indian Journal of Computer Science and Engineering (IJCSE), October.
Nahar, J., Imam, T., Tickle, K. S. and Chen, Y. P. 2013. Computational intelligence for heart disease diagnosis: a medical knowledge driven approach, Expert Systems with Applications, 40 (2013) 96-104.
Shilaskar, S and Ghatol, A. 2013. Feature selection for medical diagnosis: evaluation for cardiovascular diseases, Expert Systems with Applications 40 (2013) 4146-4153.
Wang, X., Yang, J., Jensen, R. and Liu, X. 2006. Rough set feature selection and rule induction for prediction of malignancy degree in brain glioma, Computer Methods and Programs in Biomedicine 83, 147-156.
Jothi, G. and Inbarani, H.H. 2012. Soft Set Based Feature Selection Approach for Lung Cancer Images. International Journal of Scientific Engineering and Research 3(10), 1-7.
Polat, K and Gunes, S. 2007. Medical decision support system based on artificial immune recognition immune system (AIRS), fuzzy weighted pre-processing and feature selection, Expert Systems with Applications, 33 484-490.
Abraham R., Simha J. B. and Iyengar S. S. 2009. Effective Discretization and Hybrid feature selection using Naïve Bayesian classifier for Medical data mining, International Journal of Computational Intelligence Research, Vol.5, No.2.
Chen. HL., Yang, B., Liu, J. and Liu, DY. 2011. A Support Vector Machine Classifier with Rough Set-Based Feature Selection for Breast Cancer Diagnosis, Expert Systems with Applications 38, 9014-9022.
Sayes, Y., Inza, I. and Larranaga, P. 2007. A review of feature selection techniques in bio-informatics, Bio-informatics vol. 23, no. 19, pp. 2507-2517.
Chung YY. and Wahid, N. 2012. A hybrid network intrusion detection system using simplified swarm optimization (SSO), Applied Soft Computing, 12, pp. 3014-3022.
Jabbar, M. A., Deekshatulu, B. L. and Chandra, P. 2013. Heart Disease Classification using Nearest Neighbour Classifier with Feature Subset Selection, Annals. Computer Science Series, vol 11.