ISSN:1992-8645 www.jatit.org E-ISSN:1817-3195
EXTENSION OF PACMAD MODEL FOR USABILITY
EVALUATION METRICS USING GOAL QUESTION
METRICS (GQM) APPROACH
1
ASHRAF SALEH,
2ROESNITA BINTI ISAMIL,
3NORASIKIN BINTI FABIL
1PhD Candidate, Faculty of Science and Technology, Universiti Sains Isalm Malaysia 2Senior Lecturers, Faculty of Science and Technology, Universiti Sains Isalm Malaysia 3
Senior Lecturers, Faculty of Science and Technology, Universiti Sains Isalm Malaysia E-mail: [email protected] , [email protected] , [email protected]
ABSTRACT
Usability measurement is tedious work, particularly for current smart mobile devices. With an increasing capacity for greater user interactivity through a range of tasks and in a variety of contexts during time, the importance and impact of mobile device context-of-use components is of particular interest to researchers. PACMAD was introduced as comprehensive usability model for mobile applications to evaluate usability based on usability factor; user, context of use, and task. PACMAD model identified the usability attributes without considering related low level metrics which represents each attribute. Thus, there is a need to be extended to include relative low level metrics in addition to usability attributes. This motivates us to performed comprehensive literature revise to collect studies that evaluate mobile applications in order to find validated usability evaluation metrics based on PACMAD model attributes by applying Goal Question Metrics (GQM).
Keywords: Usability Evaluation, Usability Metrics, Mobile Usability, GQM, PACMAD
1. INTRODUCTION
The usability of mobile applications, through which the human interacts with the mobile device, has become a challenging and critical research area. Principally as a consequence of the adoption of the ISO9126, many recent studies have focus upon the inspection of the User Interface (UI) quality attributes (e.g., [1];[2];[3]). This is a continuous demand. For example, phones and tablets that use Apple's iOS (iPhone, iPod Touch, and iPad), Google's Android architecture, Blackberry's operating system, HP's web OS, and Windows® Phone 7 mobile operating system all offer diverse UI design approaches. Research is needed so that evolving challenges can be solved, and newly developed UIs evaluated.
This study investigated two mobile usability aspects; usability evaluation; and usability metrics. Usability is a quality of a product or system. It refers to the extent to which it allows people’s easy and quick accomplishment of their tasks and goals. It applies to every part, aspect, and feature of the product with which the users interact with (e.g., software, hardware, icons, and menus). It was
assessed via set of objective, specific and pre-established usability markers often called usability metrics. The UE’s primary goal is to identify the core issues in the user interface that may lead to human error, terminate the user interaction with the system and cause user frustration [4]. In brief, it seeks to assesses usability and explicitly recognize usability problems [5].
2. STUDY BACKGROUND
ISSN:1992-8645 www.jatit.org E-ISSN:1817-3195
product or a system. In case of product or system failed to assure utility, means that the system does not offer the needed functions. Therefore, the usability of the system became excessive in the absence of utility. Finally, based on [8], usability had three broad dimensions: effectiveness, efficiency and satisfaction. The efficiency attribute was about the ability of the software (in their case, browsing) to meet the client’s requirements. That is, Nielsen’s utility was one of [6] and [8] usability criteria.
2.1 Nielsen’s Usability Model
[image:2.612.320.516.138.272.2]Nielsen [5] identified five usability attributes. These were: Efficiency (user achievement goals in completeness and accuracy); Satisfaction (Comfort and positivity towards the user interaction of the system); Learnability (easy-to-learn and use system); Memorability (easy to remember and easy to use system); and Errors (low error rate, and easy error recovery). Learnability should apply to first-time users, and memory should apply to infrequent users. . A sketch of this model can be observed in Figure 1.
Figure 1,“Nielsen’s Usability and Utility Models”
2.2 ISO 98 on Usability
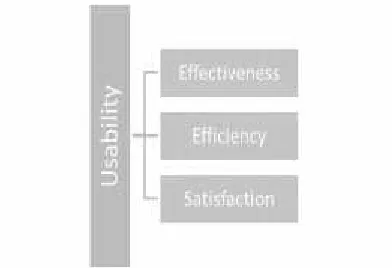
The ISO98 [9]; [10] defined usability as the “extent to which a product can be used by specified users to achieve specified goals with effectiveness, efficiency and satisfaction in a specified context of use”. The ISO98 further identified usability factors that should be taken into account, these were: User (interacting person); Goal (intended outcome); and Context of use (matching between users, tasks, tool used, and environment).Each one of these factors bears an impact on the overall design of the product. Specifically, it affects on user interaction with system. In order to measure how much that the system is usable (usability), the ISO mentioned three usability attributes: Effectiveness (reflects completeness and accuracy of goal achievement);
[image:2.612.106.255.385.512.2]Efficiency (resources utilized to effectiveness); and Satisfaction (comfort, and positive user interaction system using).
Figure 2,“ISO98’s Usability Definition”
2.3 The Harrison’sPACMAD Usability Model Harrison [11] argued that mobile devices require specific usability models. They thus developed the PACMAD. The aim of their model was extending existing usability models, such as Nielsen’s or the ISO, to the context of mobile applications. For example, they argued that, during the application development, additional functionality services can be appended to a software application in order to allow user more accomplishment with the application. However, when it comes to mobile devices, this additional functionality increases the software complexity. Thus, the user’s primary goal became difficult to accomplish via the device. The PACMAD model has seven components. For each, the authors offer definitions, measures, and associations. The first component amounts to Effectiveness [11]; [12]; is user ability to achieve a task in a specified context. normally, this attributes can be measured by evaluating whether users can achieve a set of specified tasks. The second component amounts to Efficiency [11]; [12]. It is the user’s ability to achieve their task in a manner of accuracy and speed. Efficiency reflects the productivity of a user while using the application. Its measures are numerous, and include: the time spent from the stat until the completion of the task; and the number of keystrokes required for the completion of a given task.
ISSN:1992-8645 www.jatit.org E-ISSN:1817-3195
The fourth component is Learnability [11]. It is the level of easiness with which a user can get proficiency with application using in a manner of time. It indicates to time it takes a user to be familiar with application effectively. Measuring it involves assessing how long a user takes to reach a level of proficiency, during the performance of a task the user had never performed before. Their 2013 study [11] observed that learning how to use a novel mobile application took users an average of 5’ or less. Since there are numerous available applications on mobile platforms, users may simply select a different task when encountering difficulties with their first application choice. This was the reason that led the authors to introduce this component on their model, as Nielsen had suggested before them. The fifth is Memorability [12]. It is
about the users’ capability to keep how to
effectively use an application, without needing to relearn how to use it after a long inactivity period. It can be measured in a longitudinal study with two repeated observations. For the first observation, hereby Proficiency, the users’ proficiency at a series of tasks is evaluated. The second observation, hereby Re-use, should take place after a long pre-specified period of inactivity. During Re-use, the users’ performance for the tasks performed during Proficiency is re-assessed.
This was an important component because the software might not be used on a standard base. Indeed, the authors observed that almost 50% of the applications were used only once a month, and this was classified as an infrequent use. This involved long inactivity period that could affect the users’ recollection of how the application worked, of how it was to be used. Therefore, they decided to include Nielsen’sMemorability attribute in their model. The sixth component is errors [11].This component is about how error-free the software utilization is for both the user and the developer; and about how quickly and easily the software recovers from eventual errors. It reflects how well the user can complete the given task. Its evaluation should involve the registry of the nature of the error, and its occurrence frequency. That is, it can be measured through an error rate assessment. This is an important measure. For one, the rate may be used to deduce the system simplicity. Low error rates imply simpler systems. Secondly, the error registry allows developers to address each error in future software versions, with the objective of preventing their occurrence and making the version simpler. This component was drawn from Nielsen’s [7] usability model, and expanded to include the error-free users’ utilization experience.
ISSN:1992-8645 www.jatit.org E-ISSN:1817-3195
Figure 3,“PACMAD usability model”
3. USABILITY MEASUREMENT MODEL There are a different usability measurements models; for instance, Quality in Use Integrated Measurement (QUIM) QUIM Model developed by [14] as consolidated model for usability measurement. QUIM is constructed in hierarchal organization relies on usability factors decomposition into factors level, the factors decomposed into sets of criteria, those usability criteria being decompose for the final level into related metrics. QUIM model include 10 usability factors, but QUIM is not optimal yet and need validation. Metrics for Usability Standards in Computing (MUSiC) developed by [15]; [16], MUSiC identified metrics related to performance measurement of software usability. However, performance measure based on user of usability evaluation cannot precisely indicate for usability attributes, such as Learnability and satisfaction. The Software Usability Measurement Inventory (SUMI) questionnaire method developed by [17], SUMI is a questionnaire method for quality assessment of use of software, and it is consider as assistant in detection of usability issues before software launching. Automated Interface Designer and Evaluator (AIDE), developed by [18], AIDE is usability tool developed in order to evaluate websites based on a set of predefined HTML design guidelines. The Diagnostic Recorder for Usability Measurement (DRUM), developed by [16], DRUM is software analyzer tool for user interaction data, DRUM processor performs metrics calculation for efficiency, effectiveness, help and search time, and task time. Based on revised literature, usability evaluation models still limited and restricted due to designer and developer who are not interested in area of human computer interaction and find drawbacks in applying [18].
4. REVIEW OF GQM APPROACH
Goal Question Metric GQM developed by [19] model is a hierarchy formation starting with a goal, the goal refinement starting with demonstrate goal into sets of questions before developing metrics for each question. GQM paradigm consider as mechanism for defining and interpreting software measurement, it represent systematic approach for integrating goals with software process and quality perspective based upon the specific needs of the
project. GQM model requires specifying the goals for itself and project, trace those goals to the data that are intended to define these goals operationally, and provides a framework for interpreting the data to understand the goals. The flow from goals to the metrics in the GQM model can be viewed as directed graph from goal definition node to the question node to the metrics node. Based on our revised studies of published Journals there is no publication on using PACMAD model with usability measurement model such as GQM model to develop usability metric for mobile application. Thus, it is strongly needed to explore PACMAD model as comprehensive model and apply GQM measurements in order to develop usability metrics since it is considered as evidenced to be useful in identifying usability metrics and selecting most important metrics
5. STUDY APPROACH
The approach of this study consists of three phases in order to achieve the objectives mentioned earlier. The first phase describes the method of publication selection and previous studies related to usability of mobile application. In the second phase, usability metrics will be developing by referring to metrics gained from literature. Third phase show how GQM guides to develop usability metrics matching those metrics yielded from literature.
5.1 Phase 1: Literature Review
This phase describes the method of publication selection and previous studies related to usability of mobile application. In total, 19 published works were identified and extracted through the included databases in this review after the removal of duplicates; we used the following
key word: “usability evaluation metrics”,
“PACMAD model”, “usability attributes”, “GQM”, "mobile application usability”. The included studies were screened based on the inclusion and exclusion criteria based on the area of our work scope.
ISSN:1992-8645 www.jatit.org E-ISSN:1817-3195
[24]; [25]; [26]. By using usability evaluation methods such as cognitive walkthrough and heuristic, [27] developed usability attributes using heuristic evaluation methods to evaluate the usability, both of methods have made potential to identify usability issues faced by novice and experienced users while focusing on specific user tasks and design guidelines as well. Based on context of use, different usability evaluation method and usability frameworks used to evaluate variety of usability attributes. Thus, mobile application context and objective of the usability study determines and/or help in selection of appropriates usability attributes. Metrics diversity (e.g., task time, task completion in term of speed, and click stream number) have been used to evaluate different usability attributes of specific mobile applications. In this study we adopt usability attributes of PACMAD model, and we collect related metrics from published work which used different usability evaluation methods as mentioned above. Table1 describes the most popular metrics based PACMAD usability attributes in mobile applications.
5.3 Phase 3: GQM Usability Measurement Model GQM approach is consider as success factor by itself; for this reason it is adapted essentially to many different size organizations, that have successfully apply such as Philips, Siemens, and NASA. In this phase, usability metrics for PACMAD usability attributes will be identified using GQM model approach [56]. GQM model is a tree formation starts with identifying goals, the goal refinement starting with demonstrate goal into many questions as last phase before develop metrics for each question [57]. In this paper, GQM adopting
aims to generate a complete set of usability metrics that assist in improving usability attributes. The Goals identified based on usability attributes of PACMAD model, the questions is addressed carefully based on literature mapping with usability metrics, the questions is reviewed and some usability measurement will be answered objectively, but in case of satisfaction attributes questions it will be answered subjectively using the IBM Computer Usability Satisfaction Questionnaires (IBM-CUSQ)
[58], which represented namely in our GQM by Satisfaction Subjective Measure (SM1 to SM19). Table 2 below describes complete GQM model evaluate usability of mobile application based on related metrics identified by finding the representative references obtained from literature.
5.4 Phase 4: Evaluation Experiment
To make sure that our model is valid, effective and reliable we conducted two experiments to test the usability metrics of applications in two different mobile applications. We conduct the experiment to test whether the metrics can be used to collect the usability data. The experiment is divided into two parts; first we collect the objective data through observation, and then we collect subjective data via a CUSQ as 5-points rating scale to assess the user satisfaction from participants on both of mobile applications.
Applications used in this study are two universities portals (mobile version); Universiti Sains Islam Malaysia (USIM) and OUM portal. Both of mobile application installed on Samsung G2, android based. Both of two experiments conducted on the same volunteered participants (N=6), they given set of tasks to be achieved. all participants were asked to complete six tasks, and they were given specific time to explore and learn the application before continue to complete all the tasks.
A. Objective Measurement
Most of usability metrics can be collected but some of them were difficult to collect, for example; the metric “Number of touches”, “Time on page”. Regarding cognitive load objective
Metrics such as “Reaction time”, we have been conducting a regular phone call while the participant achieving experiment tasks. We run T-test for all usability metrics, as shown in table 3, where the Null hypothesis for all metrics:
H0 = there is no difference between USIM and OUM portals experiments.
Table 3: Results for objective measurement
The data for objective measures were collected during usability evaluation and we summarized the data for each of the objective metrics based on extended usability model. The t-test result for Number of Trial (LM4) and Total duration time (EM1); as represented in table 2; indicates for “no significant difference” and fail to reject null hypothesis. The other t-test results proof that there
N=6 Em 1 E m2 L M2 M M2 E M1 C M6 C M7 EF M4 L M4 CL M1 ER M2 USIM Mean 25 7.8 23 9 26. 2
9.3 1.3 1.7 47. 5 0 11. 7 5 0.5 USIM SD 12. 9
15. 2.1 2.3 0.8 0.8 2 32. 1 0 3.5 6 1.26 0.55 OUM Mean 25 6.7 24 7. 30. 2
14 2.1 2.2 60. 8
0.2 14 9.3 0.7
OUM SD
14 14. 3.5 7 0.6 0.8 18. 0.28 7 3.78 0.44
P-V T-test
ISSN:1992-8645 www.jatit.org E-ISSN:1817-3195
are significant differences between two application usability measures.
A. Subjective Measurement
Regarding for subjective metrics, we adopt IBM-CUSQ questionnaire as rating of 5- point scale. The subjective data will measure satisfaction attribute as one of the PACMAD model and it will acts as participant rating for the ease of use and satisfaction about both of experiments application; USIM and OUM.
Table 4: Results for subjective measurments
Subjective Question
USIM Mean
OUM Mean Q1 3.9 3.6
Q2 4.2 3.4
Q3 4.5 3.5
Q4 3.2 3.1
Q5 4.4 4.5
Q6 4.3 4.4
Q7 4.1 4.2
Q8 3.8 3.5
Q9 3.6 3.3
Q10 3.7 3.8
Q11 4.7 3.8
Q12 4.5 4.3
Q13 4.1 3.8
Q14 3.8 3.3
Q15 4.3 3.6
Q16 4.2 3.8
Q17 4.2 3.5
Q18 3.9 3.4
Q19 4.3 3.4
Overall Mean 4.089474 3.694737
A higher score indicates greater satisfaction level for users. Table 4 presents the results of subjective measures.The labels “SQ1 to SQ19” are used to represent each subjective metric.
6. RESULTS AND DISCUSSION
In this study, we have proposed an extended PACMAD Metrics model. In addition to usability attributes defined by Nielsen and ISO, PACMAD model adopt the cognitive load for the first time as a apart of usability model for mobile application. Set of usability metrics addressed using GOM approach, table 2 below describes complete GQM model
evaluate usability of mobile application based on related twenty one metrics identified by finding the representative references obtained from literature. Finally two evaluation instrument task list and user satisfaction questionnaire are developed to collect objective and subjective data for complete usability evaluation. Based on the experiment conducted in this study we gained the most significant usability metrics. Also, figure 4 show PACMAD-GQM representation. The anticipated result is hoped to be a set of usability evaluation metrics to assist mobile application developer in designing more usable mobile application.
7. CONCLUSION
In this study, we have reviewed the current practice of usability measurement and find out with basic usability dimensions represented in PACMAD model in order help mobile application developer in different stages of development process to evaluate the application increasingly. From reviewing the literature we obtained the usability metrics from previous studies and researches, in the mean time, we found out cognitive load metrics to be measured objectively. PACMAD usability attributes is considered as our goals as a part of GQM model, then we have created literature based set of questions and metrics to evaluate mobile application usability. The GQM model applied in this study shown how GQM could be used to develop usability metric. Current studies argued that usability measurement is bit difficult in current work; however, extended PACMAD model is supportive as additional. Conducted experiments on mobile application validate our current work.
REFERENCES:
[1] Ayobami, A. S., Hector, O. P. & Hammed, A. 2012. Current Issues of Usability Characteristics and Usability Testing, Proceedings of the International Conference on Behavioral & Social Science Research (ICBSSR), Kampar, Malaysia, 2 November. [2] Popa, M. 2010. Audit Process during Projects
for Development of New Mobile IT Applications, Informatica Economica, 1, 3, 34-46.
[3] Rabi’u, S., Semiu, A. & Hector, O. P. 2012. Usability characteristics of mobile applications, First International Conference on Behavioural and Social Science Research, Kampar, Perak, Malaysia, November, 2.
ISSN:1992-8645 www.jatit.org E-ISSN:1817-3195
[5] Nielsen, J. & Budiu, R. 2012. Mobile Usability, Berkeley CA: New Riders Press.
[6] Dumas, J. S. &Redish, J. C. 1999. A Practical Guide to Usability Testing, Exeter, Portland, England: Intellect Books.
[7] Nielsen, J. 1993. Usability engineering. Morgan Kaufmann Pub.
[8] Hong, F., Chiu, S. & Huang, D. 2012. A model of the relationship between psychological characteristics, mobile phone addiction and use of mobile phones by Taiwanese university female students. Computers in Human Behavior, 28, 2152–2159.
[9] International Organization for Standardization. 1998. ISO 9241-11, Ergonomic Requirements for Office Work with Visual Display Terminals (VDTs), Part 11: Guidance on Usability, Geneva:Author.
[10] Stary, C. & Stephanidis, C. 2004. User-Centered Interaction Paradigms for Universal Access in the Information Society. Proceedings of the 8th ERCIM Workshop on User Interfaces for All, 3196, Springer, Berlin, Heidelberg, September [11] Harrison, R., Flood, D. & Duce, D. 2013.
Usability of mobile applications: literature review and rationale for a new usability model. Journal of Interaction Science, 1, 1, 1-16. [12] Martin, C., Flood, D., Sutton, D., Aldea, A.,
Harrison, R., Waite, M. 2011. A Systematic Evaluation of Mobile Applications for Diabetes Management. Proceedings of the 13th IFIP TC13 Conference on Human-Computer Interaction (INTERACT) 2011. Portugal, September, 466-469.
[13] Hart, S. G. & Staveland, L. 1988. Development of NASA- TLX (task load index): results of empirical and theoretical research, in Human Mental Workload, P. Hancock and N. Meshkati, Eds., pp. 239–250, North-Holland Press, Amsterdam, The Netherlands.
[14] Seffah, A., Donyaee, M., Kline, R. B., & Padda, H. K. 2006. Usability measurement and metrics: A consolidated model. Software Quality Journal. 14(2), 159-178
[15] Macleod, M., Bowden, R., Bevan, N., & Curson, I. 1997. The MUSiC performance measurement method. Behavior & Information Technology. 16(4-5), 279-293.
[16] Macleod, M., & Rengger, R. (1993). The development of DRUM: A software tool for video-assisted usability evaluation. People and Computers, 293-293.
[17] Kirakowski, J., & Corbett, M. 1993. SUMI: The software usability measurement inventory. British journal of educational technology. 24(3), 210-212.
[18] Hussain, A., & Kutar, M. 2009. Usability metric framework for mobile phone application. PGNet, ISBN, 978-1.
[19] Basili, V., Caldeira, G. and & Rombach, H. D. 1994. The Goal Question Metric Approach. In
J.Marciniak. Encyclopedia of Software Engineering. John Wiley & Sons. New York, USA.
[20] Alfredo, J. S., Oleg, S., Eduardo Aguilar, C. and Marisol, G. 2005. Generation of usable interfaces for mobile devices. In Proceedings of the 2005 Latin American Conference on Human-computer Interaction (Cuernavaca, Mexico), ACM. DOI = http://doi.acm.org/10.1145/1111360.1111408 [21] Webcredible. 2007. 7 usability guidelines
for websites on mobile devices. Webcredible Ltd.
[22] Nokia. 2008. Top 10 Usability Guidelines for Enterprise Applications. Nokia Forum, Nokia Corporation.
[23] Openwave. 2008. Top 10 Usability Guidelines for WAP Applications. Openwave Systems Inc.
[24] Daniel, S. K. S. 2006. Usability guidelines for designing mobile learning portals. In Proceedings of the 3rd international conference on Mobile technology, applications & systems. (Bangkok, Thailand). ACM. DOI = http://doi.acm.org/10.1145/1292331.1292359 [25] Adipat, B. & Zhang, D. 2005. Interface Design
for Mobile Applications, Proceedings of the 2005 Americas Conference on Information Systems, Omaha, Nebraska, USA, August 11-15.
[26] Jun, G. and Tarasewich, P. 2004. Guidelines for handheld mobile device interface design. In Proceedings of the DSI 2004 Annual Meeting (Boston). Northeastern University.
[27] Chan, S., Fang, X., Brzezinski, J., Zhou, Y. and Xu, S. 2002.Usability for Mobile Commerce Across Multiple Form Factors. Journal of Electronic Commerce Research. 3, 3, 187 - 199. [28] Hussain, A., Hashim, N. L., Nordin, N., &
Tahir, H. M. (2013). A METRIC-BASED EVALUATION MODEL FOR APPLICATIONS ON MOBILE PHONES. Journal of ICT. 12, 55-71.
[29] Sauro, J., & Lewis, J. R. 2009. Correlations among prototypical usability metrics: evidence for the construct of usability. In Proceedings of the SIGCHI Conference on Human Factors in Computing Systems. (pp. 1609-1618). ACM. Settings. Houghton Mifflin; New Ed edition. [30] Bautsch -Vtense, H. S., Marmet, G. J., & Jacko,
J. A. 2001. Investigating PDA web browsing through eye movement analysis. In Usability Evaluation and Interface Design: Cognitive Engineering, Intelligent Agents and Virtual Reality (pp. 6-10).
[31] Chittaro, L., & Cin, P. D. 2002. Evaluating Interface Design Choices on WAP Phones: Navigation and Selection. Personal and Ubiquitous Computing, 6, 237-244.
ISSN:1992-8645 www.jatit.org E-ISSN:1817-3195
firms using fuzzy TOPSIS. Int. J. Productivity and Quality Management, Vol. 11, No. 4. Inderscience Enterprises Ltd.
[33] Bederson, B. B., Czerwinski, M. P., & Robertson, G. G. 2002. A Fisheye Calendar Interface for PDAs: Providing Overviews for Small Displays. Technical report (No. #HCIL-2002-09): University of Maryland College Park. [34] Jones, M., Marsden, G., Mohd-Nasir, N., Boone, K., & Buchanan, G. 1999. Improving Web Interaction on small displays. Proceeding of the Eighth International Conference on World Wide Web, Toronto, Canada.
[35] Ebling, M. R., & John, B. E. 2000. On the Contributions of Different Empirical Data in Usability Testing. Proceedings of the Conference on Designing Interactive Systems: Processes, Practices, Methods and Techniques, New York.
[36] Kjeldskov, J., & Stage, J. 2003. New Techniques for Usability Evaluation of Mobile Lessons Learned. In Usability Evaluation and Interface Design: Cognitive Engineering, Intelligent Agents and Virtual Reality (pp. 91-95). New Jersey: Lawrence Erlbaum Associates Inc.
[37] Ziefle, M. 2002. The influence of user expertise and phone complexity on performance, ease of user and Learnability of different mobile phones. Behavior & Information Technology, 21(5), 303-311.
[38] Kim, L., & Albers, M. J. 2001. Web design issues when searching for information in a small screen display. Proceedings of the 19th Annual International Conference on Computer Documentation, Sante Fe, New Mexico, USA. [39] Masoodian, M., & Lane, N. 2003. An empirical
study of textual and graphical travel itinerary visualization using mobile phones. Proceedings of the Fourth Australian user interface conference on User interfaces 2003, Adelaide, Australia Medical Education. 2011; 2:53-55 ISSN: 2042-6372.
[40] Öquist, G., & Goldstein, M. 2002. Towards an Improved Readability on Mobile Devices: Evaluating Adaptive Rapid Serial Visual Presentation. Interacting with Computers, 15(4), 539 558.
[41] Suwita, A., & Böcker:, M. 1999. Evaluating the Usability of the Siemens C10 Mobile Phone Going Beyond Common Practice in Industry. Personal and Ubiquitous Computing, 3(4), 173-181.Systems.International Journal of Human-Computer Studies, 60, 599-620.
[42] Buyukkokten, O., Garcia- Molina, H., Paepcke, A., & Winograd, T. 2002. Efficient Web Browsing on Handheld Devices Using Page and Form Summarization. ACM Transaction on Information Systems, 20(1), 82-115.
[43] Parush, A., & Yuviler-Gavish, N. (2004). Web navigation structures in cellular phones: the depth/breadth trade-off issue. International
Journal of Human-Computer Studies, 60(5), 753-770.
[44] MacKenzie, I. S., & Zhang, S. X. 1999. The design and evaluation of a high performance soft keyboard. Proceedings of the SIGCHI conference on Human factors in computing systems: the CHI is the limit (CHI'99), Pittsburgh, Pennsylvania, USA.
[45] Gulliver, S. R., Serif, T., & Ghinea, G. (2004). Pervasive and standalone computing: the perceptual effects of variable multimedia quality. International journal of human-computer studies, 60(5), 640-665.
[46] Erik W. Anderson. 2012. Evaluating visualization using cognitive measures. In Proceedings of the 2012 BELIV Workshop on Beyond Time and Errors - Novel Evaluation Methods for Visualization -BELIV ’12. ACM Press, New York, New York, USA,1–4. DOI:http://dx.doi.org/10.1145/2442576.244258 1.
[47] Wickens, CD. 2002. Multiple resources and performance prediction. Theoretical Issues in Ergonomics Science, 3(2), 159–177.
[48] Eija Haapalainen, SeungJun Kim, Jodi F. Forlizzi, and Anind K. Dey. 2010. Psycho-physiological measures for assessing cognitive load. In Proceedings of the 12th ACM international conference on Ubiquitous computing - Ubicomp ’10. ACM Press, NewYork, New York, USA, 301. DOI:http://dx.doi.org/10.1145/1864349.186439 5.
[49] Gwizdka, J., & Lopatovska, I. 2009. The role of subjective factors in the information search process. Journal of the American Society for Information Science, & Technology. 60(12), 2452–2464.
[50] Anderson, E. W., Potter, K. C., Matzen, L. E., Shepherd, J. F., Preston, G. A., & Silva, C. T. (2011, June). A user study of visualization effectiveness using EEG and cognitive load. In Computer Graphics Forum (Vol. 30, No. 3, pp. 791-800). Blackwell Publishing Ltd. [51] Gwizdka, Jacek, and Ian Spence. "Implicit
measures of lostness and success in web navigation." Interacting with Computers 19.3 (2007): 357-369.
[52] Brunken, R., Plass, J. L., & Leutner, D. 2003. Direct measurement of cognitive load in multimedia learning. Educational Psychologist, 38(1), 53-61.
[53] R. Meersman, Zahir Tari. 2003. On The Move to Meaningful Internet Systems 2003: OTM 2003 Workshops: OTM Confederated International Workshops, HCI-SWWA, IPW, JTRES, WORM, WMS, and WRSM 2003, Catania, Sicily, Italy, November 3-7, 2003, Proceedings, Volume 2.
ISSN:1992-8645 www.jatit.org E-ISSN:1817-3195
approaches to bringing Internet services to WAP devices. Computer Network, 33, 231-246. [55] Kim, L., & Albers, M. J. (2001). Web design
issues when searching for information in a small screen display. Proceedings of the 19th Annual International Conference on Computer Documentation, Sante Fe, New Mexico, USA. [56] van, E., C. P., Delikostidis, I., & van
Oosterom, P. J. 2008. Field-based usability evaluation methodology for mobile geo-applications. The Cartographic Journal, 45(2), 139-149.
[57] Basili, V., Caldeira, G. and & Rombach, H. D. 1994. The Goal Question Metric Approach. In J. Marciniak. Encyclopedia of Software Engineering. John Wiley & Sons. New York, USA.
[58] Zhang, D. and Adipat, B. 2005. Challenges, Methodologies, and Issues in the Usability Testing of Mobile Applications. International Journal of Human-Computer Interaction, 18, 3, 293–308.
[59] Chen S., Epps J., Ruiz N., Chen F. (2011). Eye activity as a measure of human mental effort in HCI in Proceeding IUI '11 Proceedings of the 16th International Conference on Intelligent User Interfaces (New York, NY: ACM; ), 315– 318
[58] Lewis, J. R. 1995. IBM Computer Usability Satisfaction Questionnaires: Psychometric Evaluation and Instructions for Use. International Journal of Human-Computer Interaction, 7:1, 57-78.
[44] MacKenzie, I. S., & Zhang, S. X. 1999. The design and evaluation of a high performance soft keyboard. Proceedings of the SIGCHI conference on Human factors in computing systems: the CHI is the limit (CHI'99), Pittsburgh, Pennsylvania, USA.
ISSN:1992-8645 www.jatit.org E-ISSN:1817-3195
Table 1: Measurement of usability attribute in mobile application
Usability attribute
Usability metrics Representative references
Efficiency -Time to complete task
-Time duration to finish set of tasks. -Time on each page
[28]; [29]; [30]; [31]; [32] ;[55]; [38]; [36]; [37]; [34]; [39]; [35]; [40].
Effectiveness - Number of Achieved task successfully in time and click stream limit.
-Number of errors occurred during task.
-Number of steps (Number of tasks solved in a time limit).
[28];[29];[33];[34]; [31]; [32];[37];[41];[42]; [35].
Learnability -Time to finish tasks at the first use
-Time duration user training until reaching a level of satisfaction.
- Number of tries to solve task.
-Learning status of several uses (e.g., speed, errors).
[28]; [55]; [43]; [37]; [44].
Memorability - Number of click to finish task - Time to finish task
- Number of pages, and steps used to finish tasks. (after predefined time of none using)
[29]; [44]; [40]; [37].
Errors -Number of errors occurred (e.g., undesired steps, deviating button clicks, wrong answers, percentage of completed task correctly)
[28]; [29]; [31] ; [32]; [45] ; [34]; ;[55]; [38]; [44]; [39];[40].
Satisfaction -Subjective rating of users acceptance toward applications after using application (e.g., levels of agree - disagree, confidence, like - dislike, etc.)
[29]; [33]; [31]; [32]; [45]; [34];[54]; [38]; [50]; [39]; [7]; [41]; [37].
Cognitive Load -Task completion time, task Complexity. -Performance measure (number of errors, level of accuracy, task completion time, and real completion time to an ideal completion time.
-Reaction times (time interval between a task request and the subject's response), delay in response which leads decrease of correct responses rate.
- Request for help or number of times the help of app is accessed between start and end task.
-Time on Help duration time the user spent in help of app if occurred.
[46]; [59];[48] ;[47]; [51]; [49]; [52];[53];[50].
Table 2: GQM for Extended PACMAD usability model.
Goal Questions Q Code Metrics M Code
Efficiency How much time taken to complete given
task?
How long taken on each page included in task?
EQ1 EQ2
Task completion time.
Duration used to finish
given set of tasks.
Duration spent on each
mobile application page.
EM1 EM2 EM3
Effectiveness How many click (touch) to solve task?
How many errors occurred during task? How many steps to finish given task? How many task solved in predefined time?
EQ3 EQ4 EQ5 EQ6
Number of clicks to solve
task.
Number of errors occurred
during task.
Number of steps to finish
given task.
Number of tasks solved in a
time limit.
EFM1 EFM2 EFM3 EFM4
Learnability Is the application easy to learn?
How much time taken the user to learn?
EQ7 EQ8
Time used to accomplish
tasks at the first use of application.
Time spent on training users
until reaching a level of satisfaction,
Number of trials to solve
task.
Learning status of several
uses (e.g., speed, errors).
LM1 LM2 LM3 LM4
Memorability How easy is to re-use the application without
help?
How many task achieved at first use?
EQ9
EQ10
Time to finish task.
Number of pages, and steps
used to finish tasks.
ISSN:1992-8645 www.jatit.org E-ISSN:1817-3195
Errors Is the application help user to recover from
error?
Is the error messages clearly inform user how to recover?
Is the user response easily and quickly to recover errors?
EQ11
EQ12
EQ13
Number of errors occurred
during task.
Number of undesired button
user was clicked e.g. back button.
ERM1 ERM2
Satisfaction How the users feel when using the
application?
Are the users satisfied with the application?
EQ14 EQ15
-Subjective rating of users
acceptance toward
applications after using
application ( e.g., levels of agree - disagree, confidence, like - dislike, etc.)
SM1-SM19
Cognitive Load How much time taken by user to respond?
Is the user achieved all given task within time?
Is the user workload affected by error during task?
Is the user mental effort increased during task?
Is the user performance was stable during tasks?
EQ16 EQ17 EQ18
EQ19 EQ20
Reaction time or delay in
time response.
Number of task completed.
Number of click stream to
finish task.
Task completion time.
Number of errors.
Request for help.
Time on Help duration time
the user spent in help of app if occurred.
[image:11.612.80.526.81.568.2]CLM1 CLM2 CLM3 CLM4 CLM5 CLM6 CLM7