TESTING THE ACCURACY AND WORKING PROCEDURE
OF BRAILLE HAND GLOVE USING A STATISTICAL TOOL
1 Dr.B.L.SHIVAKUMAR, 2M.RAJASENATHIPATHI
1Professor, Department of Computer Applications, Sri Ramakrishna Engineering College, Coimbatore
2
Assistant Professor, Department of Computer Applications, NGM College, Pollachi
E-mail: [email protected],[email protected]
ABSTRACT
This paper presents a development of a system for English text to Braille code conversion in software and implemented as vibration in Braille hand glove. Also the accuracy and working procedure of Braille Hand is tested using IBM SPSS tool. This has been developed for the benefit of deaf and blind people, who prefer to work in computer environment. This invention covers all Braille symbols to equivalent vibrations and produces a new communication media between visual and blind person.
Keywords:Braille, Vibration, Blind And Deaf, Hand Glove, Motor
1. INTRODUCTION
Braille is an important language used by the visually impaired to read and write. It is vital for communication and educational purposes. The Braille code has become the main system for the majority of those blind people who read and write using tactile means, and can be found in many countries around the world. People who have both sight and hearing impairments are known as deaf blind. Because of their impairments they face many problems in their normal daily life. It is particularly difficult for totally deaf and blind people to acquire vital and sufficient information necessary for daily living, compared with sighted hearing people. To obtain information for living, Braille glove vibration method is one device for the benefit of deaf-blind people, who work in computer environment. There are several communication methods that involve tactile sensation, such as Braille-Based Chord Gloves [1], Finger Braille Recognition system [2][6],Braille Printer[3][4],Chording Gloves system[4][10] and the print on palm method[5][7]. However, some problems arise in such conversion, such as lack of privacy for deaf blind people and not suitable for computer environment. The continuous readings in Braille produce swelling in the ankles which cause reading times to be very slow[11],[12]. Also visually impaired person having problem like
long term diabetics often have a condition known’s as “diabetic neuropathy” a circulatory problem causing many of the complications that the diabetics might encounter. Neuropathy causes not only insensitivity in the fingertips and toes; it causes more blindness, kidney failure, heart attacks and other related medical problems [13]. Therefore focus has been on vibration in six different positions which matches to Braille code.
[image:1.612.330.519.497.642.2]
Figure 2 : Braille alphabet
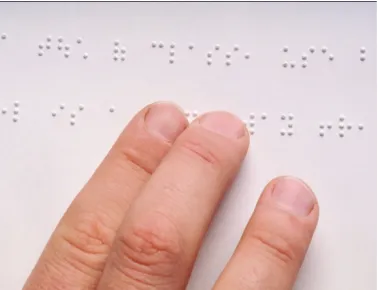
Braille uses a group of six raised dots which are arranged in a matrix of three rows to two columns. These six positions (raised or flat) are
used in combination to give 64 (26) different
Braille characters. This clearly means that there is a one to one correspondence between Braille characters and English text [8][9][13]. If the blind person touches these raised dots, he or she understands the characters of the English Language
[image:2.612.90.289.421.626.2]2. BRAILLE HAND GLOVE SYSTEM
Figure 3: Diagrammatic representation of the system
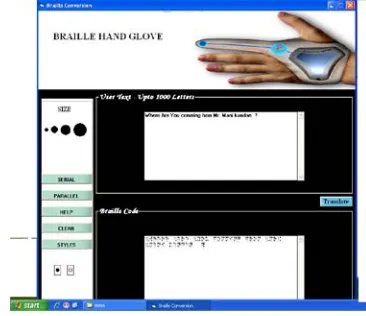
The proposed system is “To design a translator for converting English text to Braille code and this Braille code into vibration signal “. It helps the visually challenged person to communicate easily with others with the aid of software, technology and device. So a new software and hardware algorithms were invented and matched with Braille symbols. It can be diagrammatically represented in Figure 3.The software algorithm was implemented in visual basic as a screen editor; it accepts the user typed information as input and converts input English text to Braille code using Braille database When we convert English text to Braille code then the Braille software algorithm is coded in Visual Basic 6.0 and all 64 Braille symbols are stored in MS ACCESS 2002 Database. So it acts as a Braille database. The coding is compiled and run on one of the Microsoft Windows 32-bit operating systems (Windows '95/'98/ME or Windows NT/XP). When compiled to an executable program, in native code, it resides on a machine as a Windows Dynamic Linked Library (DLL). This is a binary executable that supplies a public interface to the Windows operating system and can thus be utilized by other Windows applications with comparative case. Braille notation of letters, Alphabets and special symbols are downloaded and stored in MS ACCESS 2002 database. The designing of Input and output window of Braille conversion tool is as shown below
Figure 4: Braille Input screen
ENGLISH TEXT BRAILLE
DATABASE
BRAILLE CODE
Input as English Text
Output as
Braille Code Vibration Text to Braille Conversion
Software Algorithm
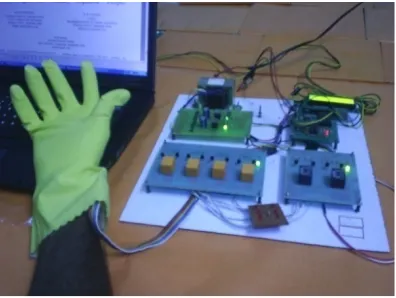
[image:2.612.322.505.484.642.2]The converted Braille code is received by hardware algorithm and is written in HIGH TECH C language. The micro controlling programs controls the vibrations of six Coin type motors and time delay inside the hand glove. The position of vibration inside the Braille hand glove gives clear idea to the blind person, which is equivalent to Braille code.
[image:3.612.326.524.139.288.2]
Figure 5: Braille positions in the Glove
The principle design of the Braille hand glove is based on the six dots of the Braille cell. The six dots forming the cell permit sixty four different patterns of dot arrangements. It is matched with alphabets, numbers and special symbols of the English language. Similarly Braille glove contains six vibration motors which is equivalent to six dots of the Braille cell. These are fixed in five fingers and centre palm (Thumb finger is assigned to Braille value 1, Fore finger is assigned to Braille value 2, Centre finger is assigned to Braille value 3, Ring finger is assigned to Braille value 4, Little finger is assigned to Braille value 5 and centre palm is assigned to Braille value 6) . The basic technique used in the hand glove is based on the ASCII value of English letter from the user typed input in the keyboard. It is linked with a 6 digit binary number value. The presence of 1’s in a binary number activates the corresponding six motors. So based on the position of vibration the
blind person can understand the value of the letter.
Figure 6: Hardware prototype of Braille hand glove
3. TESTING OF THE SYSTEM
3.1 Participants
Ten blind users, two deaf-blind users and ten visible users have participated in this sampling. The average age of participants was 29.07 and ranged from 18 to 45. Participants read at an average rate of 11.13 words per minute with a standard deviation of 37.81 and a range of 22.91 to 26.75. Half of participants learned Braille in public schools, and 13.3% learned Braille from training for few days. Half participants (51%) were completely blind, 13% were less sight in vision, and 5% were visually impaired. To test the accuracy of working principle of hand glove, it is applied to different categories of people as follows:
1. Blind employee 2. Blind student 3. Blind and Deaf 4. Visible Employee 5. Visible student
[image:3.612.92.192.218.449.2]Before starting the experiments both hardware and software steps were clearly explained to the users. School students, college students, employers and lecturers were made use of this experiment .The experiments were conducted based on the following manner.
1. Letters test 2. Digits test 3. Words test
4. Simple Sentence test
A questionnaire was prepared and the answer from the user was recorded.
3.2 Questionnaire For Braille Hand Glove Vibration Testing
The questionnaire was conducted in different places and on different date depending upon the availability of users. Name, age, qualification, Input Question, Answer from the user after using Braille was recorded. . But people without knowledge in Braille feel difficult to recognize the positions in Braille Hand glove. In this case the Braille vibration procedure is repeated several times up to their satisfaction and number of attempts also noted in questionnaire.
3.3 Formation Of Contingency Table
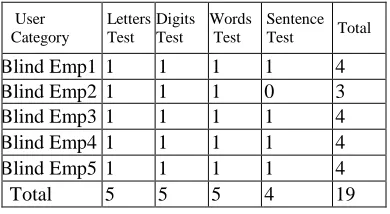
[image:4.612.92.287.563.670.2]The experimental results of 22 different category participants have been recorded in the following table one by one. Here 1 means answer from the participant is right and 0 means wrong answer In Blind Employee group, five users were identified for sampling and all Blind Employee have fundamental knowledge in Braille, so most of them gave right answers. It is tabulated as follows:
Table 1: Blind Employees list
User Category Letters Test Digits Test Words Test Sentence
Test Total
Blind Emp1 11 1 1 1 4
Blind Emp2 11 1 1 0 3
Blind Emp3 1 1 1 1 4
Blind Emp4 1 1 1 1 4
Blind Emp5 1 1 1 1 4
Total 5 5 5 4 19
In Blind Student group, five users were identified for sampling and all Blind Student have fundamental knowledge in Braille but less knowledge about computer fundamentals. All gave right answers except sentence test due to
more number of characters. It is tabulated as follows:
Table 2: Blind students list
User Category Letters Test Digits Test Words Test Sentence Test Total
Blind Student 1 1 1 1 0 3
Blind Student 2 1 1 1 0 3
Blind Student 3 1 1 0 1 3
Blind Student 4 1 1 0 0 2
Blind Student 5 1 1 1 1 4
Total 5 5 3 2 15
In Blind and Deaf Student group, two users were identified for sampling due to less availability and all are with less knowledge in Braille and computer fundamentals. All gave right answers except words and sentence test. It is tabulated as follows:
Table 3: Blind and Deaf students list
User Category Letter Test Digits Test Words Test Sentence Test Total
Blind and Deaf 1 1 1 0 0 2 Blind and Deaf 2 1 1 0 0 2 Total 2 2 0 0 4
In Visible Employee group, five users were identified for sampling and all Visible Employees have no fundamental knowledge about Braille. So all had undergone training for few days, and then test was conducted. All gave right answers except word and sentence test due to more number of characters. It is tabulated as follows
Table 4: Visible Employee list
User Category Letter Test Digits Test Words Test Sentence Test Total
Vis Emp 1 1 1 0 0 2
Vis Emp 2 1 1 1 0 3
Vis Emp 3 1 1 0 0 2
Vis Emp 4 1 1 1 1 4
Vis Emp 5 1 1 0 0 2
Total 5 5 2 1 13
Table 5: Visible students list
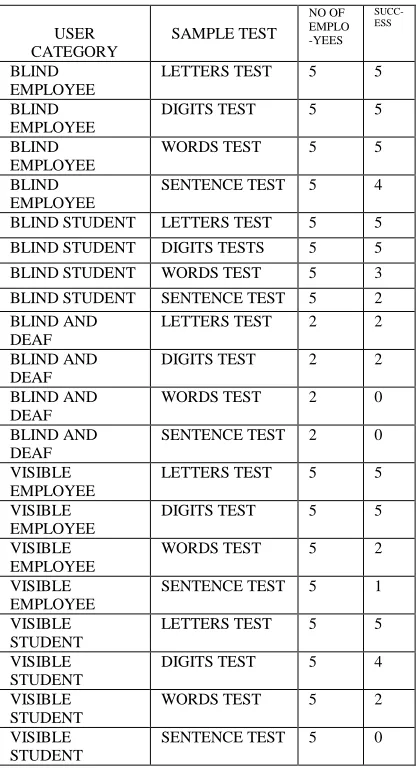
The summary of all 22 users’ results and types of test are tabulated as follows:
Table 6: Table for Users Vs Samples
4. TESTING THE DATA USING STATISTICAL ANALYSIS TOOL
There are several types of statistical test available, but this problem falls in chi square test depending on the way the data was collected and the hypothesis being tested. The simplest case is 2 x 2 contingency table. If we set the 5 x 4 table to the
general notation then it can be solved by
chi-squared test as follows:
4.1 Chi-squared Test Definition:
Chi-squared test is used to assess two types of comparison: tests of goodness of fit and tests of independence.
• A test of goodness of fit establishes
whether or not an observed frequency distribution differs from a theoretical distribution.
• A test of independence assesses whether
paired observations on two variables, expressed in a contingency table are independent of each other.
The first step in the chi-squared test is to calculate the chi-squared statistic. In order to avoid ambiguity, the value of the test-statistic is denoted
by χ2 .The chi-squared statistic is calculated by
finding the difference between each observed and theoretical frequency for each possible outcome,
squaring them, dividing each by the theoretical frequency, and taking the sum of the results. A second important part of determining the test statistic is to define the degrees of freedom of the test. This is essentially the number of observed frequencies adjusted for the effect of using some of those observations to define the theoretical frequencies.
.
Oi = an observed frequency;
Ei = an expected (theoretical) frequency,
asserted by the null hypothesis;
n = the number of cells in the table.
The number of degrees of freedom is calculated as (n-1) x (m-1) where n is the total number of User Category Letters Test Digits Test Words Test Sentence Test Total Visible Student 1
1 1 1 0 3
Visible Student 2
1 1 1 0 3
Visible Student 3
1 0 0 0 1
Visible Student 4
1 1 0 0 2
Visible Student 5
1 1 0 0 2
Total 5 4 2 0 11
USER CATEGORY SAMPLE TEST NO OF EMPLO -YEES SUCC-ESS BLIND EMPLOYEE
LETTERS TEST 5 5
BLIND EMPLOYEE
DIGITS TEST 5 5
BLIND EMPLOYEE
WORDS TEST 5 5
BLIND EMPLOYEE
SENTENCE TEST 5 4
BLIND STUDENT LETTERS TEST 5 5
BLIND STUDENT DIGITS TESTS 5 5
BLIND STUDENT WORDS TEST 5 3
BLIND STUDENT SENTENCE TEST 5 2
BLIND AND DEAF
LETTERS TEST 2 2
BLIND AND DEAF
DIGITS TEST 2 2
BLIND AND DEAF
WORDS TEST 2 0
BLIND AND DEAF
SENTENCE TEST 2 0
VISIBLE EMPLOYEE
LETTERS TEST 5 5
VISIBLE EMPLOYEE
DIGITS TEST 5 5
VISIBLE EMPLOYEE
WORDS TEST 5 2
VISIBLE EMPLOYEE
SENTENCE TEST 5 1
VISIBLE STUDENT
LETTERS TEST 5 5
VISIBLE STUDENT
DIGITS TEST 5 4
VISIBLE STUDENT
WORDS TEST 5 2
VISIBLE STUDENT
[image:5.612.85.295.339.723.2]rows and m is the total number of columns in the contingency table.
The goodness of fit test uses the chi-square distribution to determine if a hypothesized probability distribution for a population provides a good fit. Acceptance or rejection of the hypothesized population distribution is based upon differences between observed frequencies in a sample and the expected frequencies obtained under null hypothesis.
4.2 Decision Rule:
Accept H0 if χ
2
<= χ2α(n-1) x (m-1) and reject χ2 >= χ2
α(n-1) x(m-1) where
Calculated value of chi-square obtained on using
above formula and χ2α (n-1) x (m-1) is the
tabulated value of chi-square for (n-1) x (m-1)
degree of freedom and level of significance α
where n is the number of rows and m is the number of column in the contingency table.
5. CHI-SQUARE TEST USING IBM SPSS TOOL
SPSS stands for Statistical Package for the Social Sciences. This tool can be used to analyze data collected from surveys, tests, observations etc. It calculates chi-square test, Regression test, Non parametric test, Descriptive etc., Here it calculates the chi-square test very accurately and compare the result with tabulated value and produce various reports like bar chart, frequency, cumulative percentage ,data comparison etc.,
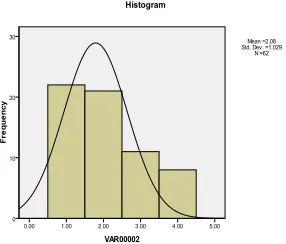
5.1 Frequency:
[image:6.612.324.515.105.233.2]The frequencies of experiment values are derived from SPSS tool as follows. The frequency boundary 15 to 20 shows the Braille hand glove is best fit for any category person. Here it is fit for blind Employer and Blind Student rather than visible person and Blind and deaf. Here frequency is calculated as adding all test categories, i.e. sum of letters test, digits test, words test and sentence test
Figure 7: Bar chart for Braille User Frequency
5.2 Success rate:
The success rate of experiment applied to users with test data is calculated as follows. The letters and digits are easily recognized by both visible and blind person in vibration hand glove. Lengthy text can be easily handled by blind persons rather than visible person due to less knowledge about Braille. It is graphically represented as follows:
Figure 8: Bar chart for Cumulative percent for Braille sample values
[image:6.612.351.494.404.526.2]Figure 9: Bar chart for Braille users VS Braille Tests
5.3 Experimental Results and Discussion
A value of χ2 cannot be evaluated unless the number of degrees of freedom associated with it is known. The expected value is calculated from contingency table 6.8 as follows:(Column total x row total) / Grand total ie 22 x 19 / 62 = 6.7.similarly for other expected values are calculated .
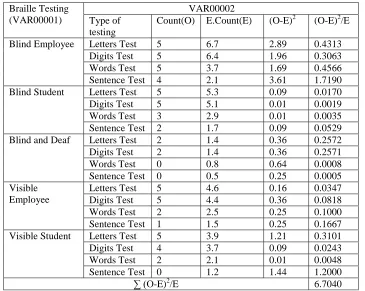
[image:7.612.125.490.438.729.2]Step: 1. Calculation of chi-square test from Contingency table (Table 6.8)
Table 7 Cross tabulation for Braille users
Braille Testing (VAR00001)
VAR00002 Type of
testing
Count(O) E.Count(E) (O-E)2 (O-E)2/E
Blind Employee Letters Test 5 6.7 2.89 0.4313
Digits Test 5 6.4 1.96 0.3063
Words Test 5 3.7 1.69 0.4566
Sentence Test 4 2.1 3.61 1.7190
Blind Student Letters Test 5 5.3 0.09 0.0170
Digits Test 5 5.1 0.01 0.0019
Words Test 3 2.9 0.01 0.0035
Sentence Test 2 1.7 0.09 0.0529
Blind and Deaf Letters Test 2 1.4 0.36 0.2572
Digits Test 2 1.4 0.36 0.2571
Words Test 0 0.8 0.64 0.0008
Sentence Test 0 0.5 0.25 0.0005
Visible Employee
Letters Test 5 4.6 0.16 0.0347
Digits Test 5 4.4 0.36 0.0818
Words Test 2 2.5 0.25 0.1000
Sentence Test 1 1.5 0.25 0.1667
Visible Student Letters Test 5 3.9 1.21 0.3101
Digits Test 4 3.7 0.09 0.0243
Words Test 2 2.1 0.01 0.0048
Sentence Test 0 1.2 1.44 1.2000
∑ (O-E)2
Step: 2 Calculation of Tabulated value
Table 8: Chi-square Tabulated value for Braille users
Chi-square Value
Degree of Freedom
1%LS 2%LS 5%LS 10%LS 20%LS
Tabulated Value
6.704 12 26.22 24.05 21.02 18.55 15.81
The final result is:
Degrees of freedom = (n-1) x (m-1) where n is the number of rows and m is the number of columns in the contingency table.
In this Contingency table
Degrees of freedom = (n-1)x(m-1) = (5-1)x(4-1)
= 12
The tabulated χ20.05 for 12 degrees of freedom ie
χ2
α(n-1) x(m-1)= =21.02.
So the final results are : χ2
=6.704 χ2
α(n-1) x (m-1) =21.02
According to decision rule
Accept H0 if χ2 <= χ2α(n-1) x (m-1) and reject
χ2 >= χ2
α(n-1) x(m-1)
Since calculated value of χ2 is less than the tabulated value i.e. 6.704 < 21.02
We conclude that it is not significant and the null hypothesis is accepted at 5% level of significance’s that Braille hand glove is working with good results and best suited device for blind people..
6. CONLUSION
The statistical analysis of Braille glove reports that it is a suitable kit for blind people because they start their educations with Braille code notations. At the same time it is little difficult for visible and deaf and blind people, because the vibration is initially felt difficult to recognize the six positions inside the hand glove, but once they get experience or few reputations, anyone can use this system for effective communication purpose. Most of the blind users feel that no significant is found between the
Braille cell position inside the glove and Braille impressed sheet. The Braille code vibration process is a single step and the data transfer rate is normal and it is controllable. It is the best tool for visually impaired people to have more accurate sensing, low error rate, small electronic product and it proposes a new approach to blind persons to know about computer oriented technologies.
REFERENCES:
[1] David Fisher and Ward Bond, “A Single handed Braille chord system for computer
keyboard input” IEEE Transactions on
Rehabilitation Engineering, Vol. 3, No.
7,1994, pp. 1083-1138.
[2] Manabi Miyagi and Masafumi Nishid,” Analysis of prosody in Finger Braille using
electromyography”, Proceedings of 28th
IEEE EMBS Annual international Conference, USA, Aug,30-sept
3,2006,pp.40-44.
[3] Anupam Basu and soumitro Banerjee,“A Pc based Braille library system for the
sightless”, IEEE Transactions on
Rehabilitation Engineering, Vol6 No1,
March 1998,pp.123-129.
[4] Blenkhorn, Paul, “A System for converting
Print into Braille”, IEEE Transaction on
Rehabilitation Engineering, Vol. 3, No .2,
June 1997, pp.215-221.
[5] Blenkhorn Evans.G, “Automated Braille Production from Word-Processed
Documents”, IEEE Transactions on Neural
Systems and Rehabilitative Engineering, vol.
9, no. 1, 2001, pp. 81-85.
[6] Myung chul cho and jae wook jean,” A pair
of Braille based chord Gloves”,Proceedings
of the 6th international symposium on
Wearable computer,ISWS
[7] Ingham.K.R,” Spelled speech as an output for computers and reading machines for the
blind”, IEEE Transaction, Human Factors
in Electronics, Vol.HFE-8,September
1997,pp.175-181.
[8] Kenneth R Ingham, “Braille, the language,
its machine Translation and Display”, IEEE
Transactions and Man Machine systems,
March 1998, pp 81-86.
[9] S.J.Lederman “The perception of surface
roughness by active and passive touch”,
Bulletin of the Psychonomic Society, Vol.
18, No. 5,1981 pp. 253-255.
[10] Myung-chul cho and Hoo-gon choi, “Pair of
Braille based chord gloves,” IEEE computer
society, March 2002, pp 35-40.
[11] L.Boaz,”Embedded Based Embossing Method for Braille Letters by Braille Binary
Values”, International Journal of
Engineering Research and Applications, Vol
3, No2, 2013, pp.1541-1545.
[12] Deepak kumar and Mohammed Abdul Qadeer, “Mobile Application and E-Classes for Increasing the Availability of Information for Visually Impaired Persons”,
International Journal of Machine Learning
and Computing,Vol 1,No 3,2011,pp.23-29.
[13] Hassan, M.Y. and A.G. Mohammed, “ Conversion of English Character Into Braille
Using Neural Network, International
Journal of Computer Communications and