Development of Mathematics Course Attitude Scale: A
Preliminary Study of Validity & Reliability
Menekşe Eskici1,*, Gökhan Ilgaz2, Osman Tolga Aricak3
1Educational Sciences Department, Faculty of Art and Science, Kırklareli University, Turkey 2Educational Sciences Department, Faculty of Education, Trakya University, Turkey
3Department of Psychology, Faculty of Economics, Administrative, and Social Sciences, Hasan Kalyoncu University, Turkey
Copyright©2017 by authors, all rights reserved. Authors agree that this article remains permanently open access under the terms of the Creative Commons Attribution License 4.0 International License
Abstract
The aim of this research is to develop a Mathematics Course Attitude Scale to measure high school students' attitudes towards mathematics and to test the validity and reliability of this scale. It is also aimed to reveal whether there are significant differences in school students' attitudes towards mathematics according to their gender and mathematics achievement. This research was conducted with 508 volunteer students (198 female, 310 male) studying in five different high schools. One-dimensional scale consisting of 13 items was obtained. Confirmatory factor analysis showed that one factor solution was acceptable. In addition, the internal consistency and composite reliability of the scale were found to be high. We also found that there was a significant and moderate positive correlation between attitude and achievement. It was seen that the average of the attitude points, according to the gender, was very close to each other and the difference was not significant.Keywords
Mathematics Course Attitude Scale,Academic Achievement, Gender
1. Introduction
Mathematics is seen as a tool for the meaning of life (Ernest, 1991). It is also considered an essential to create a good future (Yenilmez, 2010). Due to the decisive role of mathematics in human life, the mathematics course has
taken its place in education programs from the beginning of the school up to higher education (Baykul, 2002).
Mathematics is important for individuals beyond
mathematical knowledge to gain high-level thinking skills such as critical thinking, interpretation, practical thinking,
problem solving, managing the decision-making process
successfully, and academic achievement as well as being
an effective determinant of success in social life (Işık, 2007; MEB, 2009; Moral, Köroğlu & Çelik, 2004). Although the
things that mathematics have brought to individuals are so
well known, It is not a lesson learned in a willing way by
students, but it is accepted as an obligation. When it was
looked at the research trying to explain the reasons for this,
the following are identified as reasons why mathematics
lessons are not liked and therefore failed: The fact that the
students find the mathematics course as an intangible
(Erdem & Young, 2014; Moral, Köroğlu & Çelik, 2004),
the deficiencies caused by the teaching style of
mathematics (Dursun & Dede, 2004; Soylu & Aydın,
2006), not using of teachers various materials in mathematics courses, (Duatepe-Paksu & Akkuş, 2007), concerns about the mathematics course (Baloğlu, 2001; Peker and Mirasyedioğlu, 2003), mistakes in presentation in mathematics textbooks (İskenderoğlu & Baki, 2011; Semperci & Semerci, 2004), memorization pushing because the central examination system in Turkey
encourages students to solve questions by racing over time
(Açıkgül, Macit & Çakan, 2015; Baştürk, 2011; Doğan, Sulak & Cihangir, 2002) students are unable to understand
and are not informed why they should learn mathematics lessons and what is the benefit of mathematics in daily life
(Avcı, Coşkuntuncel & İnandı, 2011).
It is emphasized by Köroğlu and Yeşildere (2004) that
mathematics should be only processed to reach the goals of
the lesson, making it difficult for the students to transfer the skills they have gained through mathematics to their daily
lives. In order to achieve success in mathematics teaching, it is necessary to convince students that mathematics can be used throughout their lives. There is research showing that students' level of mathematics learning is directly proportional to their perceptions of mathematics (Francisco
& Maher, 2005; Hare, 1999; Kramarski & Zoldan, 2008). It is well known that one of the important factors affecting
the academic achievement of the students is their affective properties, because our brain does not try to learn anything
Importance of Attitudes
Individuals feel emotion, something involuntarily, for everything that they encounter in their surroundings, such as objects, events, phenomenon, glances, other individuals etc., as well as anything that comes into their lives. According to the affective neuroscience approach, the brain provides different emotional states by evaluating stimulants (Plotnik, 2009). From this point, it is possible to
reach the conclusion that the biologic structures of the individual are inclined to evaluate and develop emotions
for all kinds of living or non-living beings. These emotional tendencies developed by individuals are
expressed as attitudes (Eagly & Chaiken, 1993; Özgüven,
1994).
As stated by Aronson, Wilson and Akert (2012),
attitudes are assessments of individuals about other creatures, objects, or thoughts. Attitudes arise as a result of
the experience of the individual in relation to the personality traits and cultural values of the entities,
situations, events that interact with them (Oskamp & Schultz, 2005; Titrek, Güneş, & Ölçüm, 2013). Tesser
(1993) states that the source of attitude is the genes. The study by Bouchard and Loehlin (2001) also supports the findings of Tesser (1993) that genes influence personality and behavior. According to Mahanta (2012), attitudes are important determinants of an individual's personality. One of the determinants of attitude as well as genetic factors is
the social milieu (Nowak, Szamrej, & Latané, 1990;
Stedman, 2002). It is emphasized that the social effect, which can be defined as the influence of other people's actions or thoughts on the feelings and thoughts of the individuals, is also the determinant of their attitudes (Wood, 2000). Especially the family, which is the closest vicinity of the individual, in the first year of life, has a great share in
the individual's attitudes (Kulik, 2002). The study by
Francis (1993) found that mothers had more influence over their children's attitudes than fathers.
Attitudes represent not only the affective orientation of person, but also the cognitive aspects of the individual and
show permanent characteristics (Aiken, 2002; Krech & Crutchfield, 1948; Tavşancıl, 2006). Attitudes can be
positive and negative, as well as having a great influence on directing the behavior of people. Relevant and accepting
behaviors are shown when positive attitudes are exhibit,
and irrelevant and refusing behavior are shown when
negative attitudes are fed (Farc & Sagarin, 2009; Holland, Verplanken & Knippenberg, 2002; Temizkan, 2008). If it
is considered that the behavior of the individual leads the world, and behavior are also determined by the attitude, it is better understood important of attitudes for people and society. In order to reach the desired behavior, the development of attitudes in the direction of desired behavior is an educational necessity. Efforts should be
made towards knowing the attitudes of the students and turning them into positive ones in the courses that are aimed to gain the desired behaviors.
In order to be able to direct the attitudes, it should be determined first, and in order to be determined, it should be measured (Tavşancıl, 2006). As discussed above, when one
of the main factors of success in mathematics is thought to be the attitude towards the lesson, it is better understood that it is necessary to measure this attitude correctly first in order to transform the attitudes of the students to the positive direction.
Problem Statement and Sub-Problems (Hypotheses)
The aim of this research is to develop a Mathematics Course Attitude Scale to measure high school students' attitudes towards mathematics and to test the validity and
reliability of this scale. In the context of classical test
theory, validity and reliability studies of this scale have been carried out. It is also aimed to reveal whether there are significant differences in school students' attitudes towards mathematics according to their genders and mathematics achievement.
2. Method
This research is a scale development study.
Method of the Research
In the context of classical test theory, validity and
reliability studies of this scale have been carried out.
Population-sampling
This research was conducted with 508 (198 females, 310 male) volunteer students studying in five different high
schools located in a Northwestern town of Turkey in
2016-2017 academic year. The students selected by convenient sampling technique.
Data Collection Tools
The first form of the scale was formed by adapting the items of "Biology Course Attitude Scale" developed by
Arıcak and Ilgaz (2007) to mathematics lesson. The items
were assessed by the co-author of the research and two mathematics educators in terms of content and language. The necessary corrections were made on the scale in the direction of the suggestions. This scale is 5-point
Likert-type (strongly disagree 1, disagree 2, undecided (neutral) 3, agree 4, and strongly agree 5) scale with 19 items.
Reliability and Validity of Data
In data analysis, the data set was divided into two parts randomly. The scale was divided into 251 and 257
analysis. The data were first examined in terms of
normality. The absence of skewness> 2 and kurtosis> 7
(West, Finch and Curran, 1995) was considered as
normality assumption was met. The extreme values were checked with the Z distribution and the values were found
to be between ±3 standard deviations. Then, extreme values and multicollinearity states were examined by
performing multiple regression with "subject no" given to
participants for extreme values and multicollinearity. It
was assumed that the variance increase values were less than 10, the tolerance values were greater than .10 (Field, 2009). We also found that there was no correlation of .90
and above between variables (Çokluk, Şekercioğlu and Büyüköztürk, 2014). EFA was performed by principal
components analysis. The critical factor load value was
taken as .32 (Büyüköztürk, 2005). Confirmatory factor analysis (CFA) was performed with Maximum Likedhood method and model fit evaluation was done according to χ2 /
degrees of freedom (df), CFA, TLI and RMSEA values. The reference values accepted in Table 1 are presented.
Table 1. Acceptable threshold levels Goodness of
Fit Indexes Values Meaning References χ2 / sd < 5 (Acceptable fit) Marh and Hocevar (1985)
RMSEA
.05 and - (Excellent fit) Kline (2005) Between .05
and .08 (Good fit) (1993), Sümer (2000)Browne and Cudeck Between .05
and .10 (Acceptable fit) Weston and Gore (2006) Between .08
and .10 (moderate fit)
MacCallum, Browne and Sugawara (1996, Akt.:Byrne, 2001) .10 and + (Weak fit) Browne and Cudeck(1993); Sümer (2000) TLI .90 and + (Good fit) Brown (2006) CFI .90 and + (Good fit) Brown (2006)
For convergent validity, it was taken as the reference that the average variance extracted (AVE) was .50 or more (Fornell and Larcker, 1981). As a result of the exploratory
factor analysis for the construct validity, the remaining items on the scale were collected and the attitude scores of
the individuals were obtained and these were ranked. The
scores were grouped in the lower-upper 27%, and the
discriminant validity of each item was examined. This was
done for both samples. Based on the assumption that there was a positive relationship between attitude and achievement, the relationship between scores of first-semester mathematics course grades and total attitude scores was examined. The grouping of students according to their attitude scores was done with the entire study group. The scores were grouped as low, medium, and high by the way of the lower-upper 27% groups. Differences between the group averages were analyzed by one-way ANOVA. The significance level in the independent samples t-test and one-way ANOVA was taken as .05. The effect size in the
ANOVA was calculated with the value of eta-square and it was interpreted as a strong influence with a possible low
between .01 and .05, a moderate between .06 and .13, and a greater than .14 in the direction of Cohen's (1988) suggestions.
Composite Reliability and Cronbach Alpha coefficients were calculated for the reliability of the scale and it was considered to be sufficient to have .70 and over for combined reliability (Bagozzive Yi, 1988), and to be
above .60 for Cronbach Alpha (Özdamar, 2004).
3. Findings
In this section, the findings of the research were reported.
Findings Related to Exploratory Factor Analysis (EFA)
The analysis was performed by principal component analysis. The Kaiser-Meyer-Olkin score of the scale
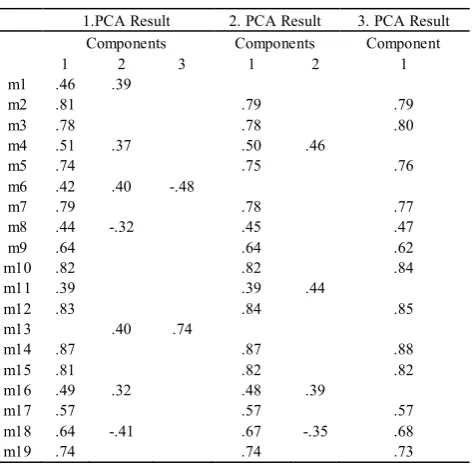
was .94 and the Bartlett sphericity test was 2400.032. According to this, factor analysis was continued because the sample consistency was high and the distribution was spherical. The results of the first factor analysis showed that the items were mainly gathered under one factor. It is seen that items 1 and 6 are placed under more than one factor and item 13 is not under the first factor. These items were removed and the analysis was repeated. As a result of the second analysis, a two-factor scale, in which the items were mainly gathered in the first factor, emerged. As the 4th, 11th, and 16th items were loaded under the second factor, they were removed from the scale and the analysis was repeated. As a result of this analysis, a 13-item, one-dimensional scale was obtained and all the results are presented in Table 2.
Table 2. EFA results
1.PCA Result 2. PCA Result 3. PCA Result Components Components Component
1 2 3 1 2 1
m1 .46 .39
m2 .81 .79 .79
m3 .78 .78 .80
m4 .51 .37 .50 .46
m5 .74 .75 .76
m6 .42 .40 -.48
m7 .79 .78 .77
m8 .44 -.32 .45 .47
m9 .64 .64 .62
m10 .82 .82 .84
m11 .39 .39 .44
m12 .83 .84 .85
m13 .40 .74
m14 .87 .87 .88
m15 .81 .82 .82
m16 .49 .32 .48 .39
m17 .57 .57 .57
m18 .64 -.41 .67 -.35 .68
m19 .74 .74 .73
[image:3.595.55.292.342.497.2] [image:3.595.305.542.504.737.2]Figure 1. CFA results
Findings Related to Confirmatory Factor Analysis (CFA)
The result obtained from EFA was subjected to CFA. As a result of the analysis, it was seen that one-dimensional scale with factor loads ranging from .41 to .85 had
χ2/sd=3.178, CFI=0.913, TLI=0.927, RMSEA=.092 fit
indices. It has been accepted that construct validity is in line with the baseline literature.
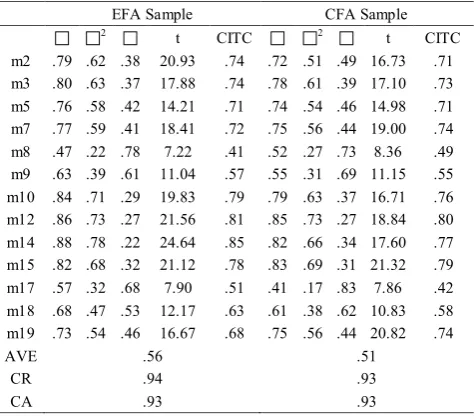
Convergent, Discriminant and Reliability Tests
The results of the calculations made from the sample for both analyzes of the scale show that the AVE value is above .50 and is within the accepted values. For the discriminant of the scale items, the individuals were ranked
according to the total of 13 items, and the lower-upper 27% groups were obtained. In the independent samples t test results, significant results were found in favor of the upper groups in both samples. However, it was found that the corrected total item correlation values were .41-.85 in the EFA sample and .42-.80 in the CFA sample.
In both samples of the scale, the composite reliability and internal consistency reliability coefficients were found to be high.
EFA: Exploratory Factor Analysis, CFA: Confirmatory
Factory Analysis, CITC: Corrected Item-Total Correlation,
AVE: Average Variance Extracted, CR: Composite
Reliability, CA: Cronbach Alpha
Table 3. The results of convergent validity, item discrimination validity and reliability
EFA Sample CFA Sample
2 t CITC 2 t CITC m2 .79 .62 .38 20.93 .74 .72 .51 .49 16.73 .71 m3 .80 .63 .37 17.88 .74 .78 .61 .39 17.10 .73 m5 .76 .58 .42 14.21 .71 .74 .54 .46 14.98 .71 m7 .77 .59 .41 18.41 .72 .75 .56 .44 19.00 .74 m8 .47 .22 .78 7.22 .41 .52 .27 .73 8.36 .49 m9 .63 .39 .61 11.04 .57 .55 .31 .69 11.15 .55 m10 .84 .71 .29 19.83 .79 .79 .63 .37 16.71 .76 m12 .86 .73 .27 21.56 .81 .85 .73 .27 18.84 .80 m14 .88 .78 .22 24.64 .85 .82 .66 .34 17.60 .77 m15 .82 .68 .32 21.12 .78 .83 .69 .31 21.32 .79 m17 .57 .32 .68 7.90 .51 .41 .17 .83 7.86 .42 m18 .68 .47 .53 12.17 .63 .61 .38 .62 10.83 .58 m19 .73 .54 .46 16.67 .68 .75 .56 .44 20.82 .74
AVE .56 .51
CR .94 .93
CA .93 .93
Relationship between Mathematics Attitude and Academic Achievement
In order to support the discriminant validity of the scale,
it was examined whether there was a significant difference
between grade point average of first-semester mathematics course according to the attitudes of the students. Results are presented in Table 4.
Attitude towards Math ,51
m2 e2
,71 ,61
m3 e3
,78 ,54
m5 e5
,73 ,56
m7 e7
,75 ,27
m8 e8
,52
,31
m9 e9
,55
,63
m10 e10
,79
,73
m12 e12
,85
,66
m14 e14
,81
,69
m15 e15
,83
,17
m17 e17
,41
,38
m18 e18
,61
,56
m19 e19
[image:4.595.61.541.80.371.2] [image:4.595.303.541.413.621.2]Table 4. Results of ANOVA related to GPA differences according to level of attitudes
Attitude Level N Mean Standard Deviation 95% Confidence Internal for Mean F p Difference η² Lower Bound Upper Bound
Low 126 41.27 18.62 37.99 44.55
56.61 .00 High > MiddleHigh > Low Middle > Low .18 Middle 200 50.50 16.86 48.15 52.85
High 140 63.14 17.45 60.23 66.06
As the level of attitude increases according to the results of the analysis, the grade point averages of students increases. As a result of the analysis, this increase was found to be highly significant. LSD test revealed significant differences between levels when looking at the
source of difference.
Students' Attitudes towards Mathematics Course According to Their Gender
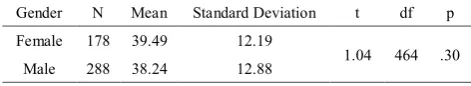
In this research, the relationship between the attitude toward mathematics course with mathematics success and the distribution of attitude according to gender were
examined. As a result of the analysis, there was a
moderately positive significant relationship between attitude and achievement (r = .44, p <.05). When Table 5 is
[image:5.595.56.544.91.167.2]examined, it is seen that the attitude point averages are very close to each other and the difference between genders is not significant.
Table 5. Independent sample t test results for attitude towards mathematics lesson according to gender
Gender N Mean Standard Deviation t df p Female 178 39.49 12.19
1.04 464 .30 Male 288 38.24 12.88
4. Discussion
The aim of this research is to develop attitude scale towards mathematics lesson. Validity and reliability analyses of the scale were calculated and the attitudes of high school students were compared according to academic achievement and gender. In the process of developing the
scale, exploratory and confirmatory factor analyses were
performed for construct validity. Convergent validity, item-discrimination validity and Cronbach alpha were also calculated. All findings were found to be satisfactory.
The Kaiser-Meyer-Olkin value of scale developed for
the study was found to be .94. It is accepted that factor analysis can be applied when the value of Kaiser-Meyer-Olkin is higher than .60 (Büyüköztürk,
2005). The Barlett Test value is found to be 2400.03 (p <.00), indicating that the items of the scale can be factored
(Tavşancıl, 2006). From the results of the
Kaiser-Meyer-Olkin and Barlett test, the factor loads of the scale were examined. As a result of calculating the factor loads, it appears that the factor loads of the items vary
between .47 and .88. It explains the moderate validity when
the item factor loadings are between .30 and .60 and
explains high-level validity when they are between .30
and .60 (Erkuş, 2012; Kline, 2005). When this is
considered, it can be said that the items of the developed scale are accepted as valid at moderate and high level.
CFA results support the finding of EFA. In the one dimensional structure of the scale, lower and higher values of the highest and lowest factor loadings are composed of the same items in the EFA and CFA. It can be said that CFA is compatible with EFA structure when it is considered that the study group is divided into two. On the other hand, only the RMSEA values from the four criteria based on CFA results indicate moderate level concordance. From this point of view, it can be said that the model is
correctly constructed. When we look at the AVE values to
support EFA and CFA results, it can be said that they are at the lower limit of the literature. However, the closeness of the values obtained from EFA and CFA loads is considered as a consistency for construct validity. Reliability values in the study are above the recommended values in the literature. Both groups show that the results are above .90. In this respect, it can be stated that reliability of the scale is high.
In this study, data reveal that academic achievement increases when positive attitudes towards the mathematics increases. When the literature is examined, it is seen that
there is research which supported the findings of this study.
The study by Yücel and Koç (2011) found that the high
school students' attitude towards mathematics was 16% effective in their success. According to the findings of the
study conducted by Savaş, Taş and Duru (2010), it is seen
that the beliefs of the students to be successful in mathematics course affected the mathematical achievements. There are many studies in the literature that support the findings of this research, indicating that the attitudes of students towards mathematics lessons have
affected academic achievement (Akın, 2002; Bulut, Yetkin & Sazak, 2002; Georgiou, Stavrinides & Kalavana, 2007; Kadijevich, 2008; Kanbolat, Bekdemir & Baş, 2011; Ma, 1997; Ma & Kishor, 1997; Ma & Xu, 2004; Mahanta & Islam, 2012; Minato, & Yanase, 1984; Peker & Mirasyedioğlu, 2003; Şentürk, 2010; Reyes, 1984; Reynolds & Walberg, 1992).
[image:5.595.55.291.444.487.2]mathematical achievement. There are also some other studies in the literature that the attitudes of students towards mathematics do not change significantly according
to gender (Bulut, Yetkin & Sazak, 2002; Çelik & Ceylan, 2009; Georgiou, Stavrinides & Kalavana, 2007; McGraw, Lubienski, & Strutchens, 2006; Yücel & Koç, 2011) Hyde,
Fennema, Ryan, Frost and Hopp (1990) emphasizes that students are influenced by attitudes regardless of gender, and gender is not a determining factor here.
Contrary to findings of this research, some studies are in the literature indicating that female students' attitudes towards mathematics are more negative than male students
(Frost, Hyde & Fennema 1994; Gunderson, Ramirez, Levine & Beilock, 2012; Tocci & Engelhard Jr, 1991).There are also some other studies in the literature that show that female students have more positive attitudes
towards mathematics than male students (Akdemir, 2006; Çelik & Bindak, 2005; Linn & Kessel, 1996; Şentürk, 2010; Yenilmez & Özabacı, 2003; Yılmaz, 2006).
5. Conclusions
Data reveal that preliminary analyses for validity and reliability of the scale are satisfactory. The scale is unidimensional and consists of 13 items. We also found that positive attitude towards math had significant effect on math achievement while there was no significant difference between math achievement scores of males and females.
Recommendations
The scale can be tested on different samples.
The scale can be translated into different languages and used in different countries to test invariance.
The relationship between attitude towards mathematics
course and different variables can be examined by using
the scale.
REFERENCES
[1] Açıkgül, K., Macit, E., & Çakan, C. (2015). Lise, Dershane ve Üniversite Matematiğinin İlköğretim Matematik Öğretmen Adayları Tarafından Değerlendirilmesi: İnönü Üniversitesi Örneği. Adıyaman Üniversitesi Eğitim Bilimleri Dergisi, 5(1), 72-98.
[2] Aiken, L. R. (2002). Attitudes and Related Psychosocial Constructs Theories, Assessment and Research. Londan: Sage Publications.
[3] Akdemir, Ö. (2006). İlköğretim Öğrencilerinin Matematik Dersine Yönelik Tutumları ve Başarı Güdüsü. Yüksek Lisans Tezi. İzmir: Dokuz Eylül Üniversitesi. Eğitim Bilimleri Enstitüsü.
[4] Akın, F. (2002). İlköğretim 4,5,6,7 ve 8. sınıf öğrencilerinin Matematik Dersine Yönelik Tutumlarının Çeşitli Değişkenlere Göre İncelenmesi, Yüksek Lisans Tezi, Pamukkale Üniversitesi, Denizli.
[5] Arıcak, T., Ilgaz, G. (2007). Açımlayıcı ve doğrulayıcı faktör analizi ile biyoloji dersi tutum ölçeğinin yapı geçerliliğinin incelenmesi. Eurasian Journal of Educational Research, 28. 1-8.
[6] Aronson, E., Wilson, T. D., & Akert, R. M. (2012). Sosyal Psikoloji, (çev. Okhan Gündüz). Kaknüs Yayınları, İstanbul. [7] Avcı, E., Coşkuntuncel, O., İnandı, Y. (2011). Ortaöğretim
on ikinci sınıf öğrencilerinin matematik dersine karşı tutumlari. Mersin Üniversitesi Eğitim Fakültesi Dergisi, 7(1), 50-58.
[8] Bagozzi, R. P., Yi, Y. (1988). On the evaluation of structural equation models. Journal of the academy of marketing science. 16(1), 74-94.
[9] Baloğlu, M. (2001). Matematik korkusunu yenmek. Kuram ve Uygulamada Eğitim Bilimleri Dergisi, 1(1), 59-76. [10]Baştürk, S. (2011). Üniversite giriş sınavına hazırlanma
sürecinin öğrencilerin matematik öğrenmeleri üzerine olumsuz yansımaları. Hacettepe Üniversitesi Eğitim Fakültesi Dergisi. 40, 69-79.
[11]Baykul, Y. (2002). İlköğretimde Matematik Öğretimi 6.-8. Sınıflar İçin. (1. Baskı). Ankara: Pegema Yayıncılık. [12]Bouchard, T. J., & Loehlin, J. C. (2001). Genes, evolution,
and personality. Behavior Genetics, 31(3), 243-273. [13]Brown, T. A. (2006). Confirmatory Factor Analysis for
Applied Research. NY: Guilford Press.
[14]Browne, M. W., & Cudeck, R. (1993). Alternative ways of assessing model fit. In K. A. Bollen& J. S. Long (Eds.), Testing Structural Equation Models (136–162). Newbury Park, CA: Sage.
[15]Bulut, S., & Yetkin, İ. E. ve Sazak, S.(2002). Matematik öğretmen adaylarının olasılık başarısı, olasılık ve matematiğe yönelik tutumlarının cinsiyete göre incelenmesi. Hacettepe Üniversitesi Eğitim Fakültesi Dergisi, 22, 21-28. [16]Büyüköztürk, Ş. (2007). Sosyal Bilimler İçin Veri Analizi El
Kitabı(8. Basım ed.). Ankara: Pegem A Yayıncılık. [17]Byrne, B. M. (2001). Structural equation modeling with
AMOS: Basic Concepts, Applications, And Programming. Mahwah, NJ: Lawrence Erlbaum Associates.
[18]Canan, S. (2015). Değişen Beynim. İstanbul: Tuti Kitap. [19]Cohen, J. (1988). Statistical Power Analysis for The
Behavioral Sciences. (2nd). New Jersey: Lawrence Erlbaum. [20]Çelik, H. C., & Ceylan, H. (2009). Lise öğrencilerinin matematik ve bilgisayar tutumlarının çeşitli değişkenler açısından karşılaştırılması. Pamukkale Üniversitesi Eğitim Fakültesi Dergisi, 26(26), 92-101.
[21]Çelik, H.C. ve Bindak, R. (2005). Sınıf Öğretmenliği Bölümü Öğrencilerinin Matematiğe Yönelik Tutumlarının Çeşitli Değişkenlere Göre İncelenmesi. Kastamonu Eğitim Dergisi, 13(2), 427-436.
Sosyal Bilimler İçin Çok Değişkenli İstatistik SPSS Ve LISREL Uygulamaları. (3.Baskı). Ankara: Pegem Akademi Yayınları.
[23]Doğan, A., Sulak, H., Cihangir, A. (2002, Eylül). İlköğretim Matematik Eğitimi Anabilim Dalı Öğrencilerinin Özel Fonksiyonlar ile Fonksiyonlarda Limit, Türev ve Türev Uygulamaları Konularındaki Yeterlikleri Üzerine Bir Araştırma. V. Ulusal Fen Bilimleri ve Matematik Eğitimi Sempozyumu, 16-18 Eylül 2002, ODTÜ Kültür Ve Kongre Merkez, Ankara.
[24]Duatepe-Paksu, A., & Akkus, O. (2007). An Observational Study in Elementary Mathematics Classrooms. Eğitim ve Bilim,32(145), 16-22.
[25]Dursun, Ş. ve Dede Y. ( 2004 ). Öğrencilerin matematikte başarısını etkileyen faktörler: Matematik öğretmenlerinin görüşleri bakımından. Gazi Eğitim Fakültesi Dergisi, 2(24), 217-230.
[26]Eagly, A. H., Chaiken, S. (1993). The psychology of attitudes. San Diego: Harcourt Brace Jovanovich.
[27]Erdem, A. R., & Genç, G. (2014). Ortaokul beşinci sınıfta seçmeli “matematik uygulamaları” dersini seçen öğrencilerin derse ilişkin görüşleri. Eğitimde Nitel Araştırmalar Dergisi, 2(2). 9-26.
[28]Erkuş, A. (2012). Psikolojide ölçme ve ölçek geliştirme. Ankara: Pegem Akademi Yayınları.
[29]Ernest. P. (1991). The Philosopy of Mathematics Education. London: The Farmer Press.
[30]Farc, M. M., Sagarin, B. J.(2009). Using attitude strength to predict registration and voting behavior in the 2004 U.S. presidential elections. Basic and Applied Social Psychology, 31(2), 160-173.
[31]Field, A. (2009). Discovering Statistics Using SPSS. Third edition. London: Sage.
[32]Fornell, C., Larcker, D. (1981). Evaluating structural equation models with unobservable variables and measurement Error. Journal of Marketing Research,18(1), 39-50. doi:10.2307/3151312.
[33]Francis, L. J. (1993). Parental influence and adolescent religiosity: A study of church attendance and attitude toward Christianity among adolescents 11 to 12 and 15 to 16 years old. The International Journal for the Psychology of Religion, 3(4), 241-253.
[34]Francisco, J. M., Maher, C. A. (2005). Conditions for promoting reasoning in problem solving: Insights from a longitudinal study. Journal of Mathematical Behavior, 24, 361–372.
[35]Frost, L. A., Hyde, J. S., & Fennema, E. (1994). Gender, mathematics performance, and mathematics-related attitudes and affect: A meta-analytic synthesis. International Journal of Educational Research, 21(4), 373-385.
[36]Georgiou, S. N., Stavrinides, P., & Kalavana, T. (2007). Is Victor better than Victoria at maths?. Educational Psychology in Practice, 23(4), 329-342.
[37]Gunderson, E. A., Ramirez, G., Levine, S. C., & Beilock, S. L. (2012). The role of parents and teachers in the development of gender-related math attitudes. Sex Roles, 66(3-4), 153-166.
[38]Hare, A. Y. M. (1999). Revealing what urban early childhood teachers think about mathematics and how they teach it: Implications for practice (Doctoral dissertation, University of North Texas).
[39]Holland, R. W., Verplanken, B., Knippenberg, A. V. (2002). On the nature of attitude–behavior relations: the strong guide, the weak follow. European Journal of Social Psychology,32, 869–876.
[40]Hyde, J. S., Fennema, E., Ryan, M., Frost, L. A., & Hopp, C. (1990). Gender comparisons of mathematics attitudes and affect. Psychology of women quarterly, 14(3), 299-324.. Gender comparisons of mathematics attitudes and affect. Psychology of women quarterly, 14(3), 299-324.
[41]Işık, D. K. (2007). Çoklu zeka kuramı destekli kubaşık öğrenme yönteminin ilköğretim dördüncü sınıf öğrencilerinin matematik dersindeki akademik başarılarına ve kalıcılığa etkisi. Unpublished master thesis. Adana: Çukurova University, Institute of Social Sciences.
[42]İskenderoğlu, T., Baki, A. (2011). İlköğretim 8. sınıf matematik ders kitabındaki soruların PISA matematik yeterlik düzeylerine göre sınıflandırılması. Eğitim ve Bilim, 36(161), 287-301.
[43]Kanbolat, O., Bekdemir, M., & Baş, F. (2011). The Examination of the Attitudes of Students Enrolled from the 3rd to 8th Year towards Mathematics. International Journal of Educational Researchers, 1(3), 103-121.
[44]Kline, R. B. (2005). Principles and Practice of Structural Equation Modeling (2nd ed.). New York: Guilford Press. [45]Köroğlu, H. ve Yeşildere, S. (2004). İlköğretim 7. sınıf
matematik dersi tamsayılar ünitesinde çoklu zekâ teorisi tabanlı öğretimin öğrenci başarısına etkisi. Gazi Eğitim Fakültesi Dergisi, 24(2), 25–41.
[46]Kramarski, B. and Zoldan, S. (2008). Using errors as springboards for enhancing mathematical reasoning with three metacognitive approaches. The Journal of Educational Research, 102(2), 137-151.
[47]Krech, D., Crutchfield, R.S. (1948). Theory and Problems of Social Psychology. New York: MacGraw-Hill.
[48]Kulik, L. (2002). The impact of social background on gender-role ideology: Parents' versus children's attitudes.
Journal of Family Issues, 23(1), 53-73.
[49]Linn, M. C., & Kessel, C. (1996). Success in mathematics: Increasing talent and gender diversity among college majors. CBMS Issues in Mathematics Education, 6, 101-144.
[50]Ma, X. (1997). Reciprocal relationships between attitude toward mathematics and achievement in mathematics. The Journal of Educational Research, 90(4), 221-229.
[51]Ma, X., & Kishor, N. (1997). Attitude toward self, social factors, and achievement in mathematics: A meta-analytic review. Educational Psychology Review, 9(2), 89-120. [52]Ma, X., & Xu, J. (2004). Determining the causal ordering
between attitude toward mathematics and achievement in mathematics. American Journal of Education, 110(3), 256-280.
4(2), 157-163.
[54]Mahanta, S., & Islam, M. (2012). Attitude of secondary students towards mathematics and its relationship to achievement in mathematics. International Journal of Computer Technology and Applications, 3(2), 713-715. [55]Marsh, H.W. &Hocevar, D. (1985). Application of
confirmatory factor analysis to the study of self-concept: First- and higher-order factor models and their invariance across groups. Psychological Bulletin, 97, 562–582. [56]McGraw, R., Lubienski, S., & Strutchens, M. E. (2006). A
closer look at gender in NAEP mathematics achievement and affect data: Intersections with achievement, race/ethnicity, and socioeconomic status. Journal for Research in Mathematics Education, 37(2), 129–150. [57]MEB (2009). İlköğretim matematik dersi 6-8. sınıflar
öğretim programı. T.C. Milli Eğitim Bakanlığı. Talim ve Terbiye Kurulu Başkanlığı, Ankara.
[58]Minato, S., & Yanase, S. (1984). On the relationship between students attitudes towards school mathematics and their levels of intelligence. Educational Studies in Mathematics, 15(3), 313-320.
[59]Moralı, S., Köroğlu, H., & Çelik, A. (2004). Buca Eğitim Fakültesi matematik öğretmen adaylarının soyut matematik dersine yönelik tutumları ve rastlanan kavram yanılgıları. Gazi Üniversitesi Gazi Eğitim Fakültesi Dergisi, 24(1), 161-175.
[60]Nowak, A., Szamrej, J., & Latané, B. (1990). From private attitude to public opinion: A dynamic theory of social impact.
Psychological Review, 97(3), 362.
[61]Oskamp, S., Schultz, P. W. (2005). Attitudes and Opinions. New Jersey: Lawrence Erlbaum Associates Inc.
[62]Özdamar, K. (2004). Paket Programlar ile Istatiksel Veri Analizi-1. (genişletilmiş 5. baskı). Eskişehir: Kaan.
[63]Özgüven, İ. E. (1994). Psikolojik Testler. Ankara: PDREM Yayınları.
[64]Peker, M., & Mirasyedioğlu, Ş. (2003). Lise 2. sınıf öğrencilerinin matematik dersine yönelik tutumları ve başarıları arasındaki ilişki. Pamukkale Üniversitesi Eğitim Fakültesi Dergisi, 14(2), 157–166.
[65]Peker, M., Mirasyedioğlu, Ş. (2003). Lise 2. sınıf öğrencilerinin matematik dersine. Pamukkale Üniversitesi Eğitim Fakültesi Dergisi, 14(14), 157-166.
[66]Plotnik, R. (2009). Psikoloji’ye Giriş. 1. Baskı, (Çev. Geniş, Tamer). İstanbul: Kaknüs Yayınları.
[67]Reyes, L. H. (1984). Affective variables and mathematics education. The Elementary School Journal, 84(5), 558-581. [68]Reynolds, A. J., & Walberg, H. J.A. (1992). Process Model
of Mathematics Achievement and Attitude. Journal for research in mathematics education, 23(4), 306.
[69]Savaş, E., Taş, S. & Duru, A. (2010). Matematikte öğrenci başarısını etkileyen faktörler. İnönü Üniversitesi Eğitim Fakültesi Dergisi, 11(1), 113-132.
[70]Semerci, Ç., Semerci, N. (2004). İlköğretim (1.-5. sınıf) matematik ders kitaplarının genel bir değerlendirmesi. Milli Eğitim Dergisi, 162, 1-5.
[71]Soylu Y. ve Aydın, S. (2006). Matematik derslerinde kavramsal ve işlemsel öğrenmenin dengelenmesinin önemi üzerine bir çalışma. Erzincan Eğitim Fakültesi Dergisi, 8(2), 83-95.
[72]Stedman, R. C. (2002). Toward a social psychology of place: Predicting behavior from place-based cognitions, attitude, and identity. Environment and Behavior, 34(5), 561-581. [73]Sümer, N. (2000). Yapısal eşitlik modelleri. Türk Psikoloji
Yazıları. 3 (6), 49-74.
[74]Şentürk, B. (2010). İlköğretim Beşinci Sınıf Öğrencilerinin Genel Başarıları, Matematik Başarıları, Matematik Dersine Yönelik Tutuları ve Matematik Kaygıları Arasındaki İlişki. Afyon Kocatepe Üniversiesi, Sosyal bilimler Enstitüsü, Yayımlanmamış Yüksek Lisans Tezi.
[75]Tavşancıl, E. (2006). Tutumların Ölçülmesi ve SPSS ile Veri Analizi. Ankara: Nobel Yayın Dağıtım.
[76]Temizkan, M. (2008). Türkçe öğretmeni adaylarının öğretmenlik mesleğine yönelik tutumları üzerine bir araştırma. Türk Eğitim Bilimleri Dergisi, 6(3), 461-486. [77]Tesser, A. (1993). The importance of heritability in
psychological research: The case of attitudes. Psychol. Rev. 100, 129–142.
[78]Titrek, O., Güneş, D. Z., Sezen, G., Ölçüm, D. (2013). Öğretmenliğe Yönelik Tutum İle Duygusal Zekâ Arasındaki İlişki. VI. Ulusal Lisansüstü Eğitim Sempozyumu, Bildiriler Kitabı II, Eğitim Bilimleri Enstitüsü, Sakarya Üniversitesi. Sakarya.
[79]Tocci, C. M., & Engelhard Jr, G. (1991). Achievement, parental support and gender differences in attitudes toward mathematics. The Journal of Educational Research, 84(5), 280-287.
[80]West, S., Finch, J., & Curran, P. (1995). Structural equation models with non-normal variables: Problems and remedies. In R. Hoyle (Ed.), Structural Equation Modelling: Concepts, Issues, and Applications (pp. 56–75). Thousand Oaks, CA: Sage.
[81]Weston, R., Gore, Jr. P. A. (2006). A brief guide to structural equation modeling. The Counseling Psychologist, 34(5), 719-751.
[82]Wood, W. (2000). Attitude change: Persuasion and social influence. Annual Review of Psychology, 51(1), 539-570. [83]Yenilmez, K. (2010). Ortaöğretim öğrencilerinin matematik
dersine yönelik umutsuzluk düzeyleri. Hacettepe Üniversitesi Eğitim Fakültesi Dergisi, 38, 307-317. [84]Yenilmez, K. ve Özabacı, N. Ş. (2003). Yatılı Öğretmen
Okulu Öğrencilerinin Matematik İle İlgili Tutumları Ve Matematik Kaygı Düzeyleri Arasındaki İlişki Üzerine Bir Araştırma. Pamukkale Üniversitesi Eğitim Fakültesi Dergisi, 2(14), 132-146.
[85]Yılmaz, M. (2006). İlköğretim Altıncı Sınıf Öğrencilerinin Matematik Dersine İlişkinTutumlarının Bazı Değişkenlere Göre İncelenmesi. Milli Eğitim Üç Aylık Eğitim ve Sosyal Bilimler Dergisi, 240, Güz, 35, (172).