Optimization of Process Parameters in Milling
Operation by Taguchi’s Technique using
Regression Analysis
Sunilkumar S. Panshetty Parag V. Bute
Assistant Professor Assistant Professor
Department of Mechanical Engineering Department of Mechanical Engineering
Suman Ramesh Tulsiani Technical Campus-Faculty of Suman Ramesh Tulsiani Technical Campus-Faculty of
Engineering, Khamshet, Pune, India Engineering, Khamshet, Pune, India
Rohit R. Patil Jitendra B. Satpute
Assistant Professor Assistant Professor
Department of Mechanical Engineering Department of Mechanical Engineering
Suman Ramesh Tulsiani Technical Campus-Faculty of Suman Ramesh Tulsiani Technical Campus-Faculty of
Engineering, Khamshet, Pune, India Engineering, Khamshet, Pune, India
Abstract
The present work highlights the optimization of Computerized Numerical Control (CNC) milling Process Parameters to provide a better surface finish and high Material Removal Rate (MRR). As Taguchi’s method reduces the number of experiments, it is used for optimization of machining parameters. It is applied to find out the influence of various machining parameters like Speed, Feed rate, Depth of cut on Surface finish and MRR. The material used in this experiment is Al 7075 of size 100mm*100mm*10mm and the pocketing operation of size 20mm*20mm is carried out on vertical CNC milling machine by 12 mm carbide tool. L9 Orthogonal Array (OA) is used to carry out the experimentation. MINITAB-14 Software is used to analyse the result. Surface roughness (Ra) was measured and the MRR values were calculated to determine optimum levels. Results obtained were plotted for Ra, MRR v/s Speed, feed rate, depth of cut. In this Study, it is observed that the order of Significance of the main Variable for Surface Roughness (Ra) is Speed; Feed & Depth of Cut (DOC) whereas for MRR, the Order of Significance is DOC, Feed rate & Speed.
Keywords: ANOVA; Milling; MRR; Ra; Taguchi’s method
________________________________________________________________________________________________________
I. INTRODUCTION
In machining of parts, surface quality or surface roughness is one of the most specified customer requirements. It is major concern to decide the acceptance and quality of product along with improved or maximum tool life as an economical constraint. In many actual machining applications, the maximum production rate, minimum operational cost and the quality of machining objectives are frequently considered.
The surface roughness mainly depends on work piece hardness, tool geometry, and process parameters such as feed rate, depth of cut, cutting speed etc. In order to maximize the gain from machining, accurate predictive models for surface roughness must be constructed. In order to address these issues, this study proposed methodical approach that integrates optimization concept, with statistically robust design technique.
Milling is the important machining operation, widely used in most of the manufacturing industries due to its capability of producing complex geometric surfaces with reasonable accuracy and surface finish. However, with the inventions of CNC milling machine, the flexibility has been adopted along with versatility in end milling process. In the manufacturing industries, side milling, end milling machining processes are adopted for removing the material from the workpiece for a better product. Out of these, end milling process is one of the most vital and common metal cutting operations used for machining parts because of its ability to remove materials faster with a reasonably good surface quality. In recent times, CNC machine tools have been implemented to realize full automation in milling since they provide greater improvements in productivity, quality of the machined parts with less operator input. The surface finish of the machined surface has been identified as quality attribute whereas MRR has been treated as performance index directly related to productivity.
II. LITERATURE REVIEW AND SCOPE OF WORK
Ahmet Murat Pinar et al. [1] determined the effects of process parameters (cutting speed, feed rate, tool path pattern and depth of cut) on surface roughness and the factor levels with minimum surface roughness in pocket machining. The experiments were conducted based on Taguchi’s L27 orthogonal array are assessed with analysis of variance and signal-to- noise ratio. They observed that surface roughness correlates negatively with cutting speed and positively with feed rate and cutting depth. Minimum surface roughness is predicted as 0.5413 μm with the cutting speed of 300 m/min, feed rate of 150 mm/min, spiral tool path pattern and 1 mm depth of cut. Finally, confirmation tests with Taguchi method achieve the optimization of the system with sufficient accuracy at 95 % confidence level.
M.Subramanian et al.[2] developed a statistical model to predict cutting force in terms of machining parameters such as cutting speed, cutting feed rate and axial depth of cut. Response surface methodology experimental design was used for conducting experiments. The work piece material was Aluminum (Al 7075-T6) and the tool was a shoulder mill with two carbide insert. The cutting forces were measured using three axis milling tool dynamometer. The second order mathematical model in terms of machining parameters was developed for predicting cutting force. The adequacy of the predictive models was tested by analysis of variance and found to be adequate. The direct and interaction effect was graphically plotted which helps to study the significance of these parameters with cutting force. The optimization of shoulder mill machining parameters to acquire minimum cutting force was done by GA. A MATLAB genetic algorithm solver was used to do the optimization.
Tao FU et al. [3] investigated optimization problem of the cutting parameters in high-speed milling on NAK80 mold steel. An experiment based on the technology of Taguchi is performed. The objective is to establish a correlation among spindle speed, feed per tooth and depth of cut to the three directions of cutting force in the milling process. In this study, the optimum cutting parameters were obtained by the grey relational analysis. The results of experiments shown that grey relational analysis coupled with principal component analysis can effectively acquire the optimal combination of cutting parameters and the proposed approach can be a useful tool to reduce the cutting force.
Hasan O¨ ktem et al. [4] developed a Taguchi optimization method for low surface roughness in terms of process parameters when milling the mold surfaces of 7075-T6 aluminum material. Considering the process parameters of feed, cutting speed, axial-radial depth of cut, and machining tolerance, a series of milling experiments were performed to measure the roughness data. A regression analysis was applied to determine the fitness of data used in the Taguchi optimization method using milling experiments based on a full factorial design. Taguchi orthogonal arrays, signal-to-noise (S/N) ratio, and analysis of variance (ANOVA) were used to find the optimal levels and the effect of the process parameters on surface roughness. A confirmation experiment with the optimal levels of process parameters was carried out in order to demonstrate the effectiveness of the Taguchi method. They concluded that Taguchi method is very suitable in solving the surface quality problem of mold surfaces.
B. C. Routara et al. [5] investigated Influence of machining parameters, viz., spindle speed, depth of cut and feed rate, on the quality of surface produced in CNC end milling. They conducted experiments for three different workpiece materials to study the effect of workpiece material variation in this respect. Five roughness parameters, viz., centre line average roughness, root mean square roughness; skewness, kurtosis and mean line peak spacing have been considered. The second-order mathematical models, in terms of the machining parameters, have been developed for each of these five roughness parameters prediction using response surface method on the basis of experimental results. The roughness models as well as the significance of the machining parameters have been validated with analysis of variance.
Bharat Chandra Routara et al. [6] highlighted study of a multi-objective optimization problem by applying utility concept coupled with Taguchi method through a case study in CNC end milling of UNS C34000 medium leaded brass. The study aimed at evaluating the best process environment which could simultaneously satisfy multiple requirements of surface quality. In view of the fact, the traditional Taguchi method cannot solve a multi-objective optimization problem; to overcome this limitation, utility theory has been coupled with Taguchi method. Depending on Taguchi’s Lower-the- Better response criteria; individual surface quality characteristics has been transformed into corresponding utility values. Individual utility values have been aggregated finally to compute overall utility degree which serves as representative objective function for optimizing using Tag
Deepak Choudhary and Parveen Kumar et al. [7] highlights optimization of CNC milling process parameters to provide high MRR. The MRR have been identified directly related to productivity .In this paper Taguchi method is applied to find out the influence of various machining parameters like Spindle speed (SS) , feed rate (FR), DOC on the quality characteristic MRR using Hot Die Steel H-13 work piece on Vertical CNC Milling machine. A L9 Orthogonal array is used to carry out the various experimental data in Mini Tab 15. Results obtained are plotted by Main effects MRR v/s SS, FR, DOC. The experimental result shows that in order to increase the productivity, the quality characteristic MRR is optimized by the increase of control parameter Spindle speed & Depth of cut. In this study, it was observed that, the order of significance of the main variables is as Spindle speed, depth of cut, feed rate.
Azlan Mohd Zain et al.[9] carried out study to observe the optimal effect of the radial rake angle of the tool, combined with speed and feed rate cutting conditions in influencing the surface roughness result. In machining, the surface roughness value is targeted as low as possible and is given by the value of the optimal cutting conditions. They attempt the application of GA to find the optimal solution of the cutting conditions for giving the minimum value of surface roughness. They developed the regression model. They conclude that the GA technique is capable of estimating the optimal cutting conditions that yield the minimum surface roughness value.
From the literature it is seen that enormous research was carried out by the researchers either experimentally or theoretically in the optimisation of process parameters. Various methods were introduced to study dominance of parameters in milling operation. For the present study the control factors considered are Speed, Feed and DOC. Three levels for each control factor are used. Experiments are conducted on CNC milling machine with uncoated carbide tool and Al 7075 as work material to optimize the milling parameter. Based on the above said number of control factors and their levels, L9 orthogonal array is selected from the Standard orthogonal array table to conduct the matrix experiment. The work piece used for the experiment is 100mm*100mm*10mm.
III. METHODOLOGY
The methodology adopted for this work is as follows:
1) Selection of work material and tool material from the literature survey. 2) Next conduction of the preliminary experiment.
3) Analysis of the obtained data from experimentation using ANOVA and Regression analysis. From this experimentation, significant factors and insignificant factors are identified, and then insignificant factors are neglected.
4) Then experiment is designed by taking speed, feed, DOC as a significant factors into consideration. 5) Responses are measured using surf test machine & weighing machine.
6) Optimization of speed, feed, and depth of cut parameters performed using Taguchi’s technique. 7) Creating a model using Minitab software.
8) Confirmation test.
9) Correlation of data obtained from optimization of parameters and predicted values through model.
IV. EXPERIMENTAL SETUP
Work Material and Tool :
Al 7075 is an aluminium alloy, with zinc as the primary alloying element. It is strong, with strength comparable to many steels, and has good fatigue strength and average machinability, but has less resistance to corrosion than many other Al alloys.
Fig. 1: (A) uncoated carbide tool Figure (B) Al 7075 material
Basic Properties:
Aluminium 7075 has a density of 2.810 g/cm³ ( 0.1015 lb/in³ )
Composition of Al 7075 Material (wt. %):
Silicon --- 0.40 % Zinc --- 5.1-6.1% Ferrous --- 0.50 % Titanium --- 0.20 % Copper --- 1.2-2.0 % Others, each --- 0.5 % Mn. --- 0.30 % Others, --- 0.15 % Mg. --- 2.1-2.9 % Balance, Aluminum
Chromium ---- 0.18-0.28 %
Table – 1
Machining Parameters and Their Levels
Parameters Levels
1 2 3
DOC (mm) 0.6 0.8 1
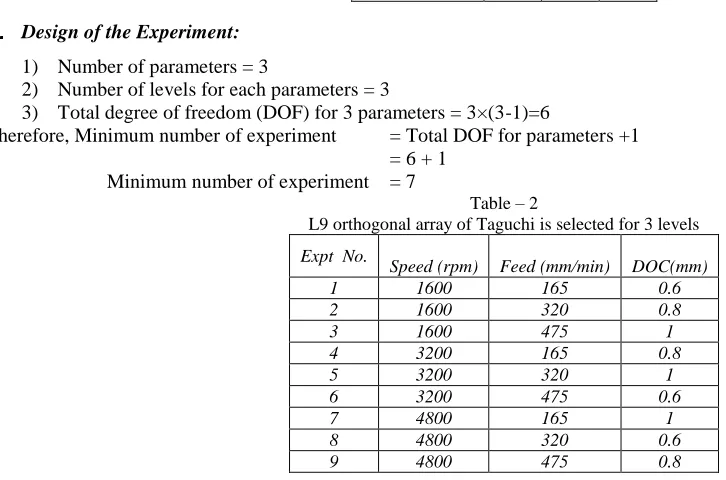
Design of the Experiment:
1) Number of parameters = 3
2) Number of levels for each parameters = 3
3) Total degree of freedom (DOF) for 3 parameters = 3×(3-1)=6
Therefore, Minimum number of experiment = Total DOF for parameters +1 = 6 + 1
Minimum number of experiment = 7
Table – 2
L9 orthogonal array of Taguchi is selected for 3 levels
Expt No.
Speed (rpm) Feed (mm/min) DOC(mm)
1 1600 165 0.6
2 1600 320 0.8
3 1600 475 1
4 3200 165 0.8
5 3200 320 1
6 3200 475 0.6
7 4800 165 1
8 4800 320 0.6
9 4800 475 0.8
Experimental Setup and Procedure:
The Milling experiment is performed on the Hartford LG 800 VMC Machine, at S V S Engineering Works in Hyderabad. And the machining is done under wet condition using water soluble oil as cutting fluid.
Fig. 2: Hartford LG 800 VMC Machine
In this investigation, the response surface Ra is measured by MITUTOYO SJ210 SURFTEST, a stylus type profilometer and the response MRR is calculated by using following mathematical equation with time consideration
MRR =(Wi−Wf)∗1000
(Dw∗t) …
Here, Wi is the initial weight of work piece in grams Wf is the final weight of work piece in grams t is the machining time in minutes
ρs is the density of Aluminium Alloy (2.810 g/cm3).
The experimental studies were performed on a Hartford LG800 CNC Milling machine using tool life 12mm diameter cutter mill with 4 cutters inserts. The cutter mill tool is made by uncoated carbide. The work-piece used for this experiment is Al 7075 of dimension i e. Length, breadth and thickness (100mm*100mm*10mm).the CNC machine is used to perform pocketing operation of size 20mm*20mm on the Al 7075 material.
Different settings of three controllable factors such as Speed, Feed and DOC were used in the experiments as shown in Table 3 Table – 3
Levels for various factors
Factors Levels
1 2 3
Speed (rpm) 1600 3200 4800 Feed (mm/min) 165 320 475
V. RESULTS AND DISCUSSION
After conducting the experiment for work materials, response values are noted down and analysis has been done. The analysis is also done for raw data taken from the experiment. Taguchi analysis was conducted to determine the optimal parameters and ANOVA was also performed to estimate magnitude of factors effects on the responses.
Tabulation of Experimental Data:
Data obtained after measuring the responses, Ra & MRR) for Al 7075 material are tabulated in table 4. Table – 4
surface Roughness for Al 7075 material
EXPT.NO SPEED (rpm) FEED (mm/min) DOC (mm) Surface Roughness (Ra) µm Ra 1 Ra 2 Ra 3 Mean (Ra)
1 1600 165 0.6 1.082 1.023 1.403 1.169
2 1600 320 0.8 1.614 1.068 0.978 1.220
3 1600 475 1 1.073 1.221 1.466 1.253
4 3200 165 0.8 0.609 0.626 0.903 0.712
5 3200 320 1 1.059 0.937 1.315 1.104
6 3200 475 0.6 1.376 1.145 1.009 1.176
7 4800 165 1 0.967 1.010 0.835 0.937
8 4800 320 0.6 0.872 0.862 0.868 0.867
9 4800 475 0.8 0.882 1.261 0.995 1.046
Taguchi Analysis:
Ra versus Speed (A), Feed (B) and DOC(C) Main Effects Plot (data means) for SN ratios
M
ea
n
of
S
N
ra
ti
os
4 8 0 0 3 2 0 0
1 6 0 0 0 . 5 0 . 0 -0 . 5 -1 . 0 -1 . 5
4 7 5 3 2 0
1 6 5
1 . 0 0 . 8
0 . 6 0 . 5 0 . 0 -0 . 5 -1 . 0 -1 . 5
sp e e d fe e d
d c o
M a i n E f f e c ts P l o t ( da ta me a ns ) f o r S N r a ti o s
S igna l- to - no is e : S m a lle r is b e tte r
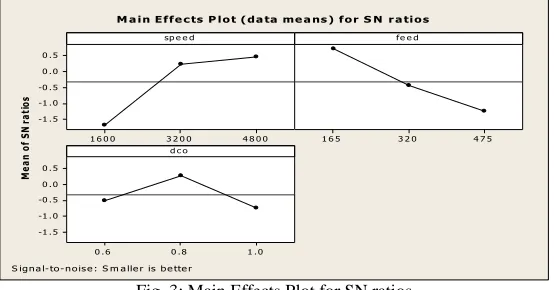
Fig. 3: Main Effects Plot for SN ratios
From graph, it is clear that;
- By increasing the speed value from 1600 rpm to 4800 rpm, the S/N ratio is increasing that means Roughness would be decreased.
- By increasing the feed from 165 mm/min to 475 mm/min the surface finish is decreasing. - By increasing the DOC from 0.6 mm to 1 mm the surface finish is decreasing.
Fig. 4: Graphs of Ra (smaller the better case)
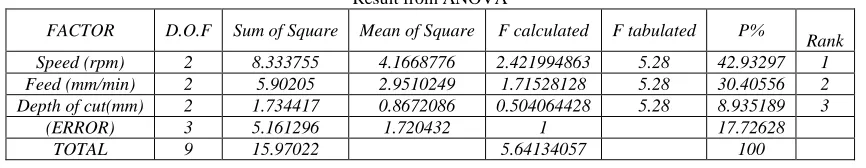
Table 5- Analysis of Variance (ANOVA) Result for Ra
Table – 5 Result from ANOVA
FACTOR D.O.F Sum of Square Mean of Square F calculated F tabulated P%
Rank
Speed (rpm) 2 8.333755 4.1668776 2.421994863 5.28 42.93297 1
Feed (mm/min) 2 5.90205 2.9510249 1.71528128 5.28 30.40556 2
Depth of cut(mm) 2 1.734417 0.8672086 0.504064428 5.28 8.935189 3
(ERROR) 3 5.161296 1.720432 1 17.72628
TOTAL 9 15.97022 5.64134057 100
Regression Analysis:
Ra versus Speed, Feed, DOC, The regression equation is Ra = 1.04 - 0.000083 speed + 0.000706 feed + 0.068 doc
From the Regression analysis, it is found that the factor Speed is having more significance on surface roughness (Ra) which is followed by the feed rate and depth of cut (DOC), which is shown in table-6
Table – 6
Response table of Regression Analysis for Ra
Predictors Coefficients Sum of Error Coefficients T P Rank Sum of Square Error R^2 Adj R^2
Constant 1.0370 0.2671 3.88 0.012
0.131031 67.4% 47.9%
Speed -0.00008250 0.00003343 -2.47 0.057 1
Feed 0.0007065 0.0003451 2.05 0.096 2
DOC 0.0683 0.2365 0.26 0.809 3
Confirmation Experiment for Ra:
Confirmation experiment was conducted with the optimal parameter settings by taking three trials and the results are shown in Table- 7. The mean Ra value= 0.850 μm. When factor values are substituted in the mathematical model regression equation, it has given Ra value = 0.812 μm. The difference in surface roughness values observed is only 0.04μm that is negligibly small and hence the model is validated.
Table – 7
confirmation experiment for Ra
Factor Level Value Trial no Ra(µm)
Speed 3 4800rpm 1 0.916
Feed 1 165mm/min 2 0.829
DOC 2 0.8mm 3 0.805
Mean Ra=0.850
Similarly For MRR :
Data obtained after measuring the responses MRR for Al 7075 material are tabulated in table 8 . Table – 8
MRR for Al 7075 material
EXPT.NO SPEED (rpm) FEED (mm/min) DOC (mm) Material Removal Rate ( mm 3/sec)
(MRR)
1 1600 165 0.6 7.67
2 1600 320 0.8 14.54
3 1600 475 1 24.35
4 3200 165 0.8 10.15
5 3200 320 1 26.78
6 3200 475 0.6 8.57
7 4800 165 1 15.87
8 4800 320 0.6 12.50
9 4800 475 0.8 21.42
Taguchi Analysis:
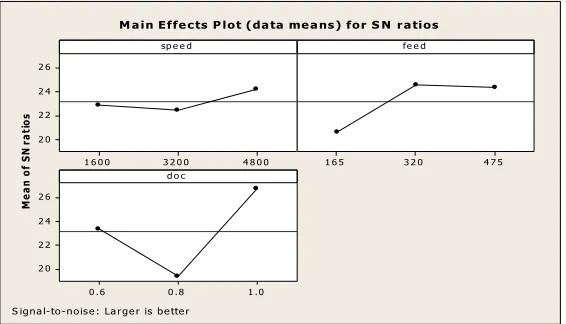
MRR versus Speed (A), Feed (B) and DOC(C) Main Effects Plot (data means) for SN ratios From graph, it is clear that;
M
e
a
n
o
f
S
N
r
a
ti
o
s
4 8 0 0 3 2 0 0
1 6 0 0 2 6
2 4
2 2
2 0
4 7 5 3 2 0
1 6 5
1 .0 0 .8
0 .6 2 6
2 4
2 2
2 0
sp e e d fe e d
d o c
M a in Effe c ts P lot (da ta me a ns ) for S N r a tios
S igna l-to-nois e : La rge r is be tte r
Fig. 5: Main Effects Plot for SN ratios
Confirmation Experiment for MRR:
Confirmation experiment was conducted with the optimal parameter settings by taking three trials and the results are shown in Table-9. The mean MRR value =23.98mm3/sec. When factor values are substituted in the mathematical model regression equation, it has given MRR value = 22.71mm3/sec . The difference in Material removal rate values observed is only 1.27mm3/sec which is negligibly small and hence the model is validated.
Table – 9
Results of confirmation experiment
Factor Level Value Trial no. MRR(mm3/sec)
Speed 3 4800rpm 1 24.82
Feed 2 320mm/min 2 21.27
DOC 3 1mm 3 25.85
Mean MRR=23.98
VI. CONCLUSION
In present study, experiments were conducted to measure response variable such as surface roughness, material removal rate using Hartford LG800 VMC Milling. The Taguchi method and Statistical MINITAB-14 software were used for analysis. Based on this analysis, process parameters were optimized. After the process parameters optimization, ANOVA was performed to determine the relative magnitude of the each factor on objective functions. Taguchi’s OA was used for optimization of process parameters in milling. The confirmation experiment was conducted using the optimized process parameters and the performance characteristics were measured and compared with the results obtained from the initial set of readings. Finally it is concluded that for the Ra; the factor speed should be at level 3(4800 rpm), feed at level 1(165 mm/min) and DOC at level 2(0.8 mm) and also for better MRR; the factors speed should be at level 3(4800 rpm), feed at level 2(320mm/min) and DOC at level 1(1mm).
REFERENCES
[1] Ahmet Murat Pinar, “Optimization of Process Parameters with Minimum Surface Roughness in the Pocket Machining of AA5083 Aluminum Alloy via Taguchi Method”, Arabian Journal for Science and Engineering March 2013, Volume 38, Issue 3, pp 705-714
[2] M.Subramanian, M.Sakthivel, K. Sooryaprakash, R. Sudhakaran, “Optimization of Cutting Parameters for Cutting Force in Shoulder Milling of Al7075-T6 Using Response Surface Methodology and Genetic Algorithm” Procedia Engineering, Volume 64, 2013, Pages 690–700.
[3] Tao FU, Jibin ZHAO, Weijun LIU, “Multi-objective optimization of cutting parameters in high-speed milling based on grey relational analysis coupled with principal component analysis’, Frontiers of Mechanical Engineering, December 2012, Volume 7, Issue 4, pp 445-452 .
[4] Hasan Oktem · Tuncay Erzurumlu · Mustafa C, “A study of the Taguchi optimization method for surface roughness in finish milling of mold surfaces”, The International Journal of Advanced Manufacturing Technology, April 2006, Volume 28, Issue 7, pp 694-700.
[5] B. C. Routara & A. Bandyopadhyay & P. Sahoo., “Roughness modeling and optimization in CNC end milling using response surface method: effect of workpiece material variation”, The International Journal of Advanced Manufacturing Technology, February 2009, Volume 40, Issue 11, pp 1166-1180 [6] Bharat Chandra Routara, Saumya Darsan Mohanty, Saurav Datta, Asish Bandyopadhyay And Siba Sankar Mahapatra, “ Optimization in CNC end milling of
UNS C34000 medimum leaded brass with multiple surface roughnesses characteristics”, Sadhana, October 2010, Volume 35, Issue 5, pp 619-629 [7] Deepak Choudhary and Praveen kumar, “To influence the process parameters of CNC milling machine using the Taguchi method on hot die steel H-13”
(IJREAS) 2013.
[8] Kantheti Venkata Murali Krishnam Raju , Gink Ranga Janardhana, Podaralla Nanda Kumar, Vanapalli Durga Prasada Rao, “Optimization of cutting conditions for surface roughness in CNC end milling”, International Journal of Precision Engineering and Manufacturing, June 2011, 12:383
[9] Azlan Mohd Zain , Habibollah Haron , Safian Sharif, “ Application of GA to optimize cutting conditions for minimizing surface roughness in end milling machining process” , Expert Systems With Applications; 37, 6; 4650-4659; Expert Systems With Applications, Elsevier Science B.V., Amsterdam.; 2010. [10] Babur Ozcelik , Hasan Oktem , Hasan Kurtaran, “ Optimum surface roughness in end milling Inconel 718 by coupling neural network model and genetic
algorithm” The International Journal of Advanced Manufacturing Technology, December 2005, Volume 27, Issue 3, pp 234-241 [11] Madhav S Phadke Quality Engineering Using Robust Design, Prentice Hall, Englewood Cliffs, New Jersey-1989