Extraction and Analysis of Farmland Objects in
Hyperspectral Images
Jinglei Tang
College of Information Engineering, Northwest A&F University, Yangling 712100, China [email protected]
Ronghui Miao
College of Information Engineering, Northwest A&F University, Yangling 712100, China [email protected]
Abstract— One of the objectives of precision agriculture is rapid location of fields information to reduce the investment and improve the environment. Based on near infrared (NIR) hyperspectral images, this paper outlines an approach using hyperspectral imaging technology, combining spectral analysis methods and supervised classification methods for the extraction and analysis of farmland objects. This paper selected 185 bands hyperspectral image data and used spectral angle mapper, binary encoding and spectral infor-mation divergence to extract farmland objects and assess classification accuracy based on the extraction results. The N-dimensional visualization analyzer is used to purify the reference pixels. The performance of the provided methods is shown for a series of images acquired under varying light, different fields and different times. The average classifica-tion accuracies are 85.3%, 88.0% and 93.9%. The results show that spectral information divergence outperforms in accuracy and extraction effect, and it will provide a reliable and rapid method in image processing.
Index Terms— hyperspectral image, spectral angle mapper, binary encoding, spectral information divergence
I. INTRODUCTION
Hyperspectral imaging technology combines spec-troscopy and imaging technology. The hyperspectral im-ages consist of a sequence of imim-ages which are produced by different wavelength radiation of ground scenery [1]. Compared with the conventional images, hyperspectral images have abundant spectral and spatial information which can identify different targets with a high reliability [2]. Therefore, hyperspectral images provide hundreds of narrow and contiguous spectral bands with a fine spectral resolution which have been widely used in military, medicine, agriculture, environmental monitoring and other fields [3]. In crops extraction, the use of hyperspectral imaging technology can better distinguish subtle spectral differences among crops and improve the recognition accuracy of crops since green vegetation in spectrum has more in common, and it will greatly promote the
This work is supported by the National Natural Science Foundation of China under Grant No. 31101075, Northwest A&F University Special Innovation Foundation under Grant No. QN2011069, Northwest A&F University PhD. Scientific Research Foundation under Grant No. 2011B-SJJ095.
development of traditional agriculture to precision agri-culture. Hyperspectral imaging technology of crops is the foundation and prerequisite of agriculture, without the right extraction of crops information agricultural re-sources survey, crop assessment and disaster monitoring can not be carried out [4].
Although hyperspectral imaging technology has been widely used in the detection of agricultural products, mainly applies in indoor single product. Because it is easy to get samples carried out in the camera obscura, and less request on the acquisition environment. Moreover, agricultural products and background have great differ-ences, post-image processing is also easier. Currently, due to the high configuration of acquisition equipment, multiple targets and complex background, the majority of hyperspectral image data is obtained through aerial photography and the research on outdoor farmland near-earth object detection is still relatively fewer. Besides, farmland image acquisition can also be affected by light, temperature, wind and other environmental factors, the post-image processing and analysis are also difficult. This paper uses a new spectrometer to sample the farmland to extract and analyze the farmland objects.
Farmland hyperspectral images not only include image information of the objects, but also spectral information. Hyperspectral images include farmland crops (soybean), soil, roads, trees and other objects which can be represent-ed by a specific wavelength spectrum. There is apparent spectral difference among the four classes [5]. Therefore, the study uses hyperspectral imaging technology and the image information with the spectral information of the farmland objects and combines the facts that different objects have different spectrum to analyze and identify different farmland objects.
results and verifies the effectiveness of the algorithms. Moreover, it provided the foundation of hyperspectral images spectral classification and extraction.
II. HYPERSIS IMAGINGSYSTEM A. HyperSIS Imaging System Introduction
HyperSIS series of agricultural hyperspectral imaging system is designed and manufactured specifically for agricultural products which imported SPECIM imaging spectrometer from Finland. This system can be equipped with indoor and outdoor coverings scan accessories to fur-ther expand the use scope of the instrument. The system consists of push-broom imaging spectrometer (N17E), array detectors, SpectralSENS data acquisition software, light source and outdoor coverings scan accessories and other components. This paper uses the scan accessories for outdoor coverings to obtain hyperspectral image data. The type of N17E imaging spectrometer is bulk phase holographic transmission grating. The wavelength range is 900nm-1700nm, and the spectral resolution is 5nm and the spectral sampling points is 4nm. The full-frame pixel number of the NIR array detectors is 320×256. Out-door measuring accessories uses RSA series electronically controlled rotary table. SpectralSIS software is used for spectra and real-time image acquisition: the light source is white diffuse; the spectral range is 350-2500nm and the power >100W.
B. Spectral Camera Imaging Spectrometer (N17E)
Imaging spectrometer (see Fig.1) is the main working part of the hyperspectral imaging system which is a new type of sensor. Started in the early 1980s, it aimed to obtain a large number of narrow-bands continuous spec-tral image data, so that each pixel has almost continuous spectral data [6], [7].
Imaging spectrometer consists of a new shaft structure of collimating optical and a holographic transmission grat-ings. This structure can provide high diffraction efficiency and good linearity spectrum. The independent incident light polarization is caused by the operation of shaft geometric distortion and transmissive optical applications. Artificial holographic transmission grating is between two pieces of glass plates glued on DCG. DCG has high diffraction efficiency and low dispersion, and the multi-level diffraction line is low and does not generate ghost line. Because this material has these special characteris-tics, it is generally used to produce optical components. The holographic grating is sealed which can withstand considerable humidity, physical shock and vibration. It has a wide range of temperature which can be -20-120
◦C.
III. MATERIALS ANDMETHODS A. Spectral Data Acquisition
Near infrared soybean fields hyperspectral images of Northwest A&F University was selected as the research object and the main targets include soybeans, roads,
Figure 1. Imaging spectrometer
trees and soil. NIR hyperspectral images were taken in Northwest A&F University North Campus agriculture experimental fields, after shooting span of 40 days, we obtained 80 samples in different time, temperature, light and weather conditions, and each image has 256 bands. After spectral curve analysis of the 80 samples, we removed 8 outliers, finally selected the remaining 72 images for research and analysis.
Before collecting the hyperspectral image data, we needed to conduct black and white calibration on the cam-era according to the light sources and load the black and white calibration files to ensure the acquisition parameters (exposure time, pixel blending, etc.) of the calibration files are the same. Set various parameters of the hyperspectral imaging system in order to ensure a clear collected images, and adjust the conveyor speed to avoid distor-tion of the image spatial resoludistor-tion [8]. Hyperspectral camera parameters are as follows: the exposure time is 10ms; the moving speed of the electronically controlled displacement table is 20(mm/s); the object distance is 200mm; the hyperspectral image size is 320×400×256. The acquisition of hyperspectral image data is based on GILDEN Potonic SpectraSENS 3.1.1-Xenics×32 data ac-quisition software platform, the analysis and processing of hyperspectral image data are based on ENVI4.7 software platform.
During data acquisition, the researchers numbered each captured sample image. The collected images contain both the image information and the spectral information. Fig.2 shows the image information and spectral information of 1236nm band.
B. Spectral Data Preprocessing
1) Reflectance Spectra Correction: Since the light in-tensity of each band is unevenly distributed, the surface shape of each farmland object is different and dark current exists in the camera, resulting in a large noise in the weaker light intensity distribution band image. Therefore, the collected images must be corrected to eliminate noise. As SpectralSIS hyperspectral data acquisition software has self-correction, so it is selected to remove the noise when collected images.
(a) Image information
(b) Spectral information
Figure 2. The image information and spectral information of 1236nm band
Figure 3. The spectral information of farmland hyperspectral image
useless, so spectral cut the images and retained 934-1343nm and 1485-1685nm bands of 185 images to reduce the amount of hyperspectral image data for subsequent analysis.
C. Research Methods
1) Select and Purify Reference Points: The super-vised classification accuracy is higher than that of non-supervised classification [10], so this paper used the methods of supervised classification. Because hyperspe-tral images have complex objects, hyperspechyperspe-tral data is different from general data, and the traditional methods for hyperspectral data are difficult, in this way, some special methods and techniques are needed, such as spectral matching technique, spectral derivative technique. Through a series of tests, finally we selected spectral angle mapper, binary encoding and spectral information divergence three methods on farmland objects extraction.
Figure 4. Reference points
TABLE I.
PURIFICATION OF THE REFERENCE POINTS
Class Before Purified After Purified
soybean 2112 1980
roads 1764 1600
trees 1680 1558
soil 1188 986
total 6744 6124
In order to realize spectral matching, some reference points are selected from the images. Fig.4 shows the reference points of the four objects. The selected reference points may be mixed with other types of samples, in order to improve the classification accuracy of the image, we need to purify the reference samples. In this paper, we used N-dimensional visualization analyzer to purify the reference pixels. Table I shows the purification of the reference points. After purification of the samples we selected 6,124 sample points: soybeans 1980, road 1600, trees1558 and soil 986.
2) Spectral Angle Mapper (SAM): In the multi-dimensional spectral space, different objects have dif-ferent spectral angular directions [11]. Spectral angle mapper is a method of supervised classification based on its own features. With N number of spectral bands as the N-dimensional space vector, by calculating the angle between it and the reference spectra to determine the sim-ilarity between the two spectra: the smaller the angle, the closer the matching. Spectral angle mapper technology is a method based on the vector space and the spectral shape analysis. It is not only suitable for feature spectral shape overall similarity analysis of image classification, but also can improve the spectral variability of hyperspectral data caused by illumination and topography [12]. Cosine of the angle between two vectors is generalized as formula(1),
cosθ= X•Y
|X||Y| (1)
Spectral angle mapper [13] is a classification method based on correlation/matching filter, making full use of the spectrum-dimensional information and emphasizing the shape characteristic of the spectrum, greatly reducing the characteristic information, which is one of the com-monly used methods of hyperspectral image classification currently.
The binary encoding method based on the value of the band which falls above or below the average value of the reference spectrum to encode the spectrum and the reference spectrum pixel as 0 or 1. The XOR logic function is used to compare the coded reference spectrum with the coded pixel spectrum to generate a classification image.
r(i, j, n′) =
{
1, y(i, j, n)> m(i, j),
0, otherwise. (2)
Wherey(i, j, n)is the gray value of band image,m(i, j) is the gray value of mean image, n and n′ are band numbers, n = 1,· · ·, N −1, n′ = N + 1,· · ·, N, i, j are hyperspectral image pixel ranks numbers.
4) Spectral Information Divergence: Spectral informa-tion divergence [14] is realised by computing SID (spec-tral information divergence) between the pixel spectrum and the reference spectrum to determine their similar-ity. Regard the hyperspectral image as N-dimensional space vector, and assume that the spectrum of two hyperspectral images wereA = (A1, A2,· · ·AN), B =
(B1, B2,· · ·BN), the spectral information divergence is: SID(A, B) =D(A∥B) +D(B∥A), (3) where
D(A∥B) =
N ∑
i=1
pilog(pi/qi) (4)
D(B∥A) =
N ∑
i=1
qilog(qi/pi) (5)
pi=Ai/ N ∑
i=1
Ai (6)
qi=Bi/ N ∑
i=1
Bi (7)
Based on probability theory and statistics theory, this method is applied to analyze the similarity between pixel spectrum with the reference spectrum. The reference spectrum is usually from the ASCII file and the spectral library or directly extracted from the image. In this paper it come from the images.
IV. RESULTS ANDANALYSIS
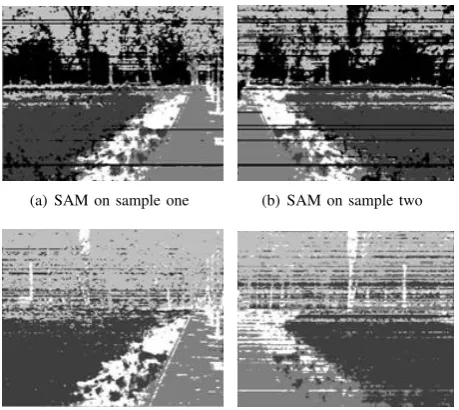
The performance of spectral characteristics of different farmland objects are various, and it will lay a foundation for the spectral matching recognition classification. This paper selected two greatly different images for analysis, then assessed one classification accuracy of of the two. Both of the two images have multiple objects and complex background which are suitable for research. In accordance with the methods described in III-C, we extracted the farmland objects of the hyperspectral image samples. Fig.5 shows the extraction results.
Classification accuracy is usually expressed in three ways: overall accuracy, producer accuracy and user accu-racy, Kappa coefficient. The overall accuracy is the total
(a) SAM on sample one (b) SAM on sample two
(c) Binary Encoding on sample one (d) Binary Encoding on sample two
(e) SID on sample one (f) SID on sample two
Figure 5. Farmland objects extraction images
TABLE II.
SPECTRALANGLEMAPPERRESULTS
Class Refer Correct Classified
Producer User
-ence Accuracy Accuracy
(%) (%)
Soybean 1980 1847 1859 93.3 99.4
Roads 1600 1401 1495 87.6 93.7
Trees 1558 1099 1116 70.5 98.5
Soil 986 926 966 94.1 96.1
correct pixels divided by the total reference pixels. The producer accuracy is the ratio of the correct pixels with the reference pixels, and the user accuracy is the ratio of the correct pixels with the classified pixels. Table II shows the spectral angle mapper method detection results. Table III shows the binary coding method detection results. Table IV shows the spectral information divergence method detection results.
TABLE III. BINARY ENCODING RESULTS
Class Refer Correct Classified
Producer User
-ence Accuracy Accuracy
(%) (%)
Soybean 1980 1847 2016 93.3 91.6
Roads 1600 1412 1468 88.3 96.2
Trees 1558 1396 1538 89.6 90.8
Soil 986 936 1102 94.9 84.9
TABLE IV.
SPECTRAL INFORMATION DIVERGENCE RESULTS
Class Refer Correct Classified
Producer User
-ence Accuracy Accuracy
(%) (%)
Soybean 1980 1964 1965 99.2 99.9
Roads 1600 1461 1579 91.3 92.5
Trees 1558 1482 1482 95.1 100.0
Soil 986 952 1098 96.6 86.7
spectral information divergence method use the spectral information relative entropy as the measure of similarity evaluation. From the view of different fields objects, the producers accuracy and users accuracy of soybean and soil are high while the roads and trees are low. In trees, for example, in the spectral angle mapper method, the reference pixels are 1558, the number of correctly classified is 1099, the number of divided into trees is 1116. Fig.5(a) shows that the majority of trees pixels are divided into background, and some trunks are divided into roads which leading to the low producers accuracy. Part of the soybean is divided into trees causing the high user accuracy. Because part of soybean leaves, trees leaves and the background area have similar spectral characteristics, and the trunk and part of the soil as well as part of the roads are connected, so the classification is not clear, leading to the misclassification of trees. From the view of user accuracy, the user accuracy of soil is the lowest in the binary coding method. Fig.5(c) shows that part of the trunk and part of the road are divided into the soil.
V. CONCLUSIONS
Nowadays, it is necessary and important to collect agricultural farmland data and information rapidly and ac-curately. In this paper, NIR farmland hyperspectral images were selected as the research objects. First, we conducted spectral analysis and cutting of the hyperspectral images, and selected 185 bands valid data. Because supervised classification accuracy is higher than unsupervised clas-sification, and is more suitable for hyperspectral images precise classification. After a series of tests, we adopted the spectral angle mapper, binary encoding and spectral information divergence methods to extract and analyze the farmland objects. The results reflect the effectiveness of the three methods and the total average classifica-tion accuracy has reached 85% or more, in which the spectral information divergence method is the highest of 93.9%. The results indicated that the use of hyperspectral imaging, spectral analysis and supervised classification methods can be implemented quickly and effectively
on farmland objects extraction and analysis for outdoor farmland near infrared hyperspectral images studies, and provided some demonstrations in favor of the outdoor farmland hyperspectral images in-depth study.
As part of the bands have same spectrum but dif-ferent objects or same objects but difdif-ferent spectrum phenomena, spectral characteristics alone is not enough to express the classes and the results appear in a bad line. Therefore, the classification results and the accuracies will be affected. Our future work will focus on depther research, we can use a certain segmentation method to divide the hyperspectral images, and then extract the dividing units and use the acquired feature information for further research.
ACKNOWLEDGMENT
The authors are grateful to the anonymous referees for their valuable comments and suggestions to improve the presentation of this paper.
REFERENCES
[1] J. Song, Z. Zhang, and X. Chen, “Hyperspectral imagery compression via slms filter and multiband lookup tables,”
Journal of Computational Information System, vol. 9,
no. 13, pp. 5345–5351, 2013.
[2] W. Zhang, J. Zhang, and Y. Zhang, “Hyperspectral image segmentation method based on region active contour,”
Remote Sensing Technology and Application, vol. 23, no. 3, pp. 351–355, 2008.
[3] J. Zhang, X. Zhu, and Y. He, “Application of hyperspectral
remote sensing images classification method,” Computer
Simulation, vol. 29, no. 2, pp. 281–284, 2012.
[4] L. Liu, X. Jiang, X. Li, and L. Tang, “Study on classifica-tion of agricultural crop by hyperspectral remote sensing
data,”Journal of Graduate School of the Chinese Academy
of Sciences, vol. 23, no. 4, pp. 484–488, 2006.
[5] K. Wang, X. Gu, T. Yu, Q. Meng, L. Zhao, and L. Feng, “Classification of hyperspectral remote sensing images
using frequency spectrum similarity,” Technological
Sci-ences, vol. 56, no. 4, pp. 980–988, 2013.
[6] A. Goetz, G. Vane, J. Solomon, and B. N. Rock, “Imaging
spectrometry for earth remote sensing,”Science, vol. 228,
pp. 1147–1153, 1985.
[7] G. Vane, R. Green, T. Chrien, H. Enmark, H. E.G., and P. W.M., “The airborne visible/infrared imaging
spectrom-eter,”Remote Sensing of Enviroment, vol. 44, pp. 127–143,
1993.
[8] J. Shan, Y. Peng, W. Wang, Y. Li, J. Wu, and L. Zhang, “Simultaneous detection of external quality based
hyper-spectral imaging technology apple,”Agricultural
Machin-ery, vol. 42, no. 3, pp. 141–144, 2011.
[9] S. Ding, “Spectral and wavelet-based feature selection with particle swarm optimization for hyperspectral
classifica-tion,” Journal of Software, vol. 6, no. 7, pp. 1248–1256,
2011.
[10] L. Huang and Z. Shen, “Supervised classification of
hyper-spectral remote sensing image,” Geospatial Information,
vol. 9, no. 5, pp. 81–83, 2011.
[11] F. Kruse, A. Lefkoff, J. Boardman, K. Heidebrecht, A. Shapiro, B. P.J., and G. A.F.H., “The spectral image processing system (sips) interactive visualization and
anal-ysis of imaging spectrometer data,” Remote Sensing of
[12] Z. Wang, Z. Zhu, H. Wang, and Q. Liu, “Applications of spectral angle mapping method in lithological
identifica-tion,” Journal of remote sensing, vol. 3, no. 1, pp. 1–6,
1999.
[13] Q. Li, Y. Xue, J. Wang, and X. Yue, “Automated tongue segmentation algorithm based on hyperspectral image,”
Infrared Millim Waves, vol. 26, no. 1, pp. 77–80, 2007. [14] G. Dong, Y. Zhang, C. Dai, and X. Deng, “Target
recogni-tion for hyperspectral image based on sid spectral feature,”
Chinese Journal of Scientific Instrument, vol. 27, no. 6, pp. 2091–2092, 2006.
Jinglei Tangreceived her B.S. degree in agricultural mechaniza-tion from HeBei Normal University of Science and Technology, China in June 1997 and her M.S. degree in computer science from Southwest Science and Technology University, China in June 2006 and her Ph.D. degree in mechanical and electronic engineering from Northwest A&F University, China in June 2010. She is a associate professor in Northwest A&F University, China. Her main research interests include machine vision, image processing and pattern recognition.