Patron: Her Majesty The Queen Rothamsted Research Harpenden, Herts, AL5 2JQ
Telephone: +44 (0)1582 763133 Web: http://www.rothamsted.ac.uk/
Rothamsted Research is a Company Limited by Guarantee Registered Office: as above. Registered in England No. 2393175. Registered Charity No. 802038. VAT No. 197 4201 51.
Rothamsted Repository Download
E - Books edited/written by staff member, alone/with others
Macdonald, A. J., Poulton, P. R., Clark, I. M., Scott, T., Glendining, M. J.,
Perryman, S. A. M., Storkey, J., Bell, J. R., Shield, I. F., Mcmillan, V. E.
and Hawkins, J. M. B. Macdonald, A. J. (ed.) 2018. Rothamsted
Long-term experiments : guide to the classical and other long-Long-term
experiments, datasets and sample archive. Rothamsted Research,
Harpenden.
The publisher's version can be accessed at:
•
https://dx.doi.org/10.23637/ROTHAMSTED-LONG-TERM-EXPERIMENTS-GUIDE-2018
The output can be accessed at:
https://repository.rothamsted.ac.uk/item/8w189/rothamsted-long-term-experiments-guide-to-the-classical-and-other-long-term-experiments-datasets-and-sample-archive
.
© 21 May 2018, Rothamsted Research, Harpenden.
Guide to the Classical and other Long-term
experiments, Datasets and Sample Archive
Edited by
A. J. Macdonald
Contributors
Andy Macdonald, Paul Poulton, Ian Clark, Tony Scott,
Margaret Glendining, Sarah Perryman, Jonathan Storkey, James Bell, Ian Shield, Vanessa McMillan and Jane Hawkins.
Rothamsted Research
CONTENTS
INTRODUCTION 4
THE CLASSICAL EXPERIMENTS 7
Broadbalk Winter Wheat 7
Broadbalk and Geescroft Wildernesses 19
Park Grass 20
Hoosfield Spring Barley 31
Exhaustion Land 34
Garden Clover 36
OTHER LONG-TERM EXPERIMENTS 37
At Rothamsted 37
At Woburn 39
RESERVED AND DISCONTINUED EXPERIMENTS 41
Barnfield 41
Hoosfield Alternate Wheat and Fallow 41
Woburn Market Garden 42
Agdell 42
The Woburn Intensive Cereals Experiments 43
Saxmundham, Rotations I & II 43
Amounts of Straw and Continuous Maize Experiments 44
(Rothamsted and Woburn)
METEOROLOGICAL DATA 45
LONG-TERM EXPERIMENTS AS A RESOURCE 45
THE ROTHAMSTED SAMPLE ARCHIVE 47
ELECTRONIC ROTHAMSTED ARCHIVE (e-RA) 49
THE ROTHAMSTED INSECT SURVEY (RIS) 50
UK ENVIRONMENTAL CHANGE NETWORK (ECN) 52
NORTH WYKE FARM PLATFORM 53
MAP OF ROTHAMSTED FARM 28
REFERENCES 56
2018 © Rothamsted Research (Reprinted 2019)
ISBN 978-1-9996750-0-4 (Print) ISBN 978-1-9996750-1-1 (Online)
Front cover
Broadbalk from the air, 2015
Back cover
Park Grass from the air, 2015 The Rothamsted Long-term Experiments
are supported by the UK Biotechnology and Biological Sciences Research Council
under the National Capabilities programme
FOREWORD
It is a testament to the foresight and commitment of Sir John Lawes and Sir Henry
Gilbert, as well as others who have come after them, that field experiments established as long as 175 years ago continue to reveal new insights and important findings of relevance to today’s agriculture and its interactions with our
ever-changing environment. At Rothamsted,
our tradition has been to not only make these
unique resources available to researchers from all over the world, but also use them for
answering new questions, with new scientific
methods and techniques. Hence, the classical experiments and other long-term studies provide a vital reservoir for advancing science
and we hope that this will continue for many
more decades to come.
Managing and documenting these experiments
and their associated data and archives is not a trivial task. It requires funding, rigour,
adaptation, and – most importantly – people
who are dedicated to them. I am grateful to Andy Macdonald and his colleagues for assembling this much revised summary of Rothamsted’s long-term experiments which, I am sure, will be of great value to the
scientific community and the public at large.
ACHIM DOBERMANN
Director April 2018
Harvesting wheat on Broadbalk by small-plot combine, 2017
By reaper-binder in 1935
2018 © Rothamsted Research (Reprinted 2019)
INTRODUCTION
The Classical experiments is the name now given to those experiments started by Lawes and Gilbert between 1843 and 1856, and
which still continue. Although they were not
intended to be long-term, Lawes and Gilbert
realised that much useful information could be gained by continuing them over many growing seasons. Nine experiments were continued of
which they abandoned only one, in 1878. Some
treatments were changed during the first few
years and, later, further changes were made
to answer specific questions raised by the results. In particular, two Wilderness studies
were established in the 1880s to examine the
effects of abandoning arable land. When Lawes
died in 1900, the eight remaining experiments
were continuing more or less as originally planned. Modifications have been made to the
experiments since Lawes died, in some cases
discontinuing the original treatments. Seven of the Classical experiments continue today. They are the oldest, continuous agronomic
experiments in the world.
Their main objectives were to measure the effects on crop yields of inorganic compounds
containing nitrogen, phosphorus, potassium, sodium and magnesium (N, P, K, Na and Mg), elements known to occur in considerable amounts in crops and farmyard manure (FYM),
but whose separate actions as plant nutrients
had not been studied systematically. The materials used were superphosphate (first made at Rothamsted by treating bones with
sulphuric acid), the sulphates of K, Na and Mg
(often referred to then, and in this Guide, as
minerals), and ammonium salts and sodium
nitrate (as alternative sources of nitrogen). The effects of these inorganic fertilisers were
compared with those of FYM and rape cake in most of the experiments. The inorganic
fertilisers were tested alone and in various combinations. Nitrogen was often applied
at two or more rates.
Growing the same crop each year on the same land was a feature of many of the experiments. Considered bad farming in the nineteenth century, Lawes and Gilbert reasoned that it was the best way to learn about individual crop nutrient requirements. Lawes and Gilbert recorded the yields of all produce harvested from each plot and samples were kept for chemical analyses. These results, together with
details of the quantity and composition of each fertiliser applied, enabled a balance sheet for
the major nutrients to be compiled for each plot. Analyses of soil samples showed how N, P and K accumulated or diminished in soil
depending on fertiliser or manure applications, offtakes in crops and losses in drainage water.
The results were of immediate importance to farmers, showing which nutrients had the
largest effects on different crops. However, the Sir Joseph Henry Gilbert
value to farmers of later results diminished
as the contrasted processes of depletion and enrichment of nutrients went on. In addition, the annual applications of FYM caused the soil organic matter contents of fertiliser- and FYM-treated soils to become increasingly different. Until c.1939 the best yields on each experiment were similar to the average yields of the same
crops grown on English farms. After 1939, with the introduction of higher yielding cultivars and increased use of fertilisers, farm yields in England exceeded those of the Classicals until changes to the latter were made in the 1960s. The Classical experiments have been modified
occasionally since Lawes’s death. Daniel Hall,
in 1903–06, added a few plots to Broadbalk, Park Grass and Barnfield; mainly to test the effects of P in the presence of NKNaMg, which had been omitted from these experiments. Hall also instigated the first regular liming scheme on Park Grass; the only Classical
experiment not sited on a neutral or slightly calcareous soil. Most of the arable experiments
are on fields that had received the traditional heavy dressings of locally-dug chalk, a practice
not followed on grassland.
By the late 1940s there was increasing concern that the soils in a number of plots receiving ammonium sulphate in the Classical experiments were becoming so acid that yields
were adversely affected. Thus, comparisons of
ammonium sulphate and sodium nitrate as N sources were no longer possible. In the Agdell
rotation experiment, acidity became so severe
on the NPK plots that the fungal disease club root (Plasmodiophora brassicae) so decreased yields of turnips that the experiment had to
be extensively modified in 1951. Over the
next few years, soil acidity on the arable
experiments was corrected by differential lime (chalk) applications, and a schedule of liming
was started to prevent acidity developing
again. Following these changes it was decided to assess the value of the reserves of soil P and
K accumulated in the Agdell and Exhaustion
Land experiments by both soil analysis and
crop yield. On Barnfield, not only was the value
of the P and K reserves tested but also the
benefit of the extra soil organic matter (SOM)
in the FYM-treated soils. These tests were made by sub-dividing the original large plots
into sub-plots to test fresh applications of
N, P and K as appropriate.
These changes provided much new and
valuable information. Consequently, in the mid-1960s, discussions started about modifications to the Broadbalk, Hoosfield Barley and Park
Grass experiments to make the treatments and
the results more relevant to farming practice at that time. The management, cropping
and treatments on these experiments were
reviewed and modifications introduced to
ensure that, as far as possible, the experiments
remained relevant to farming practice but
without losing their long-term integrity. One important change, made on all the cereal experiments, was the replacement of
long-strawed cultivars with modern, short-long-strawed varieties that had greater potential grain yield.
Another major change, introduced in 1968, except on Park Grass, was the replacement of ammonium sulphate and sodium nitrate by
ammonium nitrate, initially as ‘Nitro-Chalk’ (calcium ammonium nitrate), now as ‘Nitram’
(ammonium nitrate). More recent changes are detailed later.
In addition to the Classical experiments started
by Lawes and Gilbert, there are (or were) several other long-term experiments on the
flinty silty clay loam (Avery & Catt, 1995) at
Rothamsted and at two other sites, Woburn
Agricultural Society of England (RASE) started
experiments in 1876 to compare different
animal feeds, and assess the residual values of the dungs as sources of plant nutrients (to test
the validity of Lawes and Gilbert’s findings). In addition, RASE started other experiments on wheat and barley grown continuously. On
a heavy sandy clay loam soil at Saxmundham,
Suffolk (Hodge, 1972), two long-term rotation experiments were started by East Suffolk
County Council in 1899. These were extensively
modified when Rothamsted took over the
site in 1964 and have provided much valuable data on crop responses to P and K on a heavier soil. Rothamsted relinquished the lease on the Saxmundham site in 2010. Although now
discontinued, samples and data from these and other discontinued experiments are retained
for future use.
With remarkable prescience, Lawes and Gilbert retained samples of crops and soils taken for
chemical analysis once the initial analyses had been completed. Successive generations of scientists at Rothamsted have continued to add to the collection and the resulting
Rothamsted Sample Archive (RSA) now comprises > 300,000 samples. This unique
resource is of immense value; analyses of
archived material allow us to generate new data stretching back more than 175 years.
The collection of long-term datasets is not confined to the Classical and other long-term field experiments. Meteorological
measurements have been made since the
1850s, when Lawes and Gilbert first collected
and analysed rain-water. With current concerns over climate change the long-term weather
records provide invaluable information about the climatic conditions under which the crops
have been grown. Rothamsted has also been
monitoring insect populations since 1964. The Rothamsted Insect Survey comprises national
networks of light traps, to record moths, and
suction traps, principally to monitor migrating
aphids. It provides the most extensive
long-term quantitative datasets on insect populations in the world.
Rothamsted (and North Wyke Research, which merged with Rothamsted Research in 2009) are two of the lead sites within the Environmental Change Network (ECN), which comprises 11 terrestrial sites and > 40 freshwater sites across the UK. The ECN sites monitor a large number of pollutants and climate change variables
and the associated effects on soil, vegetation,
insects and mammals.
The Electronic Rothamsted Archive (e-RA)
is being continually updated to increase the amount of numerical and descriptive data
included from the long-term experiments
and ECN. In time this will allow ready access
to the large volume of data that has been accumulated at Rothamsted since 1843.
THE CLASSICAL EXPERIMENTS
Broadbalk field is thought to have been in
arable cropping for many centuries prior to
1843. The first experimental crop of winter
wheat was sown in autumn of that year and
harvested in 1844 (by convention, when we
refer to a year it is the harvest year unless stated otherwise). Every year since then, wheat has been sown and harvested on all or
part of the field. Inorganic fertilisers supplying
the elements N, P, K, Na and Mg in various
combinations were compared with organic
manures (FYM and rape cake, later replaced by castor bean meal) and a control treatment that
received no fertiliser or manure inputs. For the first few seasons these treatments were varied a little but in 1852 a scheme was established that remained largely unaltered until 1968 (Table 1). In the early years the field was ploughed in ‘lands’ by oxen (later by horses)
and all the crop from each plot was cut with scythes, bound into sheaves and carted into the barns to await threshing. Yields of grain and straw were recorded and samples kept for chemical analysis. Broadbalk is now ploughed
by a tractor-mounted five-furrow reversible
plough and harvested by a small plot combine
harvester; only the central area (2m wide)
located along the length of each plot is cut for yield and samples.
Weeds were initially controlled by hand-hoeing. When this became impracticable, five ‘Sections’, (I–V on plan), crossing all the treatment strips (initially called plots) at
right angles, were made and bare fallowed
sequentially (Plan 1). Fallowing was mainly in a 5-year rotation of fallow with four successive
crops of wheat, with each phase present each year. Herbicides have been used since 1964 on all of the experiment, except for half of
Section V (now Section 8; see later).
Chalk has been applied intermittently since
the 1950s to maintain soil pH at a level at which crop yield is not limited.
Details of, and results from the experiment, up to 1967 can be found in the Report for
Rothamsted Experimental Station for 1968,
Part 2 (1969).
After correction of soil acidity on parts of
the experiment in the 1950s, a review of the treatments and management led to
modifications being introduced in 1968. The most significant of these were i) the change
from long-strawed to modern, short-strawed
cultivars of wheat with a greater grain yield potential and ii) the division of Sections I – V to create 10 new Sections 0 – 9 (Plan 1 and
Table 1), so that the yield of wheat grown
continuously could be compared with that of wheat grown in rotation after a two-year break. We continue to review the experiment
regularly and to make changes, but only when
there is a strong scientific case for doing so. An
important change, made for the 2000 season,
was to withhold P fertiliser from selected plots.
This will allow plant-available P (Olsen P) to decline to a level which is suitable for achieving maximum yield whilst reducing the chance of P being lost in drainage water. Also in 2000, treatments on four strips were changed such
that a test of split N applications could be included and applications of sulphur-containing fertilisers on strip 14 were stopped. Most of
the treatment changes are shown in Table 1 that accompanies the plan of the experiment.
Sections 0, 1, 8 and 9 continued to grow
wheat only, with occasional fallows to control
weeds on Section 8 which does not receive herbicides. Sections 2, 4, 7 and Sections 3, 5,
20
Strip
320m
19 18 17 16 15
Mown
14 13 12 11 10 9 8 7 6 5 3 2.2 2.1 1
N
FYM res N4
19 18 17 16 15 14 13 12 11 10 9 8 7 6 5 3 2.2 2.1 1
Continuous wheat
Continuous wheat
Continuous wheat
Beans Wheat Wheat Oats Wheat from 2019
Beans Wheat Wheat Oats Wheat from 2018
Drainage ditch
NB Treatments revised for 2001 & rotations revised in 2018 Wheat Oats Wheat Beans Wheat from 2019
Oats Wheat Beans Wheat Wheat from 2018
Oats Wheat Beans Wheat Wheat from 2019 Straw incorporated since autumn 1986
No spring or summer fungicides
Continuous wheat autumn 1993Re-drained No herbicides Wheat
Occasional fallow
Section 1926-67 Section
1968-I
1 0
II 2
3
III
4
5
IV 6
7
V 8
9 Stubbed
Wooded
Broadbalk Wilderness
N
4 1.1.1 1.2.1 1.4.1 6 5 4 4 1.3.1 4 4 4 3 2 1 – – 3
– – P P (P) (P) P P (P) P – (P) (P) (P) (P) (P) Nil – – K K K K K K K* K K2 – – K K K K K – –
Mg Mg Mg Mg Mg Mg(Mg*)– Mg2 Mg – Mg Mg Mg Mg Mg – –
Strip
Table 1. Broadbalk fertiliser and organic manure treatments
Treatments Treatments Treatments Treatments
Strip until 1967 from 1968 from 1985 from 2001
01 - FYM N2 PK FYM N4 PK (FYM) N4 2.1 FYM since 1885 FYM N2 FYM N2 FYM N3(1)
2.2 FYM FYM FYM FYM
03 Nil Nil Nil Nil
05 PKNaMg PK(Na)Mg PKMg (P)KMg 06 N1 PKNaMg N1 PK(Na)Mg N1 PKMg N1 (P)KMg 07 N2 PKNaMg N2 PK(Na)Mg N2 PKMg N2 (P)KMg 08 N3 PKNaMg N3 PK(Na)Mg N3 PKMg N3 (P)KMg 09 N*1 PKNaMg N4 PK(Na)Mg N4 PKMg N4 (P)KMg
10 N2 N2 N2 N4
11 N2 P N2 P N2 P N4 P Mg
12 N2 P Na N2 P Na N2 P Na N1+3+1(P)KMg(2)
13 N2 PK N2 PK N2 PK N4 PK
14 N2 P Mg* N2 PK Mg* N2 PKMg* N4 PK*(Mg*) 15 N2 PKNaMg N3 PK(Na)Mg N5 PKMg N5 (P)KMg 16 N*2 PKNaMg N2 PK(Na)Mg N6 PKMg N6 (P)KMg 17 N2(A) N2 ½[PK(Na)Mg] N0+3 ½[PKMg](A) N1+4+1 PKMg 18 PKNaMg(A) N2 ½[PK(Na)Mg] N1+3 ½[PKMg](A) N1+2+1 PKMg
19 C C (C) N1+1+1 KMg
20 N2 KNaMg N2 K(Na)Mg N2 KMg N4 KMg
(A) Treatment to strips 17 & 18 alternating each year. From 1968 both strips received N2 and ½-rate PK(Na)Mg; from 1980 wheat on strips 17 & 18 received N1+3 i.e. autumn N1 in alternate years plus N3 in spring.
Annual treatment per hectare
FYM : Farmyard manure at 35t N to wheat as single applications (mid-April)
(FYM) : Farmyard manure at 35t 1968-2000 only N1, N2, N3, N4, N5, N6 : 48, 96, 144, 192, 240, 288 kgN P : 35kgP as triple superphosphate
(P) : 35kgP as triple superphosphate until 2000; Split N to wheat (mid-March, mid-April, mid-May)
to be reviewed in 2021 N1+1+1 : 48+48+48 kgN (strip 19) K : 90kgK as potassium sulphate N1+2+1 : 48+96+48 kgN (strip 18) K2 : 180kgK as potassium sulphate, 2001-2005. N1+3+1 : 48+144+48 kgN (strip 12)
(plus 450 kgK in autumn 2000 only) N1+4+1 : 48+192+48 kgN (strip 17) K* : 90kgK as potassium chloride
Mg : 12kgMg as Kieserite.Was 35kgMg every 3rd N to oats at ½-rate, as a single application (mid-April)
year 1974-2000.Previously 11kgMg as ½N1, ½N2, ½N3, ½N4, ½N5, ½N6 : 24, 48, 72, 96,
magnesium sulphate until 1973 120, 144 kgN
Mg2 : 24kgMg as Kieserite, 2001-2005. Oats on strips 19, 18, 12 and 17 also receive N as a single
(plus 60 kg Mg in autumn 2000 only) application; ½N3, ½N4, ½N5, ½N6 respectively
(Mg*) : 30kgMg as Kieserite 1974-2000.Previously
31kgMg as magnesium sulphate until 1973 No N or FYM to beans from 2018 (Na) : 16kgNa as sodium sulphate until 1973;
55kgNa on strip 12 only until 2000 (57kgNa N as ammonium nitrate (Nitram, 34.5% N) since 1986;
until 1973) calcium ammonium nitrate (Nitro-chalk, c.26% N) 1968-85;
(C) : Castor meal to supply 96kgN until 1988 ammonium sulphate or sodium nitrate (N*) until 1967. (1) : FYM N2 from 1968-2004
(2) : N1+3+1 (P)K2Mg2 from 2001-2005
Note : S has been added, by default (except on strip 14 since 2001), as part of the potassium sulphate, magnesium sulphate, Keiserite, FYM
and ammonium sulphate applications. S last applied to strip 14 in 2000.
In 2018 the rotation on five sections of the experiment changed to Wheat, Wheat, Oats, Wheat, Beans. The oats will receive N at half of the normal rate (see above); the beans will not receive N or FYM.
In the previous rotation, Wheat, Wheat, Wheat, Oats, Maize from 1996-2017, oats did not receive N or FYM. In earlier rotations from 1968-1995, beans did receive N, FYM (and PK etc.); fallows in the rotations (and on Section 8)
6 went into two different 3-course rotations in 1968. Section 6 reverted to continuous wheat in 1978 and the other five Sections went into a 5-course rotation; initially fallow, potatoes,
wheat, wheat, wheat and from 1997-2017,
oats (without N), forage maize, wheat, wheat,
wheat. In autumn 2017 winter beans replaced
maize and a new rotation of beans (without
N), wheat, wheat, oats, wheat began. Beans were grown on Broadbalk from 1968-1978,
but they received fertiliser N so their residual nutrient value without fertiliser N has not been
tested. Winter oats, now given N as a single dose at half the usual rates applied to wheat on Broadbalk, were kept as a break crop to help control soil borne pests and diseases, especially take-all (Gaeumannomyces graminis var. tritici).
The inclusion of two first wheats in the new rotation is designed to enhance the overall productivity of the rotation and examine its
longer-term sustainability (Plan 1 and Table
1). Pesticides continue to be applied when necessary, except for Section 6 which does
not receive spring or summer fungicides and
Section 8 which has never received herbicides. On Section 0, the straw on each plot has been chopped after harvest and incorporated into the soil since autumn 1986; on all other Sections, straw is baled and removed. In his first Rothamsted paper, published
in 1847, Lawes described the Broadbalk
soil as a heavy loam resting upon chalk,
capable of producing good wheat when well manured (Lawes, 1847). Similar land in the
neighbourhood, farmed in rotation, typically
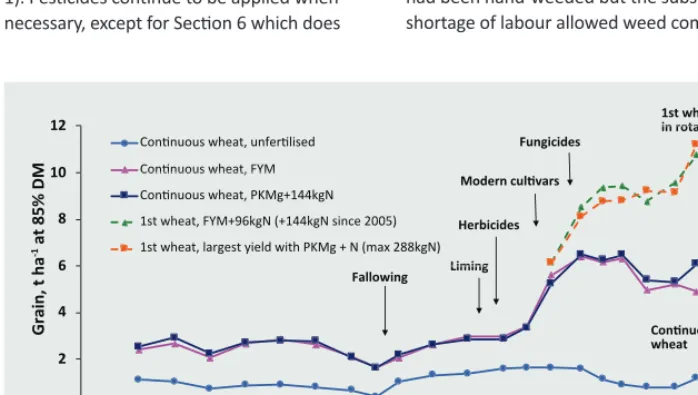
yielded c.1.2 t ha-1. Figure 1 shows yields from selected treatments since the 1850s.
The changes reflect the improved cultivars, cultivations and control of pests, diseases
and weeds that have been introduced on Broadbalk (and on English farms generally), especially since the 1960s.
Until the First World War, the experiment
had been hand-weeded but the subsequent
shortage of labour allowed weed competition
Fig. 1 Broadbalk: Mean yields of wheat grain and changes in husbandry (1852-2016)
0 2 4 6 8 10 12
1840 1860 1880 1900 1920 1940 1960 1980 2000 2020
Grain, t ha
-1 at 85% DM
Year and cultivar
Continuous wheat, unfertilised Continuous wheat, FYM Continuous wheat, FYM Continuous wheat, PKMg+144kgN 1st wheat, FYM+96kgN (+144kgN since 2005) 1st wheat, FYM+96kgN (+144kgN since 2005) 1st wheat, largest yield with PKMg + N (max 288kgN)
Fallowing LimingLiming Herbicides Herbicides
Fungicides
Red Rostock Red Club Sq. Master Red Standard Sq. Master
Cappelle D.Flanders ApolloBrimstoneApolloHereward 1st wheat in rotation in rotation
Continuous wheat Modern cultivars
to become so severe that yields on all treatments had declined by the 1920s. To control weeds, the experiment was divided
into five sections (see plan) and one section bare-fallowed each year; yields recovered. Yields of wheat (mean of the four sections where wheat was grown) given no fertiliser or
manure were c.1.4 t ha-1 y-1 (Figure 1), slightly larger than yields in earlier years. Mean yields of wheat given PKNaMg+144 kg N ha-1 were
similar to those of wheat given FYM. After
the change from Squarehead’s Master to the
shorter-strawed cultivar Cappelle Desprez
in 1968, mean yields of grain on these two treatments doubled to about 5.4 t ha-1. Since 1968 we have been able to compare the
yields of wheat grown continuously and as the first wheat after a two-year break (Dyke
et al., 1983). In the 10 years in which Cappelle
Desprez was grown, foliar fungicides were not applied and foliar diseases, particularly
powdery mildew, were common, and most severe on plots given most nitrogen. Since
1979, summer fungicides have been used,
when necessary (except on Section 6), and this
has allowed us to exploit the greater grain yield
potential of modern cultivars. The increased responses to N fertiliser in 1979-84 suggested
that yields might be greater if larger rates of N were applied, and since 1985 rates of 240 and 288 kg N ha-1 have been tested. Yields of
wheat grown after a two-year break can be
over 2 t ha-1 larger than yields of continuous
wheat, almost certainly because the effects of soil borne pests and diseases, particularly
take-all (Gaeumannomyces graminis var.
tritici), are minimised (see later). With cv.
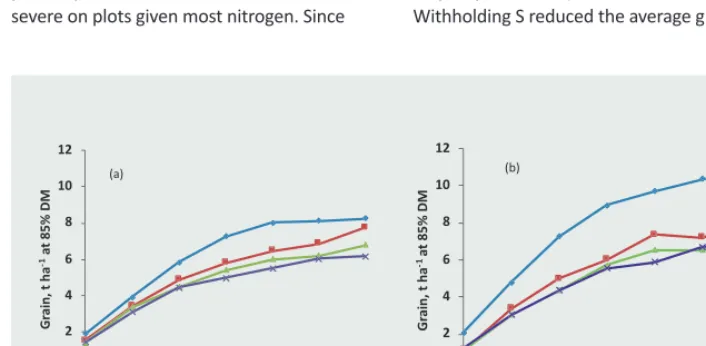
Crusoe, the largest yields exceeded 13 t ha-1
for winter wheat in rotation and yields were
on average greater than with the previous variety (cv. Hereward), especially at the higher
N rates (Figure 2). Withholding P fertiliser since 2000 has had no detrimental effect on yields as plant-available P in the soil still exceeds crop requirements (>Index 3; Defra 2010).
Withholding S reduced the average grain
Fig. 2 Broadbalk; mean yields of wheat grain for (a) cv. Hereward, 2009-2012, and (b) cv. Crusoe,
2013-2017 (excluding 2015). Data are for: (x) continuous wheat; (♦) 1st wheat after a two-year break; (■) 2nd wheat; (▲) 3rd wheat.
0 2 4 6 8 10 12
0 48 96 144 192 240 288
Gr
ai
n, t ha
-1at
85%
D
M
N applied, kg ha-1(+PKMg) (a)
0 2 4 6 8 10 12
0 48 96 144 192 240 288
Gr
ai
n, t ha
-1at
85%
D
M
N applied, kg ha-1(+PKMg)
yields of first and continuous wheats by 0.6
and 0.2 t ha-1, respectively. Compared to single
applications of N, applying the same amount
of N as three split dressings did not increase grain yield on this soil type (Figures 3). The main purpose of the various crops that
have been grown in rotation with wheat on
Broadbalk since 1968 is to provide a “disease break” (see above and later). However, they
also provide useful additional information. From 1997 to 2017 oats and maize were the two break crops; yields on selected treatments
are shown in Table 2. The oats were not given
fertiliser N or FYM. Thus, on plots where P and K is not limiting, any differences in yield
between treatments were due to residues
of inorganic N from previous applications or from differing amounts of N being mineralised from the soil organic matter (see next section). Forage maize was grown because it is a C4
plant (i.e. it has a different photosynthetic pathway than C3 plants) and has a different
13C “signature” than the C3 plants which have been grown previously on Broadbalk. Thus, we
can distinguish maize-derived organic matter from that of organic matter already in the soil.
Organic matter in the Broadbalk soil
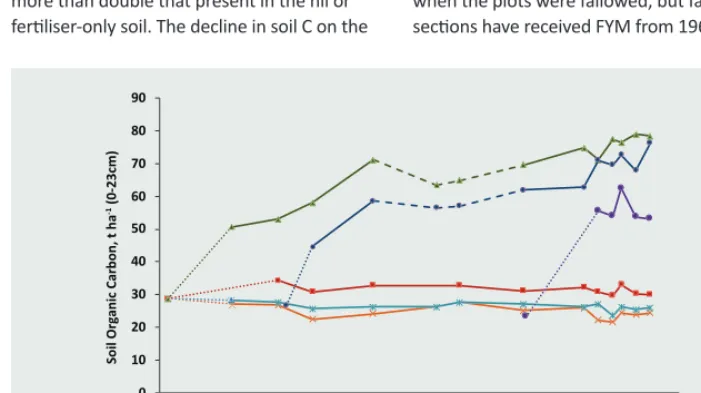
The amount of Organic C (t ha-1) in topsoil (0-23cm) on selected treatments is shown in Figure 4. The C content of some soils has
changed little in more than a century after they were first measured in 1865. By 1865, soil in plots receiving N3PKMgNa fertilisers had a little
more C than soil in the nil and minerals-only
plots because the better-fertilised crop gave
not only more yield, but also more stubble, and probably roots, to be ploughed-in. Soil C
in plots receiving larger amounts of fertiliser
N (192, 240 and 288 kg ha-1) in recent years,
Fig. 3 Broadbalk; mean yields of wheat grain, 2002-11; where N fertiliser was given as single or split applications.
Table 2. Broadbalk; mean yield of oat grain (2011-2015) and forage maize (2008-2012)
Oat grain Forage maize
t ha-1 t ha-1
Strip Treatment(1) 85% DM total DM
3 Nil 1.9 1.7 5 (P)KMg 2.1 3.9 6 N1 (P)KMg 2.3 6.2 7 N2 (P)KMg 2.5 8.8 8 N3 (P)KMg 3.2 8.8 9 N4 (P)KMg 3.2 8.9 15 N5 (P)KMg 4.5 9.1 16 N6 (P)KMg 5.5 8.3 2.2 FYM 6.6 12.0 2.1 FYM N3 7.0 14.6 1 (FYM) N4 5.7 12.6
(1) See Table 1 for details
Note; No N fertiliser or FYM was applied for the winter
oat crops.
Broadbalk, soil sampling, 1944 0
1 2 3 4 5 6 7 8 9 10
0 48 96 144 192 240 288
Gr
ai
n, t ha
-1at
85%
D
M
N applied, kg ha-1 (+PKMg)
and where larger crops have been grown is still
tending to increase. On the FYM treatments,
soil C increased rapidly at first, by about 1 t
ha-1 yr-1, then more slowly, and now contains more than double that present in the nil or
fertiliser-only soil. The decline in soil C on the
FYM plots in the 1920s was because, to control
weeds, all sections were fallowed for two or four consecutive years before regular fallowing started; FYM was not applied in 1925-1968
when the plots were fallowed, but fallow
sections have received FYM from 1968. The Broadbalk experiment
Fig. 4 Broadbalk; long-term changes in soil organic carbon, 1843-2010. Data is from soils where wheat is grown continuously, except that between 1926 and 1967 one or more sections were bare fallowed each year to control weeds; FYM was not applied to the fallow sections. Data has
been adjusted for changes in bulk density.
0 10 20 30 40 50 60 70 80 90
1840 1860 1880 1900 1920 1940 1960 1980 2000 2020 Year
Nil PK
N3PK FYM since 1843
FYM since 1885 + N since 1968 FYM+N 1968-2000; N4 only since 2001
Soil Organic Carbon, t ha
Most soils have a C:N ratio of about 10:1; so % Organic C can be used to calculate % N. The soil %N on Broadbalk closely follows % Organic C,
and N balances, i.e. N input vs N offtake in the
crop and N retained in soil, can be calculated
for different periods. In the early years of the
experiment, about 100 kg of the 225 kg N ha-1 applied in the FYM could not be accounted
for even though much N was accumulating in the soil and N offtakes by the crop were small.
More recently (1990s), inputs of N in FYM and
atmospheric deposition have been greater and although offtakes have been larger, N accumulation in the soil has been much less
and c.200 kg N ha-1 cannot be accounted for. Much N is lost by leaching as nitrate (see later).
The microbiology of Broadbalk
The various treatments on Broadbalk (including the Wilderness) provide an opportunity to
examine the effects of contrasting agricultural management practices on soil microbial populations and the processes mediated by the
soil microbial biomass. The microbial biomass of the FYM plots is approximately twice that
of the plots given either NPK or no fertilisers (Jenkinson & Powlson, 1976). Estimates of the
total numbers of microbial cells in soil vary
depending on the methods used; directly by
microscopy (around 109 cells g-1 soil), indirectly
by quantitative PCR (around 1010 cells g-1 soil) (Clark et al., 2012) or by culturing bacteria (around 105 – 106 cells g-1 soil; Clark et al., 2008). All methods however show a similar trend of increasing microbial abundance with
increased biomass. Approximatively 1% of
bulk soil bacteria are currently culturable. The
relative numbers of specific groups of bacteria that can grow varies according to the selective media used and the environmental conditions at the time of sampling. The recovery of cells by culture on agar may reflect their physiological status when sampled, resulting in apparently lower numbers at times of stress.
Currently, there are no direct estimates of bacterial populations responsible for methane oxidation on Broadbalk. However,
measurements of this process, indicate lower
activity of methane-oxidizing bacteria in the soils receiving N fertilisers with much higher
emissions in the Broadbalk Wilderness,
indicating that soil cultivation or amount of biomass may have major disruptive effects on these microbial populations. Fertiliser
treatments also impacts on microbial
populations involved in N-cycling and hence the utilisation of N by crops or it’s loss to the environment. The population of ammonia oxidizing bacteria has been estimated from the amount of DNA specific to this group in
the soil. It is around 104 g-1 in unfertilised soil with 10- to 50-fold more in the soils receiving
N fertilisers. The potential for nitrification activity is likewise higher in the N fertilised soils. After application of ammonium nitrate fertiliser, populations of ammonia oxidizing bacteria increase 10- to 100-fold after six
weeks, then slowly decline over the rest of the year. Another major group of ammonia
oxidizers belong to the domain archaea (AOA). Their abundance in soil constitutes ~1% of
total DNA, considerably higher than ammonia
oxidizing bacteria. Their role in nitrification in agricultural systems is however still unclear.
Results from Zhalnina et al., 2013 indicated that long term agricultural management
significantly increased AOA abundance when
compared to the wilderness and grassland
on Broadbalk. Abundance of the different bacterial genes involved in denitrification
varied depending on the treatment. Measurement of bacterial genes involved
in denitrification in Broadbalk soil indicated
that, in general, the genes responsible increased in abundance with increasing
N fertiliser, consistent with the increased
amounts of N. However, the woodland soil,
which does not receive fertiliser N, had much higher emissions when fertiliser was applied in laboratory studies. It also had a relatively lower abundance of the denitrification genes indicating that the woodland soil harbours a distinctly different microbiome compared to
the plots remaining under arable management (Clark et al., 2012). A survey of soil sampled monthly over the growing season from plots
with a range of N fertiliser inputs, as well as the grassland and woodland sections of the Broadbalk Wilderness, confirmed the difference
in community structure (Zhalnina et al., 2013).
Weeds on Broadbalk
Weeds were controlled on Broadbalk by
hand-hoeing until shortly after the First World
War when a shortage of labour resulted in
increasing yield losses from weed competition.
In response, the experiment was sub-divided
into five sections in 1926 (Plan 1) that were sequentially fallowed to help control weeds.
Herbicides have been used on all plots since
1964 except for half of section IV (new Section
8). No other form of weed control is used on
this Section except for occasional fallowing
when the weeds become too much of an
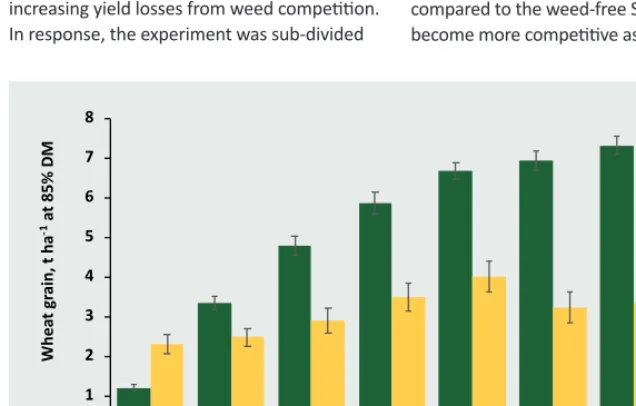
impediment to harvesting the wheat crop. By comparing the yields from Section 8 with equivalent plots on Section 9, that have the same fertiliser treatments but are kept free of weeds, the effect of the fertilisers on potential yield loss from weeds can be estimated. On plots that do not receive any N fertiliser,
leguminous weeds, such as black medick (Medicago lupulina), that can fix N from the
atmosphere, are very abundant. Some of this
fixed N becomes available to the crop, resulting
in increased grain yields on the weedy plots
compared to the weed-free Section. The weeds become more competitive as the rate of N
Fig. 5 Broadbalk; mean yields of grain, 1985-2014; where wheat was grown continuously or with occasional fallows, without herbicides (section 8; yellow histograms) or with herbicides (section 9; green histograms).
0 1 2 3 4 5 6 7 8
0 48 96 144 192 240 288
Wh
ea
t gr
ai
n, t
h
a
-1at
85%
D
M
fertiliser increases and the percentage yield
losses increase (Figure 5). Consequently, the
yield benefits of increasing fertiliser application observed on Section 9 are not realised in
the presence of weeds, emphasising the importance of good weed control to protect
potential yield in modern cropping systems. The largest yield loss (92%) was recorded
on Plot 17 (N1+4+1 PKMg) in 2006 following
a five-year period without a fallow. The differences in the yield losses between the fertiliser treatments are largely a result of changes in the weed communities on the different plots, with competitive weed species becoming more abundant as fertiliser application rates increase. The relative frequencies of different weed species have been recorded annually on all plots in Section 8 since 1991; over this period, 55 weed species
have been recorded. Because winter wheat is
grown in Section 8, the weed flora is largely made up of species adapted to germination in the autumn. There are striking differences in the weed floras between the fertiliser treatments largely resulting from differences in
amounts of added N. Plot 3, which has never
received any fertilisers, is the most diverse plot
(with up to 19 species recorded each year), and species richness declines as the rate of N
fertiliser increases; as few as seven species have
been recorded in a given year on Plot 16, which receives most N (288 kg N ha-1). The decline in species richness is explained by the loss of
species such as corn buttercup (Ranunculus arvensis) on plots with high N application rates.
These species have tended to also decline
nationally, in contrast to nitrophilous species
like chickweed (Stellaria media) which have remained common.
Broadbalk now provides an invaluable reserve for seven plant species that are rare,
uncommon or declining nationally. These are: corn buttercup (Ranunculus arvensis), corn
cleavers (Galium tricornutum), fine-leaved
sandwort (Minuartia hybrida), narrow-fruited cornsalad (Valerianella dentata), prickly poppy (Papaver argemone) and shepherd’s needle (Scandix pecten-veneris). Corn cleavers
deserves a special mention as it is one of
Britain’s rarest plants and Broadbalk is the only site where this species has been recorded in recent years. Between 1991 and 2002 no more than four plants were seen in any one year but
Rothamsted’s weed conservation policy has
meant that Broadbalk now supports a healthy
population of this species.
The revised atlas of British and Irish Flora
includes a list of species which have shown
the greatest relative decrease nationally between the 1930-69 and 1987-99 national
recording periods. Seven weeds on Broadbalk are among the 50 species that have shown the greatest decline, and three of them are in the
top 10 species in the list (corn buttercup, corn
cleavers and shepherd’s needle).
Pests and diseases on Broadbalk
The continuity of cropping and manurial
treatments has made Broadbalk a valuable
experiment for studying the effects of both plant nutrition and weather on the incidence
of wheat pests and diseases.
Before insecticidal seed dressings were used, wheat bulb fly (Delia coarctata ) often caused severe damage to wheat after fallow. Bulb fly
eggs are laid during the summer on bare soil, and damage is caused by larvae burrowing into the young wheat shoots in the early
spring. Yield losses on Broadbalk differed
greatly with season and were related to the
ratio of number of plants to number of larvae, to the time of attack and to the suitability of conditions for plant growth. Plants on soils deficient in K usually suffered most because they were less well tillered, and damage to the primary shoot often killed the whole
plant. The damage was minimised by sowing wheat earlier. However, this has resulted in
occasional problems with gout fly (Chlorops pumilionis). Other insect pests (cereal aphids, cutworms, wheat-blossom midges and the saddle-gall midge) have caused damage only sporadically.
Foliar diseases such as yellow rust (Puccinia striiformis), brown rust (Puccinia triticina), septoria leaf blotch (Zymoseptoria tritici) and powdery mildew (Blumeria graminis)
are common on the no fungicide Section of Broadbalk (Section 6), and differ between years depending on the resistance profile of the wheat cultivar being grown and the weather conditions. The winter wheat cultivar grown on Broadbalk since 2013, cv. Crusoe, has good resistance against yellow rust, powdery mildew and septoria, but
is susceptible to brown rust. Brown rust
symptoms are commonly seen towards
the end of grain filling and when weather
conditions are favourable this can reach epidemic proportions. In some years, this can result in yield losses in the no fungicide section of 18-56% compared to the fungicide-treated
areas of the experiment.
Both eyespot (Oculimacula spp) and take-all root disease (Gaeumannomyces graminis
var tritici) are common on Broadbalk.
Comparisons of yields and of differences in amounts of take-all between continuous wheat on Broadbalk and that in other fields,
growing shorter sequences of cereals, lead to
the development of the hypothesis of
‘take-all decline’. This natural form of biocontrol, where take-all disease becomes less severe
in continuously grown wheat compared to
its severity in shorter sequences of wheat, is thought to be due to the build-up of
antagonistic microflora in the soil. Take-all
disease has been regularly assessed in selected
plots since the introduction of rotations on
Broadbalk in 1968. This very valuable long term dataset is currently being used to explore
the impact of climatic and agronomic factors
on take-all disease severity with the aim of
improving our understanding and forecasting
of disease outbreaks.
Broadbalk, brown rust on fungicide treated
Broadbalk drains
In 1849, a tile drain was laid down the centre of each treatment strip. The tiles, of the ‘horseshoe and sole’ type, 5 cm internal
diameter, were laid 60 cm below the surface, and led to a 10 cm cross main, which took the water to waste. The drains were not intended for experimental use, but in 1866 they were opened, and drainage water collected and
analysed; the forerunner of the ditch we see
today was built in 1896. Although ammonium (NH4), K, Mg and Na salts were all added to the soil, the biggest losses were of calcium (Ca) and these increased with increasing amounts of NH4 salts applied. This observation confirmed
the theory of ion exchange developed by Thomas Way. Losses of nitrate (NO3) were also considerable, and also increased with the amount of NH4 salts added. The original drains
were still running in the 1990s and were used
to make measurements of NO3-N and P losses. However, because the experiment had been
divided into Sections, and because some drains ran intermittently it was no longer possible to
know where the drainage water was coming
from. The drains on Section 9 (nearest the
drainage ditch) were, therefore, replaced in
autumn 1993. The old drains, draining Sections
0-8, were intercepted and taken to waste.
The ends of the old drains on Section 9 were
plugged with clay and new perforated 8 cm
plastic pipes installed 50 cm to one side of
the old drain at 75 cm depth.
Measurements of N leached to groundwater plus losses via the drains indicated that even
where no N fertiliser had been applied for
more than 150 years on average about 10 kg ha-1 of NO
3-N was lost each year (1990-1998). Most N was lost where the amount of
fertiliser N applied exceeded that needed for “optimum” yield or where FYM was applied
for many years. The EU limit for the maximum
concentration of N allowed in potable waters
(11.3 mg N l-1) was often exceeded where the
larger amounts of fertiliser N or FYM were
applied. However, in years when through drainage was less than average, the EU limit
was sometimes exceeded even where little or
no N had been applied (Goulding et al., 2000). Losses of P from agricultural land to water
courses can result in eutrophication. Because many soils have the capacity to retain P, vertical movement of P through the soil profile is generally considered to be of little importance.
On Broadbalk, the soil now contains between 5 and 120 mg kg-1 of available-P (Olsen P) depending on the treatment. As noted
earlier, fertiliser P is being withheld on some treatments (see Broadbalk plan) until concentrations of Olsen P decline to a more
sensible agronomic level. Measurements of
P (mainly dissolved reactive P) in drainage showed that the critical level, above which the P concentration in the drainage water
increased rapidly, was c. 60 mg kg-1 Olsen P on this soil type (Heckrath et al., 1995).
Broadbalk Wilderness, July 2017 Geescroft Wilderness, 1933
Although not experiments in the usual sense,
these two areas of regenerating woodland
are of great value, especially now, when the
sequestration of carbon in soils and vegetation
is much debated. Both sites had grown arable crops for many years. On Broadbalk, the surface soil had been heavily chalked and
is still calcareous; Geescroft had not been
heavily chalked and topsoil pH fell from 7.1 in 1883 to 4.4 in 1999.
In 1882, at the west end of Broadbalk
field about 0.2 ha of the wheat crop on land unmanured for many years was left
unharvested and the land was no longer
cultivated. The wheat did not compete well with the weeds, and after only four years the
few self-sown wheat plants that could be found were stunted and barely recognisable
as cultivated wheat. One half of the area has remained untouched; it is now woodland dominated by ash, sycamore and hawthorn; the
ground is covered with ivy in the densest shade, and with dog’s mercury and other species present where shade is less dense. On the other half, woody species have been removed (stubbed) annually since about 1900 to allow
open-ground vegetation to develop. This
consists mainly of coarse grasses, hogweed,
agrimony, willow-herb, nettles, knapweed
and cow parsley, with smaller numbers of many other species.
In 1957 the stubbed section was divided into two parts; one part continues to be stubbed
each year. On the other part, the herbage
was mown several times during each of the
next three years and the produce removed
to encourage grasses as a preparation for grazing. Although the hogweed and cow
parsley gave place to ground ivy, the grasses
did not increase substantially until the site was grazed by sheep. By 1962, perennial ryegrass
and white clover had appeared, and they are now widely distributed. The ground ivy has almost gone, and the growth of other species
is much restricted. The appearance of nettles
in this area in 1986 has necessitated occasional
applications of herbicides. Since 2001, this
area has been mown.
The Geescroft Wilderness covers 1.3 ha. It is
sited on part of what had been an experiment
that grew beans from 1847 to 1878. After
subsequent years in fallow and clover the experimental site was abandoned in 1886 and
trees, dominated by oak and ash. An under-story of holly has become increasingly dense since the 1960s. Because the soil has become so acid, there are few ground cover species. On both sites, much C has been sequestered
in trees and soil since cultivation ceased in
the 1880s (Poulton et al., 2003). By the end of the 20th Century, Geescroft had gained, on average, 2.00 t C ha-1 yr-1 (0.38 t in litter and soil
to a depth of 69cm, plus an estimated 1.62 t in trees, including their roots); corresponding
gains of N were 22.2 kg N ha-1 yr-1 (15.2 kg in soil, plus 6.9 kg in trees). Broadbalk has gained 3.39 t C ha-1 yr-1 (0.54 t in soil, plus an estimated 2.85 t in trees), 49.6 kg N ha-1 yr-1 (36.8 kg in soil, plus 12.8 kg in trees). Much of the N required for plant growth will have come from
inputs in rain and dry deposition. The faster accumulation of C and N in the wooded part of Broadbalk compared to Geescroft is probably because, as it is relatively narrow, there is a large edge effect and greater light interception
per unit area, perhaps more scavenging of atmospheric N, and thus more growth.
However, additional atmospheric N could have
come from nearby covered yards in which bullocks were housed during the winter.
Park Grass is the oldest experiment on permanent grassland in the world. Started by Lawes and Gilbert in 1856, its original purpose
was to investigate ways of improving the yield of hay by the application of inorganic fertilisers
or organic manures (Plan 2 and Table 3). Within 2-3 years it became clear that these
treatments were having a dramatic effect on the species composition of what had
been a uniform sward comprising about 50
species. The continuing effects on species diversity and on soil function of the original
treatments, together with later tests of liming
and interactions with atmospheric inputs
and climate change, has meant that Park Grass has become increasingly important to
ecologists, environmentalists and soil scientists
(Silvertown et al., 2006). It is a key Rothamsted site within the UK Environmental Change Network (see later).
The experiment was established on c. 2.8 ha of parkland that had been in permanent pasture for at least 100 years. The uniformity of the site
was assessed in the five years prior to 1856.
Treatments imposed in 1856 and subsequently
included controls (Nil - no fertiliser or manure), Park Grass, 1941
and various combinations of P, K, Mg, Na,
with N applied as either sodium nitrate or ammonium salts (Table 3). FYM was applied
to two plots but was discontinued after eight
years because, when applied annually to the
surface in large amounts, it had adverse effects
on the sward. FYM, applied every four years, was re-introduced on three plots in 1905. The plots are cut in mid-June and made into
hay. For 19 years the re-growth was grazed by
sheep penned on individual plots but since 1875 a second cut, usually carted green, has been taken. The plots were originally cut by scythe, then by horse-drawn and then tractor-drawn mowers. Yields were originally
estimated by weighing the produce, either of
hay (1st harvest) or green crop (2nd harvest),
and dry matter determined from the whole plot. Since 1960, yields of dry matter have been estimated from strips cut with a forage harvester. However, for the first cut the remainder of the plot is still mown and made into hay, thus continuing earlier management
and ensuring return of seed. For the second cut the whole plot is cut with a forage harvester. Park Grass probably never received the large
applications of chalk that were often applied to arable fields in this part of England. The
soil (0-23cm) on Park Grass probably had a pH
(in water) of about 5.5 when the experiment began. A small amount of chalk was applied to all plots during tests in the 1880s and 1890s. A regular test of liming was started in 1903 when most plots were divided in two and 4 t ha-1 CaCO
3 applied every four years to one half. However, on those plots receiving the largest amounts of ammonium sulphate this was not enough to stop the soil becoming progressively
more acid, making it difficult to disentangle the effects of N from those of acidity. It was decided
to extend the pH range on each treatment and, in 1965, most plots were divided into four: sub-plots “a” and “b” on the previously limed halves and sub-plots “c” and “d” on the previously unlimed halves. Sub-plots “a”, “b”
and “c” now receive different amounts of chalk,
when necessary, to achieve and/or maintain
soil (0-23cm) at pH 7, 6 and 5, respectively. Sub-plot “d” receives no lime and its pH reflects
inputs from the various treatments and the atmosphere. Soils on the unlimed sub-plots of the Nil treatments are now at c. pH 5.0 whilst soils receiving 96 kg N ha-1 as ammonium sulphate or sodium nitrate are at pH 3.4 and
5.9, respectively. For the latter two treatments,
between 1965 and 2015, 74 and 22 t ha-1 CaCO3, respectively, were required to increase
13/2
13/1
12
11/2
11/1
10
9/2
9/1
8
7/2
6
5
4/2
4/1
3 2/2 2/1
14/2 14/1 1
15
16
17
FYM/PM
(FYM/Fishmeal)
Nil
a b c d
N3 P K Na Mg
N2 P Na Mg
N2 P K Na Mg (N2) PK Na Mg
P Na Mg
P K Na Mg
7/1
(P) K Na Mg
N1 PK Na Mg
N2P
P
Nil Nil
18d
18c
18/2
18b
18a
19/1
19/2
19/3
20/1
20/2
20/3
N
FYM
FYM N*PK N2K
Na Mg
N3 P K Na Mg Si
These areas used for microplot experiments
K since 1996 N1
N*1 PK Na Mg
N*1 N*2 PK Na Mg (N*2) PK Na Mg
N*3 PK Na Mg
Table 3 Park Grass fertiliser and organic manure treatments.
Treatments (per hectare per year unless indicated)
Nitrogen (applied in spring)
N1, N2, N3 48, 96, 144 kg N as ammonium sulphate N*1, N*2, N*3 48, 96, 144 kg N as sodium nitrate (N2) (N*2) last applied 1989
Minerals (applied in winter)
P 17 kg P as triple superphosphate since 2017, previously 35 kg P K 225 kg K as potassium sulphate
Na 15 kg Na as sodium sulphate Mg 10 kg Mg as magnesium sulphate Si 450 kg of sodium silicate
Plot 20 30 kg N*, 15 kg P, 45 kg K in years when FYM is not applied
In 2013, plot 7 was divided into 7/1 and 7/2; P applications on 7/1 stopped Since 2013, plot 15 has also received N*3 (previously PKNaMg but no N)
Organics (applied every fourth year)
FYM 35 t ha-1 farmyard manure supplying c.240 kg N, 45 kg P, 350 kg K, 25 kg Na, 25 kg Mg, 40 kg S, 135 kg Ca PM Pelleted poultry manure (replaced fishmeal in 2003) supplying c.65 kgN
On plot 13/2 FYM and PM (previously fishmeal) are applied in a 4-year cycle i.e.:
FYM in 2017, 2013, 2009, 2005 etc.
PM in 2015, 2011, 2007, 2003, fishmeal in 1999, 1995 1991 etc.
(FYM/Fishmeal) FYM and fishmeal last applied in 1993 and 1995 respectively
Lime (applied every third year)
Ground chalk applied as necessary to maintain soil (0-23 cm) at pH 7, 6 and 5 on sub-plots “a”, “b” and “c”.
Sub-plot “d” does not receive any chalk
In 1990, plots 9 and 14, which received PKNaMg and N as either ammonium sulphate or sodium
nitrate respectively, were divided so that the effects of withholding N from one half of all
the sub-plots could be assessed. Similarly, plot
13, which received FYM and fishmeal (now
poultry manure), was divided, and, since 1997,
FYM and fishmeal has been withheld from one
half. In 1996, plot 2, a long-term Nil treatment, was divided and K has been applied to one half each year to give a “K only” treatment. In 2013, plot 7 was divided in two to test the
effects of withholding P on herbage production and botanical diversity. The effects have been
negligible so far, almost certainly because of the large amounts of available P that had built up in
the soils from past inputs; in 2014 available P on plots receiving P fertiliser was 60-290 mg
plant-available (Olsen)P kg-1. Consequently, in 2016,
the P application to these plots was decreased
from 35 to 17 kg P ha-1, so that it more closely
matches P offtakes. Since 2013, plot 15 has
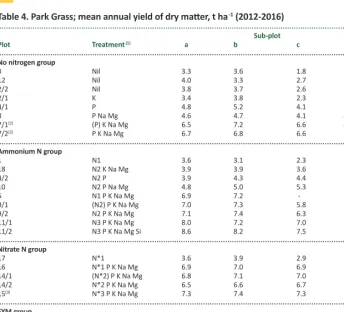
Table 4. Park Grass; mean annual yield of dry matter, t ha-1 (2012-2016)
Sub-plot
Plot Treatment(1) a b c d
No nitrogen group
3 Nil 3.3 3.6 1.8 2.7
12 Nil 4.0 3.3 2.7 2.6
2/2 Nil 3.8 3.7 2.6 2.9
2/1 K 3.4 3.8 2.3 2.0
4/1 P 4.8 5.2 4.1 3.9
8 P Na Mg 4.6 4.7 4.1 4.3
7/1(2) (P) K Na Mg 6.5 7.2 6.6 4.4
7/2(2) P K Na Mg 6.7 6.8 6.6 5.0 Ammonium N group
1 N1 3.6 3.1 2.3 1.7
18 N2 K Na Mg 3.9 3.9 3.6 2.4
4/2 N2 P 3.9 4.3 4.4 2.8
10 N2 P Na Mg 4.8 5.0 5.3 3.6 6 N1 P K Na Mg 6.9 7.2 - -9/1 (N2) P K Na Mg 7.0 7.3 5.8 1.7 9/2 N2 P K Na Mg 7.1 7.4 6.3 5.1 11/1 N3 P K Na Mg 8.0 7.2 7.0 6.0 11/2 N3 P K Na Mg Si 8.6 8.2 7.5 7.0
Nitrate N group
17 N*1 3.6 3.9 2.9 3.3
16 N*1 P K Na Mg 6.9 7.0 6.9 5.6 14/1 (N*2) P K Na Mg 6.8 7.1 7.0 6.9 14/2 N*2 P K Na Mg 6.5 6.6 6.7 6.7 15(3) N*3 P K Na Mg 7.3 7.4 7.3 7.1 FYM group
13/1 (FYM/fishmeal) 5.6 5.6 4.9 4.5
13/2 FYM/PM 5.8 6.9 6.9 6.4
/1 /2 /3
19(4) FYM 6.9 7.2 6.3
20(4) FYM/N* P K 7.1 7.3 6.8
(1) See Table 3 for details
(2) Plot 7 split in 2013 and P withheld from 7/1; yields given for 7/1 are for 2013-16 (3) N*3 applied since 2013 (yields given are for 2013-16)
(4) Plots 19 and 20 are not part of the liming scheme addition to PKNaMg, to provide a comparison
with plot 11, which receives the same rate of N as ammonium sulphate.
Yields of total dry matter (both harvests) for
2012-16 are shown in Table 4. The largest yields were on limed sub-plots given PKNaMg and 144 kg N ha-1 (11/1 and 11/2). Yields with 96 kg N ha-1 as either ammonium or nitrate (and
PKNaMg) are similar (9/2 and 14/2); where P
or K are not applied yields are less (18, 4/2 and 10). Similarly, yields on plots given N only
(1 and 17) are no better than on the Nil plots
(3, 12 and 2/2) because lack of P and K limits yield. On soil receiving PKNaMg but no N
fertiliser (7/2), yields are as good as those on
plots receiving PKNaMg plus 96 kg N ha-1 (plots
9/2 and 14/2) because of the large proportion of
are smaller. For all treatments, yields on unlimed sub-plots are less than those on soils maintained at pH 6 or above. However, even on the very
acid soils (pH 3.4 – 3.7) dominated by one or two species, mean yields can still be as large as
6-7 t ha-1 (e.g. “d” sub-plots of 11/1 and 11/2).
Botanical composition
Vegetation surveys have been carried out
on Park Grass on more than 30 occasions since the experiment began. The most recent, comprehensive surveys of botanical
composition, made just before the first cut,
were done annually from 1991 to 2000 and from 2010 to 2012. Table 5 shows soil pH
and those species comprising 5% or more
of the above ground biomass, and the total
number of species identified on each
sub-plot (selected treatments, mean 2010-2012). The striking contrasts between the plots,
in botanical diversity and composition, are a result of complex interactions between fertiliser and manure treatments and pH. Without exception, all the original treatments
imposed at the start of the experiment resulted
in a decline in species number; the fertilisers have acted on the community by selecting
out species that are poorly adapted to those
treatments. When the effect of increasing soil fertility is analysed separately from the effect
of pH, the steepest declines in species richness have been observed on plots that receive
both inorganic N and P in combination. The most diverse flora, including many
broad-leaved species, is on the Nil plots (plots 3, 2/2 and 12), with about 35-42 species in total. These swards are probably the nearest
approximations to the species composition of the whole field in 1856, although gradual
impoverishment of the plant nutrients soon caused decreases in perennial ryegrass (Lolium perenne) and Yorkshire fog (Holcus lanatus) and later increases in common bent (Agrostis
capillaris), red fescue (Festuca rubra), rough hawkbit (Leontodon hispidus) and common knapweed (Centaurea nigra). Species
characteristic of poor land e.g. quaking grass (Briza media) and cowslip (Primula veris) are also present in small amounts, on these plots. Lime alone does not greatly alter the absence/ presence of individual species but it decreases
the contribution of common bent and red
fescue, and increases that of some broad-leaved species.
Applying N as ammonium sulphate or as sodium nitrate has resulted in the most spectacular contrasts. In the absence of applied chalk, soil pH on the “d” sub-plots ranges from 4.1 to 3.6 where ammonium sulphate has been applied and from 5.4 to 6.0 with
sodium nitrate. The effect of soil acidification
on the total number of species in the sward
is dramatic; 1-4 species with ammonium
sulphate, but 22-35 with sodium nitrate (Table 5). Grasses are dominant on the “d” sub-plots, where the soil pH ranges from 4.0 to 3.6. Species that dominate on these plots, such as sweet vernal grass (Anthoxanthum odoratum), are restricted to those able to tolerate the
increased concentration of aluminium ions
in the soil associated with low pH. Figure 6
summarises, for three contrasting treatments,
Sorting herbage samples from Park Grass,
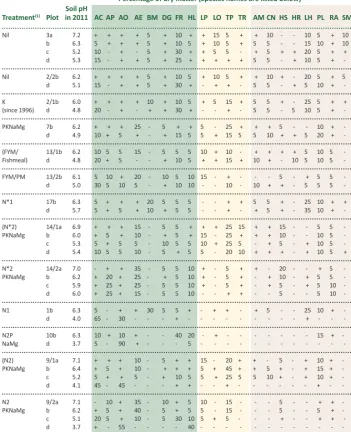
Table 5. Park Grass; species comprising at least 5% of herbage, mean 2010-2012;
and total number of species observed
Percentage of dry matter (Species names are listed below)
No. of
Soil pH species
Treatment(1) Plot in 2011 AC AP AO AE BM DG FR HL LP LO TP TR AM CN HS HR LH PL RA SM observed
Nil 3a 7.2 + + + + 5 + 10 + + 15 5 + + 10 - - 10 5 + 10 37
b 6.3 5 + + + 5 + 10 5 + 10 5 + 5 5 - - 15 10 + 10 35
c 5.2 10 - + - 5 + 30 + + 5 5 - + 5 + + 20 5 + + 37
d 5.3 15 - + + 5 + 25 + + + + + 5 5 - + 10 5 + - 35
Nil 2/2b 6.2 + + + + 5 + 10 5 + 10 5 + + 10 + - 20 5 + 5 42
d 5.1 15 - + + 5 + 30 + - + + - 5 5 - + 5 10 + - 35
K 2/1b 6.0 + + + + 10 + 10 5 + 5 15 + 5 5 + - 25 5 + + 39
(since 1996) d 4.8 20 - + - + + 30 + - - + - 5 5 - 5 10 5 + - 28
PKNaMg 7b 6.2 + + + 25 - 5 + + 5 - 25 + + + 5 - - 10 + - 29
d 4.9 10 + 5 + - + 15 5 5 + 15 5 5 10 + + 5 20 + - 33
(FYM/ 13/1b 6.2 10 5 5 15 - 5 5 5 10 + 10 - + + + + 5 10 5 - 33
Fishmeal) d 4.8 20 + 5 - - + 10 5 + + 15 + 10 + - 10 5 10 5 - 33
FYM/PM 13/2b 6.1 5 10 + 20 - 10 5 10 15 - + - - - 5 - + 5 5 - 33
d 5.0 30 5 10 5 - + 10 10 - - 10 - 10 + + - 5 5 5 - 30
N*1 17b 6.3 5 + + + 20 5 5 5 - - + + 5 5 + - 25 10 + + 36
d 5.7 5 + 5 + 10 + 5 5 - - + - + 5 + - 35 10 + - 35
(N*2) 14/1a 6.9 + + + 15 - 5 5 + + + 25 15 + + 15 - - 5 5 - 29
PKNaMg b 6.0 + 5 + 10 - + 5 + 15 - 25 + + + 10 - - 10 5 - 29
c 5.3 5 + 5 5 - 10 5 5 10 + 25 5 - + 5 - + 10 5 - 31
d 5.4 10 5 5 10 - 5 + 5 5 - 20 10 + + + - + 10 5 + 26
N*2 14/2a 7.0 - + + 35 - 5 5 10 + - 5 + + - 20 - - + 5 - 25
PKNaMg b 6.2 + 20 + 25 - + 5 10 + - 5 + - + 10 - + 5 5 - 28
c 5.9 + 25 + 25 - 5 5 10 + - 5 + - + 5 - + 5 10 - 25
d 6.0 + 25 + 15 - 5 5 10 - - + + - - 5 - - 5 10 - 22
N1 1b 6.3 5 - + + 30 5 5 + - + + - + 5 - - 25 10 + - 28
d 4.0 65 - 30 - - - + - - - - - - + - - - 5
N2P 10b 6.3 10 + 10 + - - 40 20 - + - - - - 15 + - 18
NaMg d 3.7 5 - 90 + - - - 5 - - - - 4
(N2) 9/1a 7.1 + + + 10 - 5 + + 15 - 20 + + - 5 - + 10 + - 30
PKNaMg b 6.4 + 5 + 10 - + + + 5 + 45 + + 5 + - + 15 + - 34
c 5.2 5 + + 5 - + 10 5 5 + 25 5 5 10 + - + 10 + - 31
d 4.1 45 - 45 - - - + + - - + - - - + - - 11
N2 9/2a 7.1 - 10 + 35 - 10 + 5 10 - 15 - - - 5 - - + + - 23
PKNaMg b 6.2 + 5 + 40 - 5 + 5 5 - 15 - - - 5 - - 5 + - 24
c 5.1 20 5 + 10 - 5 30 10 5 + 5 - - - + - - + + - 28
d 3.7 + - 55 - - - - 40 - - - - - - - 3
N3 11/1b 6.4 - 20 + 30 - 20 + 10 - - + - - - 5 - - + + - 17
PKNaMg d 3.6 - - - - - - - 100 - - - - - 1
N3 11/2b 6.1 - 20 + 45 - 15 - 5 - - + - - + 5 - - + + - 17
PKNaMgSi d 3.6 5 - + + - - - 95 - - - 4
(1) See Table 3 for treatment details.
Data are from surveys immediately before hay harvest; mean 2010-2012 rounded to the nearest 5% of dry matter (selected plots only). Note; +, species present at less than 5%; -, species not present on that plot.
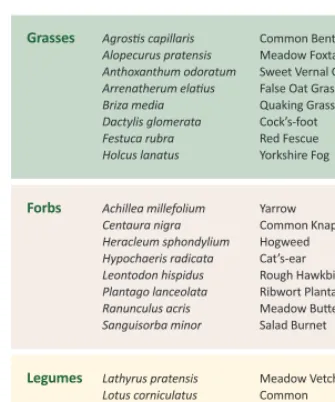
Grasses Agrostis capillaris Common Bent
Alopecurus pratensis Meadow Foxtail
Anthoxanthum odoratum Sweet Vernal Grass
Arrenatherum elatius False Oat Grass
Briza media Quaking Grass
Dactylis glomerata Cock’s-foot
Festuca rubra Red Fescue
Holcus lanatus Yorkshire Fog
Forbs Achillea millefolium Yarrow
Centaura nigra Common Knapweed
Heracleum sphondylium Hogweed
Hypochaeris radicata Cat’s-ear
Leontodon hispidus Rough Hawkbit
Plantago lanceolata Ribwort Plantain
Ranunculus acris Meadow Buttercup
Sanguisorba minor Salad Burnet
Legumes Lathyrus pratensis Meadow Vetchling
Lotus corniculatus Common
Bird’s-foot-trefoil
Trifolium pratense Red Clover
Trifolium repens White Clover
effects over time on the numbers of species comprising 1%, or more, of the above-ground
biomass. Even on the Nil plots, the number of species has decreased since the start of the experiment, possibly as a consequence of atmospheric inputs and/or changes in the management of the sward. Applying either form of N decreased species number further in th