Original Article
Evaluation of hepatic fibrosis
by using stretched-exponential and
mono-exponential diffusion-weighted MR imaging
Fangfang Fu1, Dapeng Shi1, Shaocheng Zhu1, Meiyun Wang1, Cuiyun Chen1, Dujuan Li2, Jing Li1, Shewei Dou1
Departments of 1Radiology, 2Pathology, The People’s Hospital of Zhengzhou University & Henan Provincial People’s Hospital, Zhengzhou 450003, Henan, China
Received June 3, 2016; Accepted August 8, 2016; Epub November 15, 2016; Published November 30, 2016
Abstract: Aim: To obtain the parameters from stretched-exponential and mono-exponential models of multiple b-value diffusion weighted imaging (DWI) and to compare the b-value of these parameters in detecting and staging
he-patic fibrosis (HF). Methods: The apparent diffusion coefficient (ADCst), distributed diffusion coefficient (DDC) and intravoxel water diffusion heterogeneity (α) for the study and control groups were calculated and compared. T-test, Receiver Operating Characteristic (ROC) analysis and Pearson’s correlation coefficient were used for statistical analysis. Results: All the parameters in the study group were significantly different from the corresponding param
-eters in the control group (P<0.05). The DDC showed a strong negative correlation with the HF stages (r = -0.786, P<0.001). The ADCst showed a moderate negative correlation with the HF stages (r = -0.579, P<0.001). However, α showed no correlation with the HF stages (P>0.05). The α also showed no obvious differences when comparing fibrosis at different stages. Using ROC analysis, DDC showed greater capability than ADCst in discriminating fibrosis stage 1 or greater (≥F1), stage 2 or greater (≥F2), and stage 3 or greater (≥F3), the areas of under curve (AUCS) of
DDC and ADCst were 0.948, 0.903, 0.879, 0.912, 0.850 and 0.741, respectively. There was a moderate positive
correlation between ADCst and DDC (r = 0.596, P<0.001). Conclusions: DDC and ADCst showed a significant cor
-relation with the stages of HF. The DDC had higher predictive ability than ADCst in distinguishing the stages of HF.
Keywords: Hepatic fibrosis, diffusion weighted imaging, mono-exponential diffusion, stretched-exponential diffu -sion
Introduction
Chronic liver diseases could cause hepatic
fibrosis (HF) [1, 2]. The progression of HF might
eventually cause hepatic cirrhosis,
hepatocel-lular carcinoma, and even hepatic failure [3-5]. Early diagnosis and classification of HF is criti -cal, because it could help determine early treat-ments, prevent its progression to hepatic
cir-rhosis, and reduce healthcare costs [1, 6, 7]. In the clinic, it is difficult to diagnose and stage HF
because patients with chronic liver diseases usually have no symptoms or only show slight abdominal distension. To date, the result of liver biopsy is considered to be the reference
standard for the final diagnosis and staging of HF [8, 9]. However, a liver biopsy has several
recognized drawbacks: certain invasiveness,
high cost, sampling error, observation
varia-tions, poor repeatability, and so on [5, 9-11].
Therefore, it is not a suitable method to dynami-cally monitor and screen all patients with chron-ic liver diseases.
Magnetic resonance imaging (MRI), a noninva-sive and promising technique for the evaluation
of HF, has been increasingly adopted. Multiple
b-value DWI as a non-contrast method has
become a burning field of research in the
ass-essment and staging of liver disease. In
previ-ously published reports [1, 8, 12] on HF, mono-
and bi-exponential models of intravoxel
inco-herent motion (IVIM) have been proposed in HF.
and offered a possible unique insight into
hepatic disease [13]. However, the bi-exponen -tial model may oversimplify the movement of tissue water molecules in reality, and it is pos-sibly more realistic to present a larger number
(>2) of intravoxel proton pools using a continu
-ous distribution of diffusion coefficients [14].
To present an alternative method to the bi-exponential model, Bennett et al. [14, 15] first
introduced the stretched-exponential model, also referred to as the Kohlrausch decay func-tion. The stretched-exponential model was used to present the IVIM diffusion signal and monitor the deviation from the mono-exponen-tial model caused by pseudo-perfusion effects.
The model perhaps overcame the difficulty of
making a hypothesis about the amount of intra-voxel proton pools utilizing distributed diffusion
coefficients (DDC) in biological tissue. In a pre -vious study, a stretched-exponential model was utilized to characterize the degree of intravoxel
heterogeneity influencing diffusion-related MRI
signal attenuation and has shown potential use
for brain tumors [14, 16]. This paper will assess
and compare the stretched-exponential model with the mono-exponential model in diagnosing
and staging HF in patients, few articles have reported on this topic [17].
The purpose of this study was to calculate the
parameters (DDC, α) of the stretched-exponen -tial model using multi-b value DWI and evaluate whether these parameters could detect and
stage HF in patients with chronic liver diseases
with a better diagnostic performance than the parameter (ADCst) of mono-exponential model.
Methods
Study population
The prospective study was approved by the institutional review board at the People’s
Hospital of Zhengzhou University, and informed
consent was obtained from all participants for the respective assessment of their clinical data and images. Among them, 30 patients who had chronic liver diseases were recruited consecu-tively for this study between October 2012 and June 2013. All of them had undergone conven-tional MRI and multiple b-value DWI. Of these 30 patients, 5 were excluded from the study because of no liver biopsy or poor images. After
these exclusions, 25 patients (22 males and 3 females; mean age: 43.7±1.2 years, age range: 25-73 years) included in our study were
verified by liver biopsy. Among the 25 patients,
15 were with hepatitis B, 1 with hepatitis C, 1 with alcoholic hepatitis, 2 with nonalcoholic fatty liver disease, 2 with drug induced hepati-tis, 1 with Budd-Chiari syndrome, and 3 with autoimmune hepatitis. The time interval between undergoing the MRI and liver biopsy was one month. Of these 25 patients, 9 had abdominal distension and 16 were asymptom-atic. At the same time, 25 control subjects (15 males and 10 females, mean age: 38.9±1.3 years, age range: 25-57 years) who had no his-tory of liver disease, alcohol abuse, hepatic malignancy, or liver dysfunction were included. All the control subjects without ultrasound-guided liver biopsy had undergone convention-al MRI and multiple b-vconvention-alue DWI.
Magnetic resonance examination
All MRI was performed on a 3.0 T scanner (Dis- covery MR750, GE Medical System, Milwaukee, Wis.) with an 8-channel body phased-array coil (GE Medical Systems). All participants under-went a routine liver MRI, which consisted of an axial T1-weighted spin echo sequence (repeti-tion time (msec)/echo time (msec), 180/2.1), an axial T2-weighted spin echo sequence (rep-etition time (msec)/echo time (msec), 4286/ 88.1), and a coronal T2-weighted spin echo sequence (repetition time (msec)/echo time (msec), 8571/88.8). Multiple b-value DW-MRI was performed by using a respiratory-triggered single-shot spin-echo planar sequence, parallel imaging technique (parallel imaging reduction factor of 2), and monopolar gradient in the axial plane. The multiple b-value DW-MRI used fol-lowing parameters: a repetition time (msec)/ echo time (msec) of 7000~12000/62, section
thickness of 3 mm, gap of 1 mm, field of view of
360 × 324 mm, matrix of 160 × 192. Seven b values from 0 to 800 sec/mm2 (0, 50, 100, 200, 400, 600 and 800 sec/mm2, with one
sig-nal acquired for b = 0 sec/mm2, two signals
acquired for b = 50, 100, 200 sec/mm2, four
signals acquired for b = 400, 600 sec/mm2,
and six signals acquired for b = 600, 800 sec/
approximately 40 slices were obtained when performing multi-b value DWI.
Post-processing and image analysis
DWI processing and analysis was carried out on an Advantage Workstation 4.5 (GE Medical Systems). Two experienced radiologists (with 10 years of experience performing abdominal MRI) manually drew the regions of interest (ROIs) in the diffusion weighted image series
(ADCst, DDC, α maps) for all b value. ROIs (150
mm2) [18] were placed in the right lobe to avoid large vessels, bile ducts, and focal hepatic lesions. Each ROI was measured 3 times, sepa-rately. After obtaining three ROI values, the average value was used for each patient. All the ROIs were drawn by two radiologists in consensus.
In our work, we applied the least squares fit for a linear fitting with the mono-exponential model and the Levenberg-Marquardt fit for a nonlinear fitting with the stretched-exponential model. These were commonly used by fitting
algorithms in previous studies (Figure 1A and
1B) [16, 19].
Liver histopathology
In our study, the METAVIR scoring system was used to semi-quantitatively evaluate the stage
of fibrosis and histological activity [11, 20-22].
Fibrosis was staged on a scale of 0 to 4 as
fol-lows: F0, no fibrosis; F1, portal fibrosis without septa formation; F2, portal fibrosis with rare
septa formation; F3, numerous septa formation
without cirrhosis; F4, cirrhosis [23]. Histological
[image:3.612.94.523.75.213.2]activity was scored as follows: no activity (A0);
Figure 1. Semi-logarithmic plot of hepatic diffusion-related signal decay with respect to increasing b-values
demon-strates improved fit of the raw data with a stretched-exponential model when compared to mono-exponential model. A. A 51-year-old female patient with no fibrosis (F0). B. A 38-year-old male patient with a history of hepatitis B with HF (F2).
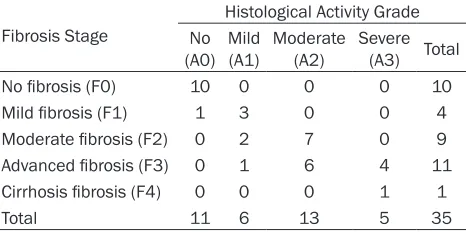
Table 1. Distribution of Various Stages of Fibrosis and
Grades of Histological activity
Fibrosis Stage
Histological Activity Grade
No
(A0) Mild (A1) Moderate (A2) Severe (A3) Total
No fibrosis (F0) 10 0 0 0 10
Mild fibrosis (F1) 1 3 0 0 4
Moderate fibrosis (F2) 0 2 7 0 9
Advanced fibrosis (F3) 0 1 6 4 11
Cirrhosis fibrosis (F4) 0 0 0 1 1
Total 11 6 13 5 35
Note: F0 group includes 10 patients who were assumed to have healthy livers. The 10 patients without a histopathologic diagnosis with no evidence or history of liver disease, alcohol abuse, hepatic malignancy, or liver function test abnormalities were assumed to be fibrosis stage F0 and histological activity A0 in our study.
The ADCst was calculated using the mono-exponential model for all 8 b-values and
fitted to the following equation: Sb/S0 =
exp (-bADC) [1]. Where Sb represents the signal intensity at a given diffusion weight-ing b, S0 is the signal intensity without any diffusion weighting, and -b represents the diffusion sensitizing factor. ADC
repre-sents an apparent diffusion coefficient. DDC and α were calculated using the
stretched-exponential model which emplo- yed the following equation: Sb/S0 = exp
(-bDDC)α [2]. Where α, between 0 and 1, is
the intravoxel water diffusion heterogene-ity; the index DDC, the distributed
[image:3.612.92.325.311.427.2]mild activity (A1); moderate activity (A2); and
severe activity (A3). In the work, the fibrosis stage was verified by pathology of
ultrasound-guided 18-gauge core liver biopsy. The liver biopsy specimen was taken from the right pos-terior lobe of the liver. Two experienced pathol-ogists (with 15 years and 6 years of experience in abdominal diagnosis, respectively) blinded to all patients clinical and MRI data reviewed each of the specimens independently and provided METAVIR scores in consensus. Ten patients with healthy livers in control group
were regarded as fibrosis stage F0 [2, 8].
Statistical analysis
All analyses were performed with SPSS statisti-cal software (version 17.0; SPSS, Chicago, IL). A P-value <0.05 was considered to indicate a
sig-nificant difference.
A series of paired sample t-tests were used to
compare the ADCst, DDC and α values of this
study group with the control group. Independent sample t-tests were also adopted to compare
the ADCst, DDC and α of fibrosis stage 0 with stage 1-4, fibrosis stage 0-1 with stage 2-4 and
fibrosis stage 0-2 with stage 3-4 in this study
group.
Pearson’s correlation coefficient was used to
assess the correlation between ADCst and
DDC values of fibrosis groups. Pearson’s corre
-lation coefficient was also conducted to evalu -ate the correlation of all parameter (ADCst,
DDC, α) values with stages of HF. Correlation coefficients were categorized by absolute value
as follows: very weak to negligible correlation, 0.0-0.2; weak correlation, 0.2-0.4; moderate correlation, 0.4-0.7; strong correlation, 0.7-0.9;
very strong correlation, 0.9-1.0 [24].
In the end, the area under the Receiver Ope- rating Characteristic (ROC) curve was used to
evaluate the performance of ADCst, DDC and α in discriminating fibrosis stage 1 or greater,
stage 2 or greater, and stage 3 or greater. We obtained the maximum of the sum of sensitivity
and specificity by choosing optimal cutoff val -ues for multiple b-value DWI.
Results
The fibrosis stages and histological activity
[image:4.612.88.524.72.179.2]grades of the 35 cases (including 25 patients
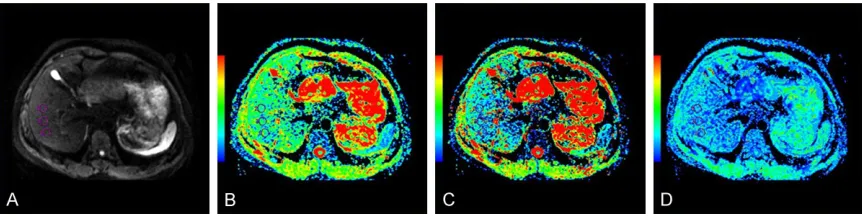
Figure 2. Characterization of a 51-year-old female patient with no fibrosis (F0). A. Multiple b-value DWI map of F0. B.
The ADCst map shows the ADCst value was 1.29 × 10⁻³ mm2/s. C. The DDC map shows the DDC value was 0.973 ×
10-3 mm2/s. D. The α map shows the α value was 0.447.
Figure 3. Characterization of a 38-year-old male patient with a history of hepatitis B with HF (F2). A. Multiple b-value
DWI map of F2. B. The ADCst map shows decreased value (1.14 × 10⁻³ mm2/s). C. The DDC map shows decreased
[image:4.612.90.521.238.348.2]with chronic liver diseases and 10 patients with healthy livers in control group) are present-ed in Table 1. Among the 35 patients, the fibro -sis stage distributions are as follows: F0 group included 10 patients who were assumed to have healthy livers and no histological activity
[2, 8] (Figures 1A, 2A-D), F1 group included 4 patients who had no (1 case) or mild histologi-cal activity (3 cases). F2 group included 9 patients who had mild (2 cases) or moderate histological activity (7 cases) (Figures 1B,
3A-D). F3 group included 11 patients who had mild to severe histological activity. F4 group included only 1 patient who had severe histo-logical activity.
A paired sample t-test was used for the study and control groups. As shown in Table 2, the
mean ADCst, DDC and α values of the liver in
the study group were different from the corre-sponding parameters in the control group, respectively (all P<0.05).
Pearson’s correlation coefficient was used to
evaluate the correlation of the values (ADCst,
DDC and α) with fibrosis stages. The results are
shown in Table 3. Both the mean ADCst and DDC values show a negative correlation with
the fibrosis stages (r = -0.591 and -0.786, all P<0.001), i.e. the ADCst and DDC values de- crease with an increase of the stage of the
fibrosis. However, α values show no significant correlation with the HF stages (P>0.05). Pear-son’s correlation coefficient was also adopted
to assess the correlation between ADCst and DDC. There was a moderate positive correla-tion between ADCst and DDC (r = 0.596, P< 0.001).
As shown in Table 4, independent sample
t-tests were used to compare fibrosis stage 0
with stage 1-4 (F0 vs. F1-F4), fibrosis stage 0-1
with stage 2-4 (F0-F1 vs. F2-F4), fibrosis stage
0-2 with stage 3-4 (F0-F2 vs. F3-F4) in the
ADCst, DDC, and α values. We found that groups F0, F0-F1 and F0-F2 of HF were signifi -cantly different from groups F1-F4, F2-F4 and F3-F4 in the mean values of ADCst or DDC,
respectively (all P<0.05). The α values of gro-ups F0, F0-F1 and F0-F2 showed no significant
difference from groups F1-F4, F2-F4 and F3-F4,
respectively (all P>0.05).
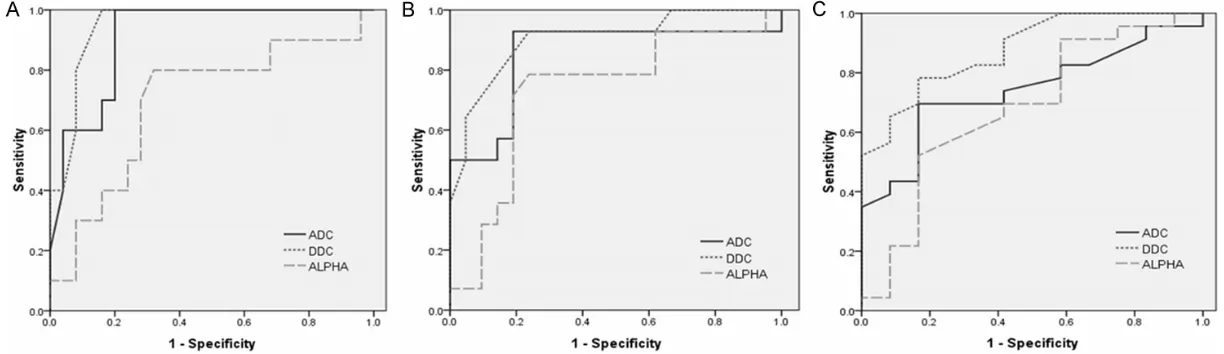
According to the ROC analysis (Figure 4A-C),
the areas under the curves (AUCs) of the DDC, ADC and α for differentiating F0 from F1-4 were
0.912, 0.948, and 0.694, respectively. The
AUCs of DDC, ADC and α for differentiating F1
from F2-4 were 0.850, 0.903, and 0.730,
respectively. The AUCs of DDC, ADC and α for
differentiating F2 from F3-4 were 0.741, 0.879, and 0.679, respectively. The DDC and ADC
were significant parameters for differentiating
F0 from F1-4, F1 from F2-4, F2 from F3-4 (all P<0.05, Table 5). Although α was a significant
parameter for differentiating F1 from F2-4
(P<0.05), it was not a significant parameter for
differentiating F0 from F1-4, F2 from F3-4 (all
P>0.05, Table 5). Based on ROC analysis (Fig- ure 4A-C), the optimal cutoff values, sensitivity,
and specificity are summarized in Table 5.
Discussion
In this study, we quantitatively evaluated HF
in patients with chronic liver diseases using the stretched-exponential and mono-exponen-tial models. The results showed that the DDC from the stretched-exponential model provided
greater diagnostic accuracy in staging HF than
the ADCst from the mono-exponential model when histopathology was used as the refer-ence standard. Therefore, DDC may serve as an optimal diffusion parameter for diagnosis
and staging of HF.
In our study, the results showed that ADCst,
DDC of the fibrotic livers in the study group were significantly different from the corre
-Table 2. Comparison of the parameters be-tween the study and control groups
Parameters
Study Group
(n = 25) Values (n = 25) ValuesControl Group P
Mean ± SD Mean ± SD
ADCst* 1.14±0.16 1.36±0.16 0.000 DDC* 0.82±0.09 1.04±0.13 0.000
α 0.55±0.04 0.57±0.04 0.047
* = (× 10-3 mm2/s).
Table 3. Correlation coefficients between parameters and fibrosis stages in the study
group
Parameters r p
ADCst -0.591 0.000 DDC -0.786 0.000
sponding parameters of the normal livers in
the control group. Since HF is a nonspecific
response to chronic liver diseases that results in excessive synthesis and deposition of extra-cellular matrix (ECM), particularly collagen
fibers, in which the protons are less ample and tightly bound [25, 26] the water molecular dif
-fusion would be restricted in fibrotic liver because of collagen fibers existing in the dis -torted lobular tissue. As a consequence, ADCst
values decrease in a fibrotic liver when com -pared with a normal liver. The DDC can be sup-posed as a weighted sum over a continuous distribution of ADCst that is comprised of the multi-exponential decay properties. Therefore, DDC demonstrates a theoretically more accu-rate description of diffusion in the present of multi-exponential decay and decrease in the
fibrotic liver when compared with a normal liver [14, 16]. In pioneering studies, Patel et al. [27]
and Luciani et al. [28] all found that the mean ADC values in the fibrotic and cirrhotic liver
groups were lower than the values in the healthy liver group with multiple b-values (1.41 × 10⁻³ mm2/s vs. 1.73 × 10⁻³ mm2/s [27]; 1.23 × 10⁻³ mm2/s vs. 1.39 × 10⁻³ mm2/s [28]). So far, only Anderson et al. has reported on the
stretched-exponential model in evaluating murine’s HF with high b values [17]; there is no report on the
stretched-exponential model in evaluating hu-
man HF. As shown in this study, we also found
that both the mean ADCst and DDC values of
fibrotic liver in the study group were
signific-antly lower than the values of those in the nor-mal livers in the control group (1.14 × 10⁻³ mm2/s vs. 1.36 × 10⁻³ mm2/s; 0.82 × 10⁻³ mm2/s vs. 1.04 × 10⁻³ mm2/s). Interestingly,
our results showed that the mean α value of the fibrotic liver in the study group was different
from the normal liver and was slightly lower
than the normal liver, although there is no clear
evidence to prove that a fibrotic liver may exhib -it more intravoxel diffusion heterogene-ity than a normal liver.
With increasing HF stages, the accumulation
of the extracellular matrix (including collagen
fibers and proteins etc.) would gradually incre- ase. Thereafter, the water molecular diffusion would be obviously restricted with the
increas-ing fibrosis stage. The ADCst and DDC values would decrease with the increase of the HF
stage. In our work, the DDC demonstrated a
strong negative correlation with the HF stages
(r = -0.786), while ADCst demonstrated a
mod-erate correlation with the HF stages (r = -0.579). The above-mentioned results were similar to
previous findings [17]. In our work, we also found that group fibrosis stages (i.e., stage 0, stage 0-1 and stage 0-2) were significantly dif
-ferent from the group fibrosis stage 1-4, stage
2-4 and stage 3-4, in the mean values of ADCst or DDC, respectively (all P<0.05).
The α values have no significant correlation with the HF stages. The parameter α, which
characterizes the deviation from mono-expo-nential decay in the stretched-expomono-expo-nential mo- dels, is supposed to represent an increase in intravoxel heterogeneity. Nevertheless, the bio-logical explanation of the increase in intravoxel
heterogeneity has not yet been defined so far.
Previous studies showed the increase in intra-voxel heterogeneity in malignant tumors and
reported the finding is a sign of brain tumor invasion [16, 17, 29-32]. In the study, our result demonstrated a lack correlation between HF stages and the α value. We also found that the fibrosis stage 0, stage 0-1 and stage 0-2 had no significant differences in α values when com
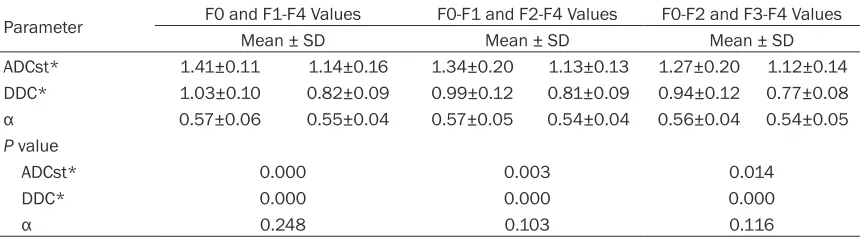
-Table 4. Comparison of mean values between fibrosis stages
Parameter F0 and F1-F4 Values F0-F1 and F2-F4 Values F0-F2 and F3-F4 Values Mean ± SD Mean ± SD Mean ± SD ADCst* 1.41±0.11 1.14±0.16 1.34±0.20 1.13±0.13 1.27±0.20 1.12±0.14 DDC* 1.03±0.10 0.82±0.09 0.99±0.12 0.81±0.09 0.94±0.12 0.77±0.08
α 0.57±0.06 0.55±0.04 0.57±0.05 0.54±0.04 0.56±0.04 0.54±0.05
P value
ADCst* 0.000 0.003 0.014
DDC* 0.000 0.000 0.000
α 0.248 0.103 0.116
[image:6.612.91.523.85.204.2]Figure 4. Analysis of ADCst, DDC and α in distinguishing stages of HF by ROC curve. A. ROC analysis for ADCst, DDC and α to distinguish HF stage 1 or greater ((F0 vs. F1-F4). B. ROC analysis for ADCst, DDC and α to distinguish HF stage 2 or greater (F0-F1 vs. F2-F4). C. ROC analysis for ADCst, DDC and α to distinguish HF stage
pared with the fibrosis stage 1-4, stage 2-4 and stage 3-4, respectively. Hence, no clear evi
-dence of increasing stages of HF accompanied
by an increase in intrvoxel heterogeneity were detected using the stretched-exponential
model [17].
According to the ROC analysis, the AUC values
of ADCst for differentiating group F0 from F1-F4, F0-F1 from F2-F4, F0-F2 from F3-F4 were 0.912, 0.850, 0.741, respectively (all P< 0.05; Table 5). The AUC values of DDC for dif -ferentiating F0 from F1-F4, F0-F1 from F2-F4, F0-F2 from F3-F4 were 0.948, 0.903, 0.879, respectively (all P<0.05; Table 5). The AUC val
-ues of α for differentiating F0-F1 from F2-F4
were 0.730 (P<0.05) and was lower than that
of DDC and ADCst, However, α was not a signifi -cant parameter for differentiating F0 from
F1-F4, F0-F2 from F3-F4 (P = 0.077, 0.085,
respectively; Table 5). The results indicate that
the ADCst and DDC were significant parame -ters for differentiating the above-mentioned
groups (all the AUC values between 0.7 and
0.9). Moreover, our results demonstrated for
the first time that DDC showed a slightly better
diagnostic ability than ADCst for differentiating the above-mentioned groups. Therefore, we
could consider that DDC demonstrates a more accurate description of diffusion in the
pres-ence of multi-exponential models [14, 15, 30, 32]. It is generally accepted that patients with
-out HF or with early HF (F0-F1) have a lower risk
for hepatocellular carcinoma or liver failure,
while significant HF (F2-F4) is a prediction of
future hepatic cirrhosis and is also an indicant
for therapy in hepatitis C patients [33]. Previous studies [8, 34, 35] have reported that HF stage 0-2 is described as mild-moderate fibrosis, and
its progression can be prevented by clinical
intervention and treatment. However, it is diffi
-cult to reverse HF stage 3-4 which is described as advanced HF. Hence, we believe that DDC
may have important greater clinical implica-tions for guiding clinical treatment and assess-ing the effect of the therapy for patients with chronic liver diseases than ADCst.
A moderate positive correlation of ADCst with the potentially more accurate DDC values of
the HF was discovered in the study (r = 0.596).
This finding could be explained by the
stretched-exponential model. Reviewing Eqs. (1) (Sb/S0 =
exp (-b × ADC)) and Eqs. (2) (Sb/S0 = exp (-b ×
DDC)α), we could obtain the following equation:
ADC = ba-1 × DDCa. (3) when b × DDC = 1 (regard
-less of a value) or when a = 1 (regard-less of b-value or DDC), DDC≈ADC. If a<1, and b × DDC>1, DDC will be higher than ADC. In con -trast, if a<1, and b × DDC<1, DDC will be lower than ADC. While the degree of agreement between ADCst and DDC in the study is lower
than the previous studies [30, 36] which found a strong positive correlation (R = 0.9716, 0.99,
0.98, 0.99, all P<0.05) between ADCs and DDCs of high-grade gliomas, prostate cancer, normal peripheral zone and normal central
gland tissues. At present, this finding could not
yet be clearly explained. For the moment it is still indistinct if, and to what extent, DDCs and
ADCs of other diseases agree. Hence, this
issue remains conjectural and further study is needed.
There are a few limitations to the study. First, the number of subjects was small, although prior studies have had similar small numbers of
cases [37]. We plan on performing a study with a large number of patients in each fibrosis
stage. Second, we didn’t analyze fat or iron
deposition in HF and didn’t know whether they might affect the ADCst, DDC, and α values.
[image:8.612.91.289.107.374.2]Further work will be conducted to explore these possibilities.
Table 5. Comparison of ADCst, DDC and α in predicting and staging HF according to opti -mal cutoff values
Parameter F1-F4F0/ F0-F1/F2-F4 F0-F2/F3-F4 ADCst*
Cutoff value 1.275 1.215 1.205
AUC 0.912 0.850 0.741
Sensitivity (%) 100 92.9 69.6
Specificity (%) 80 81 83.3 P 0.000 0.001 0.021 DDC*
Cutoff value 0.905 0.855 0.845
AUC 0.948 0.903 0.879
Sensitivity (%) 100 92.9 78.3
Specificity (%) 84 76.2 83.3 P 0.000 0.000 0.000
α
Cutoff value 0.562 0.562 0.564
AUC 0.694 0.730 0.679
Sensitivity (%) 80 78.6 52.2
Specificity (%) 68 76.2 83.3 P 0.077 0.023 0.085
In conclusion, ADCst and DDC showed a sig-
nificant correlation with significant HF.
Furth-ermore, DDC showed a higher diagnostic
per-formance than ADCst for discriminating HF
stages. Therefore, our study demonstrates the stretched-exponential and mono-exponential model of multiple-b value DWI may provide a noninvasive quantitative method of assessing
and staging HF. We further believe the param -eters (DDC, ADCst) could be used as an
alterna-tive marker for HF, offering help in the clinical diagnosis of HF, monitoring its progression,
guiding therapy and assessing the effect of treatment.
Acknowledgements
This work was supported by the National Natural Science Foundation of China (Grant Nos. 81271534 and 31470047).
Disclosure of conflict of interest
None.
Address correspondence to: Dr. Dapeng Shi, De-
partment of Radiology, The People’s Hospital of Zhengzhou University & Henan Provincial People’s Hospital, Zhengzhou 450003, Henan, China. Tel:
+86 37165580930; E-mail: shidapengsyy@126. com
References
[1] Chow AM, Gao DS, Fan SJ, Qiao Z, Lee FY, Yang
J, Man K, Wu EX. Liver fibrosis: An intravoxel
incoherent motion (IVIM) study. J Magn Reson Imaging 2012; 36: 159-167.
[2] Watanabe H, Kanematsu M, Goshima S, Kondo H, Onozuka M, Moriyama N, Bae KT. Staging Hepatic Fibrosis: Comparison of
Gad-oxetate Disodium-enhanced and Diffusion-weighted MR Imaging-Preliminary Observa- tions. Radiology 2011; 259: 142-150.
[3] Shim JH, Yu JS, Chung JJ, Kim JH, Kim KW. Segmental Difference of the Hepatic Fibrosis from Chronic Viral Hepatitis due to Hepatitis B versus C Virus Infection: Comparison Using
Dual Contrast Material-Enhanced MRI. Korean J Radiol 2011; 12: 431-438
[4] Wang Y, Ganger DR, Levitsky J, Sternick LA, McCarthy RJ, Chen ZE, Fasanati CW, Bolster B, Shah S, Zuehlsdorff S, Omary RA, Ehman RL,
Miller FH. Assessment of chronic hepatitis and fibrosis: comparison of MR elastography
and diffusion-weighted imaging. AJR Am J Roentgenol 2011; 196: 553-561.
[5] Yoon JH, Lee JM, Woo HS, Yu MH, Joo I, Lee ES, Sohn JY, Lee KB, Han JK, Choi BI. Staging of Hepatic Fibrosis: Comparison of Magnetic
Resonance Elastography and Shear Wave Elastography in the Same Individuals. Korean J Radiol 2013; 14: 202-212.
[6] Arthur MJ. Reversibility of liver fibrosis and cir -rhosis following treatment for hepatitis C. Gastroenterology 2002; 122: 1525-1528.
[7] Lim YS, Kim WR. The global impact of hepatic
fibrosis and end-stage liver disease. Clin Liver
Dis 2008; 12: 733-746.
[8] Chen C, Wang B, Shi D, Fu F, Zhang J, Wen Z, Zhu S, Xu J, Lin Q, Li J, Dou S. Initial study of biexponential model of intravoxel incoherent motion magnetic resonance imaging in
evalua-tion of the liver fibrosis. Chin Med J 2014; 127:
3082-3087.
[9] Lee JE, Lee JM, Lee KB, Yoon JH, Shin CI, Han JK, Choi BI. Noninvasive Assessment of Hepa-tic Fibrosis in Patients with Chronic Hepatitis B Viral Infection Using Magnetic Resonance
Elastography. Korean J Radiol 2014; 15: 210-217.
[10] Bonekamp S, Torbenson MS, Kamel IR. Diffusion-weighted Magnetic Resonance Ima- ging for the Staging of Liver Fibrosis. J Clin Gastroenterol 2011; 45: 885-892.
[11] Fujimoto K, Tonan T, Azuma S, Kage M,
Nakashima O, Johkoh T, Hayabuchi N, Okuda
K, Kawaguchi T, Sata M, Qayyum A. Evaluation of the Mean and Entropy of Apparent Diffusion
Coefficient Values in Chronic Hepatitis C:
Correlation with Pathologic Fibrosis Stage and
Inflammatory Activity Grade. Radiology 2011;
258: 739-748.
[12] Ichikawa S, Motosugi U, Morisaka H, Sano K, Ichikawa T, Enomoto N, Matsuda M, Fujii H, Onishi H. MRI-based staging of hepatic
fi-brosis: Comparison of intravoxel incoherent motion diffusion-weighted imaging with mag-netic resonance elastography. J Magn Reson Imaging 2015; 42: 204-210.
[13] Maier SE, Bogner P, Bajzik G, Mamata H,
Mamata Y, Repa I, Jolesz FA, Mulkern RV. Normal brain and brain tumor:
multicompo-nent apparent diffusion coefficient line scan
imaging. Radiol 2001; 219: 842-849.
[14] Bennett KM, Schmainda KM, Bennett RT,
Rowe DB, Lu H, Hyde JS. Characterization of
continuously distributed cortical water diffu-sion rates with a stretched-exponential model. Magn Reson Med 2003; 50: 727-734.
[15] Bennett KM, Hyde JS, Schmainda KM. Water
diffusion heterogeneity index in the human brain is insensitive to the orientation of applied
magnetic field gradients. Magn Reson Med
[16] Kwee TC, Galbán CJ, Tsien C, Junck L, Sundgren PC, Ivancevic MK, Johnson TD, Meyer CR, Rehemtulla A, Ross BD, Chenevert TL. Intra- voxel water diffusion heterogeneity imaging of human high-grade gliomas. NMR Biomed 2010; 23: 179-187.
[17] Anderson SW, Barry B, Soto J, Ozonoff A,
O’Brien M, Jara H. Characterizing Non-Gau-ssian, High b-value Diffusion in Liver Fibrosis:
Stretched Exponential and Diffusional Kurtosis Modeling. J Magn Reson Imaging 2014; 39: 827-834.
[18] Filipe JP, Curvo-Semedo L, Casalta-Lopes J, Marques MC, Caseiro-Alves F. Diffusion-weighted imaging of the liver: usefulness of ADC values in the differential diagnosis of fo-cal lesions and effect of ROI methods on ADC measurements. Magn Reson Mater Phy 2013; 26: 303-312.
[19] Bai Y, Lin Y, Tian J, Shi D, Cheng J, Haacke EM, Hong X, Ma B, Zhou J, Wang M. Grading of Gliomas by Using Monoexponential,
Biexpon-ential, and Stretched Exponential Diffusion-weighted MR Imaging and Diffusion Kurtosis MR Imaging. Radiology 2016; 278: 496-504.
[20] Ishak K, Baptista A, Bianchi L. Histological
grading and staging of chronic hepatitis. J
Hepatol 1995; 22: 696-699.
[21] Mallet V, Gilgenkrantz H, Serpaggi J, Verkarre V, Vallet-Pichard A, Fontaine H, Pol S. Brief
communication: the relationship of regression of cirrhosis to outcome in chronic hepatitis C. Ann Intern Med 2008; 149: 399-403.
[22] Taouli B, Tolia AJ, Losada M, Babb JS, Chan ES,
Bannan MA, Tobias H. Diffusion weighted MRI for quantification of liver fibrosis: preliminary
experience. AJR Am J Roentgenol 2007; 189: 799-806.
[23] Bedossa P, Poynard T; The French METAVIR Cooperative Study Group. An algorithm for grading activity in chronic hepatitis C.
Hepatology 1996; 24: 289-293.
[24] Karlik SJ. Exploring and summarizing radio- logic data. AJR Am J Roentgenol 2003; 180: 47-54
[25] Friedman SL. Molecular regulation of hepatic
fibrosis, an integrated cellular response to tis -sue injury. J Biol Chem 2000; 275: 2247-2250.
[26] Wynn TA. Cellular and molecular mechanisms
of fibrosis. J Pathol 2008; 214: 199-210. [27] Patel J, Sigmund EE, Rusinek H, Oei M, Babb
JS, Taouli B. Diagnosis of cirrhosis with intra-voxel incoherent motion diffusion MRI and dy-namic contrast-enhanced MRI alone and in combination: preliminary experience. J Magn Reson Imaging 2010; 31: 589-600.
[28] Luciani A, Vignaud A, Cavet M, Nhieu JT, Mallat A, Ruel L, Laurent A, Deux JF, Brugieres P, Rahmouni A. Liver cirrhosis: intravoxel incoher-ent motion MR imaging-pilot study. Radiology 2008; 249: 891-899.
[29] Hoff BA, Chenevert TL, Bhojani MS, Kwee TC,
Rehemtulla A, Le Bihan D, Ross BD, Galbán CJ. Assessment of multiexponential diffusion fea-tures as MRI cancer therapy response metrics. Magn Reson Med 2010; 64: 1499-1509.
[30] Kwee TC, Galbán CJ, Tsien C, Junck L, Sundg- ren PC, Ivancevic MK, Johnson TD, Meyer CR, Rehemtulla A, Ross BD, Chenevert TL. Com-
parison of apparent diffusion coefficients and distributed diffusion coefficients in high grade
gliomas. J Magn Reson Imaging 2010; 31: 531-537.
[31] Palombo M, Gabrielli A, De Santis S, Capuani
S. The γ parameter of the stretched-exponen
-tial model is influenced by internal gradients:
validation in phantoms. J Magn Reson 2012; 216: 28-36.
[32] Bennett KM, Hyde JS, Rand SD, Bennett R, Krouwer HG, Rebro KJ, Schmainda KM.
Intravoxel distribution of DWI decay rates re-veals C6 glioma invasion in rat brain. Magn Reson Med 2004; 52: 994-1004.
[33] Ghany MG, Strader DB, Thomas DL, Seeff LB. Diagnosis, management, and treatment of
hepatitis C: an update. Hepatology 2009; 49:
1335-1374.
[34] Afdhal NH. Diagnosing fibrosis in hepatitis C: is
the pendulum swinging from biopsy to blood
tests? Hepatology 2003; 37: 972-974.
[35] Kim AI, Saab S. Treatment of hepatitis C. Am J Med 2005; 118: 808-815.
[36] Liu X, Zhou L, Peng W, Wang H, Zhang Y.
Comparison of stretched-Exponential and mo- noexponential model diffusion- Weighted im-aging in prostate cancer and normal tissues. J Magn Reson Imaging 2015; 42: 1078-85
[37] Dyvorne HA, Galea N, Nevers T, Fiel MI,