State Capacity, Capital Mobility, and Tax Competition
Arian Daneshmand1 , Mahnoush Abdollah-Milani2
Received: 2016/01/04 Accepted: 2016/04/17
Abstract
he theory of international tax competition suggests that governments attempt to attract mobile capital bases by undercutting the foreign capital tax rate. An analysis of the role that state capacity plays in tax policymaking under international pressures is, however, missing. The central contribution of our study is to highlight the importance of the interaction between state capacity and capital mobility. It is the purpose of this article to show whether state capacity increases capital tax rates in a way that tax competition under high capital mobility dampens. Our analysis of 20 OECD countries over the period of 1966-2000 suggests that the increase in capital tax rates as a result of higher state capacity is smaller when capital mobility is high.
Keywords: Capital Mobility, Capital Taxation, Spatial Models, State Capacity, Tax Competition.
JEL Classification: C31, C33, H20, H87.
1.
Introduction
Standard tax competition theories, such as Zodrow and Mieszkowski (1986), predict a decline in the level of tax rates on mobile capital bases. The argument is that international tax competition induces a downward pressure on capital taxation to the extent that the reduction in capital tax rates may actually lead to an inflow of a sufficient amount of foreign tax bases and vice versa. In theory, one would expect tax policy convergence to take place among countries. In reality, not all competing governments share a mutual interest in undercutting the foreign capital tax rates. It is in any case clear that governments react differently to international tax competition pressures due to dissimilar domestic settings. The purpose of this article is to explain variation in the levels of capital taxation. We focus on two interrelated
1. Assistant Professor, Faculty of Economics, Allameh Tabataba’i University, Iran. (Corresponding author: [email protected]).
2. Associate Professor, Faculty of Economics, Allameh Tabataba’i University, Iran. ([email protected]).
analytical questions. First, how does state capacity affect the tax rate on capital? Second, to what extent does capital mobility influence the relationship between state capacity and capital taxation?
An important politico-economic factor that has been widely neglected in studies of tax competition is the importance of governmental and administrative efficiencies in enforcing revenue collection from the economy (also simply called ‘state capacity’)1
. One of the most popular definitions of state capacity is the one described by Skocpol (1985: 9). In her words, state capacity is defined as “the ability of states to implement official goals, especially over the opposition of powerful social groups, or in the face of difficult economic circumstances”. A closer look at the literature reveals that only limited attention has been given to the bureaucratic and administrative capacity of the state to impose certain types of tax policies; particularly those relating to tax competition.
In this article, we address the relationship between state capacity and capital taxation. Understanding this relationship is central to studies of domestic tax policy and specifically tax competition. Regarding the effect of state capacity, we argue that the efficiency and performance of a government to mobilize and extract resource from its population are as important as other economic factors that have been widely acknowledged in the literature, such as the size of capital endowment (Hays, 2003) and the distribution of tax bases (Bucovetsky, 1991). More specifically, our argument is that the bureaucratic and administrative capacity allows states to raise capital tax rates, but competition under high mobility limits this ability. Our empirical analysis of the relationship between state capacity and capital taxation in 20 Organisation for Economic Co-operation and Development (OECD) countries in the period of 1966 to 2000 suggests that the impact of state capacity is strongly conditional on capital mobility. The remainder of the article is organized as follows. Section 2 presents the theoretical framework. Section 3 describes the method of estimation. The fourth section presents and discusses the empirical findings. The final section is the conclusion.
2.
Theoretical argument
Following the basic results of tax competition literature, increasing market integration exerts a significant impact on domestic tax policymaking. With high capital mobility, the incentives for governments to attract the inflow of
foreign capital have grown massively over the last decades, so that capital tax rates have significantly declined due to international competitive pressures. This fiscal externality has given governments an incentive to compete against each other to reduce undesirable outflows of capital. While politico-economic constraints on the outcome of tax competition have been the focus of much debate in the comparative political economy literature (Swank, 1998, 2002; Garrett and Mitchell, 2001; Swank and Steinmo, 2002; Hays, 2003; Basinger and Hallerberg, 2004; Franzese and Hays, 2008; Pluemper et al., 2009; Cao, 2010; Jensen and Lindstadt, 2011), the question of how much governments can engage in tax competition still remains for policymakers.
In this article, we stress the role that state capacity plays in determining a country’s capital tax rate. Tilly (1985) claims that state capacity originally referred to the power of the state to raise revenue. Although most political economists studying the strategic effects of tax competition have generally ignored the importance of state capacity, influential works such as Campbell (1993), Cheibub (1998), Acemoglu (2005, 2006), and Besley and Persson (2010) argue that strong state capacity helps governments to extract revenues from the economy through tax policies. Unfortunately, the capacity of the state to engage in competition for mobile capital gets relatively little attention in the literature.
We contribute directly to the work on tax competition by authors such as Dehejia and Genschel (1999) and Hays (2003, 2009) who, both theoretically and empirically, argue that small countries that are poorly endowed with capital gain from tax competition, while large countries that are richly endowed with capital are harmed by it. Dehejia and Genschel (1999) build a game-theoretic model of tax competition involving a two-country world and one potentially mobile tax base. Their model demonstrates that small countries have an incentive to engage in international tax competition. When a small country undercuts the tax level of the large country, the revenue gain from the inflow of foreign capital outweighs the revenue loss from its small tax base. However, their analyses leave open the question of whether those countries with high state capacity are also the countries with low capital taxation.
efficient tax policies. And according to Besley and Persson (2010), tax policies are constrained by the state’s fiscal and legal capacity.
For the purpose of this study, we mainly focus on a particular definition of state capacity developed by Arbetman et al. (1997). Relative state capacity - as an indicator of the relative strength of the state to mobilize resources from its population- has been used in several studies of environmental policies (Janicke, 1997; Herbst, 2000; Van de Walle, 2001; Ehrhardt-Martinez, 2002; Schwartz, 2003; Ward et al., 2014). Some may be concerned that relative state capacity is not a reliable measure of state extractive capacity, but a number of reasons suggest that it is. Other measures of state capacity, such as government total revenue and government consumption, are not appropriate for our purpose because we are interested in assessing the efficiency and performance of a government to mobilize and extract resource from population in relation to its expected performance (Arbetman and Johnson, 2007). Government consumption is a measure of the amount of a society’s resources consumed by government. It measures expenditures, rather than revenue gathering activity (Thies, 2010). Total revenue is a measure of the government’s income that includes both tax and non-tax revenue. It is not typically seen as the best measure of revenue extraction, because it contains non-tax revenue (Thies, 2010; Ward et al., 2014).
According to our argument, state capacity exerts significant influence on the domestic capital tax rate, but the impact is strongly conditioned by a country’s capital mobility. Thus, ceteris paribus, we would expect high levels of state capacity to be positively associated with the level of capital taxation in a world unconstrained by the internationalization of capital. In this article, we focus on the policy options of governments, no matter what their political orientation, regarding capital taxation in two hypothetical scenarios. In the first scenario, low capital mobility, the threat of capital flight is not enough to prevent governments from taxing capital heavily. In the second one, high capital mobility, the internationalization of capital markets reinforces the constraints on a government’s ability to tax capital.
In contrast, high levels of capital mobility make it difficult for governments to be associated with higher levels of capital taxation.1 Upon capital liberalization, tax competition tends to cause a reduction in capital taxation. We expect countries with high state capacity to be associated with less capital taxation, especially if they face severe tax competition. The reason for this is simple: strong state capacity helps governments gather the needed revenue from the economy, for instance shifting their tax revenues from mobile to immobile factors or taxing factors which do not pressure the population.2 As suggested by our argument, the existence of strong state capacity gives sufficient room for policymakers to engage in international tax competition. Thus, we expect that the larger the state’s capacity and the higher capital mobility are, the lower the taxes on capital will. To be precise, weak states are unable to implement very low tax rates on mobile capital because their limited extractive capabilities from the economy forces them to rely more heavily on capital taxation in order to produce a sufficient amount of pubic goods. Specifically, strategic interdependence arises when the domestic policymaker chooses a lower tax rate on the capital base, thereby this alters the optimal tax policy in the foreign country, and vice versa. Obviously, this feature allows us to conclude that, when capital is free to move across jurisdictions, tax policy differences exert a strong influence on policy outcomes.
3.
Data
We test our hypothesis using an existing data set of average effective capital tax rates from Hays (2003) with data for 20 Organization for Economic Co-operation and Development (OECD) countries from 1966 to 2000.3 The panel is unbalanced where the length of the time series varies slightly across countries.4 This time period gives a possibility for direct comparison of our results with previous empirical studies of tax competition. The previous section has made our expectations clear regarding the effects of state capacity and capital mobility on AETR on capital. “Average effective tax rates (AETR), which are defined as the actual revenue of taxes on factor
1. On this point, F.W Scharpf (1997: 23) has commented that: “capital is free to move to locations offering the highest rate of return (…). As a consequence, the capacity of national governments (…) to tax and to regulate domestic capital and business firms is now limited by the fear of capital flight and the relocation of production. Hence all national governments in the European Union are now forced to compete against each other in order to attract, or retain, mobile capital and firms.”
2. “Mineral production or oil profits (oil crude exports) are an easy target for revenue for a government that does not require imposition of cost on the population. Taxation of imports and exports similarly do not pressure the population” (Arbetman and Johnson, 2007: 4). 3. Australia, Austria, Belgium, Canada, Denmark, Finland, France, Germany, Ireland, Italy,
Japan, the Netherlands, New Zealand, Norway, Portugal, Spain, Sweden, Switzerland, the United Kingdom and the United States.
income and consumption related to the relevant tax base” are widely used in most of the empirical studies on tax competition1.
As mentioned above, to date, most studies in this context have used different measures of state capacity such as the total tax to GDP ratio, the total revenue to GDP ratio, government consumption, and government total revenue. In order to capture the concept of the capacity of the state, we use an alternate measure of state extractive capacity derived from Kugler and Arbetman’s (1997) measure of state capacity2
. The state capacity variable addresses the limitations of basic tax capacity measures by creating a ratio of the state’s actual to predicted tax revenue (total taxes/ GDP) based on economic endowment:
𝑅𝑒𝑙𝑎𝑡𝑖𝑣𝑒 𝑆𝑡𝑎𝑡𝑒 𝐶𝑎𝑝𝑎𝑐𝑖𝑡𝑦 = 𝐴𝑐𝑡𝑢𝑎𝑙 𝐸𝑥𝑡𝑟𝑎𝑐𝑡𝑖𝑜𝑛
𝑃𝑟𝑒𝑑𝑖𝑐𝑡𝑒𝑑 𝐸𝑥𝑡𝑟𝑎𝑐𝑡𝑖𝑜𝑛
The measure of relative state capacity assesses the government’s efficacy and proficiency at extracting resources from the population compared to other states with similar levels of development and resource endowments. Other measures of state capacity such as the total tax to GDP ratio and the total revenue to GDP ratio are often endogenous to other factors such as the level of economic development and economic structure (Ward and Cao, 2012). Predicted revenues are estimated as a function of per capita income, the share of mining in the economy, the share of exports in the economy, the share of crude oil production in the economy, and OECD membership. A state that scores 1 on the relative state capacity indicator is extracting exactly as one would expect compared to other states with similar conditions, while those that score higher than 1 are extracting more than expected and those that score lower than 1 are extracting less than expected.3
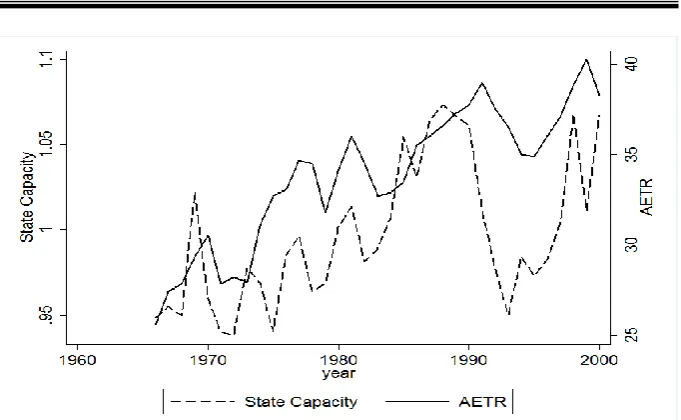
Figure 1 presents average values of two main variables used in the analysis for all countries during the entire period: the variable AETR on capital is scaled on the right-hand side, and state capacity is on the left-hand scale. As can be seen, AETR increased over the sample period of about 35 years. Also, state capacity increased substantially over this period. The
1. Garrett and Mitchell, 2001; Bretschger and Hettich, 2002; Swank and Steinmo, 2002; Hays, 2003; Basinger and Hallerberg, 2004; Winner, 2005; Franzese and Hays, 2008; Pluemper et al., 2009; Pluemper and Numayer, 2010.
2. Marina Arbetman-Rabinowitz; Ali Fisunoglu; Jacek Kugler; Mark Abdollahian; Kristin Johnson; Kyungkook Kang; Zining Yang, 2013, "Replication data for:
Relative Political Capacity Dataset", http://hdl.handle.net/1902.1/16845
Transresearch Consortium [Distributor] V4 [Version]
3. We use a measure of state capacity for the most developed societies, estimated as a linear function for a time-series cross-section of countries by Arbetman-Rabinowitz, Kugler, Johnson and Kang (2012):
𝑇𝑎𝑥
𝐺𝐷𝑃= 𝛽0+ 𝛽1(𝑡𝑖𝑚𝑒) + 𝛽2( 𝑀𝑖𝑛𝑖𝑛𝑔
𝐺𝐷𝑃 ) + 𝛽3( 𝐸𝑥𝑝𝑜𝑟𝑡𝑠
𝐺𝐷𝑃 ) + 𝛽4(
𝐶𝑟𝑢𝑑𝑒 𝑂𝑖𝑙 𝑃𝑟𝑜𝑑𝑢𝑐𝑡𝑖𝑜𝑛
𝐺𝐷𝑃 )
Fig. 1. Average effective tax rates on capital and state capacity. 20 OECD countries, 1966-2000
sample correlation between AETR and state capacity is 0.58. The figure indicates a significant degree of variation in state capacity through time. We use Quinn’s measures of capital account and financial openness (higher scores signify more integration) which are based on a detailed coding of the IMF’s reporting of Exchange Arrangements and Exchange Restrictions in member countries. Quinn finds that capital account liberalization is positively associated with increasing capital taxation.
4.
Econometric methodology
In our empirical analysis, we estimate spatial lag models to account for the described strategic tax competition effect. We replicate the work of Hays (2009), using a Spatio-Temporal Autoregressive (STAR) model as follow:
𝜏𝑖𝑡 = 𝜑𝜏𝑖𝑡−1+ 𝑋𝑖𝑡𝛽 + 𝜌𝑊𝜏𝑖𝑡 + 𝜀𝑖𝑡
where 𝜏, the dependent variable, denotes AETR on capital, and is an NT×1 vector of observations stacked by unit over time. A Time-lagged dependent variable 𝜏𝑡−1 is included to capture persistence in capital tax rates over
time.1 𝑊𝜏𝑡 is the spatial lag, where 𝜌 is the spatial autoregressive coefficient
that gives the impact of the spatial lag on 𝜏𝑡 and 𝑊, the connectivity matrix,
is an NT× NT block-diagonal spatial weighting matrix. Following Franzese,
Hays and Schaeffer (2010), we use a standardized binary contiguity-weights matrix, which codes 𝑊𝑖𝑗=(1, 0) for whether units i and j border,because the row-standardized matrix gives the average of capital taxes in neighbouring countries.1 𝛽 is a K×1 vector of coefficients on X containing NT observations on K independent variables. 𝜀, the residual vector, is an NT×1 vector of stochastic components.
To address the problem of unobserved spatial heterogeneity, all models are estimated with fixed effects. Year dummies are included to capture common trends and control for common shocks (Pluemper et al., 2002). In the case where 𝑊𝜏 is endogenous, Spatial Ordinary Least Squares (S-OLS) will suffer biases simultaneously. Elhorst (2001) and Franzese & Hays (2008) suggest that the Spatial Maximum Likelihood estimator is a good strategy for obtaining consistent estimates of 𝜌 and 𝛽 in the model, including the interdependence pattern.
5.
Empirical results
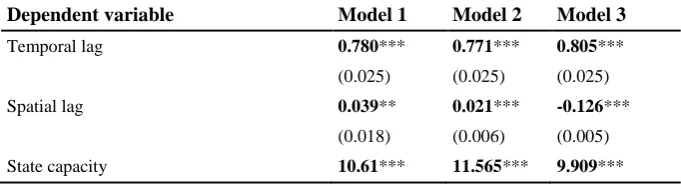
Table 1 reports the results of estimating three alternative models. We present the estimates of the temporal and spatial lags for the dependent variable in the first two rows of the table. The relationship between state capacity and capital mobility is captured by these variables themselves and by their interaction. Table 1 makes clear that our three methods to estimate the effects of state capacity and capital mobility produce similar results. Turning to the article’s main argument, we capture the relationship between state capacity and capital mobility by including not only these two variables into our analysis (for which the theory suggests positive coefficients) but also their interaction (with an expected negative coefficient). We hypothesize that the increase in AETR on capital as a result of higher state capacity is smaller when capital mobility is high.
Table 1. Maximum Likelihood Spatial Models of Average Effective Capital Tax Rates
Dependent variable Model 1 Model 2 Model 3
Temporal lag 0.780*** 0.771*** 0.805***
(0.025) (0.025) (0.025)
Spatial lag 0.039** 0.021*** -0.126***
(0.018) (0.006) (0.005)
State capacity 10.61*** 11.565*** 9.909***
1. 𝑊𝑖𝑗= 0 denotes i and j states did not share a border. 𝑊𝑖𝑗= 1 denotes i and j states shared a
Dependent variable Model 1 Model 2 Model 3
(2.745) (2.741) (2.816)
Capital mobility 0.132** 0.143*** 0.126**
(0.040) (0.040) (0.041)
State capacity X Capital mobility -0.090** -0.094** -0.084**
(0.030) (0.030) (0.031)
Unit fixed effects Yes Yes Yes
Period fixed effects Yes Yes Yes
W row-standardized Yes No Yes
Weight Contiguity Contiguity 1/ln(distance)
N 581 581 581
Notes: Numbers in bold are estimated coefficients; Parentheses contain standard errors. *** statistically significant at 0.01, ** statistically significant at 0.05.
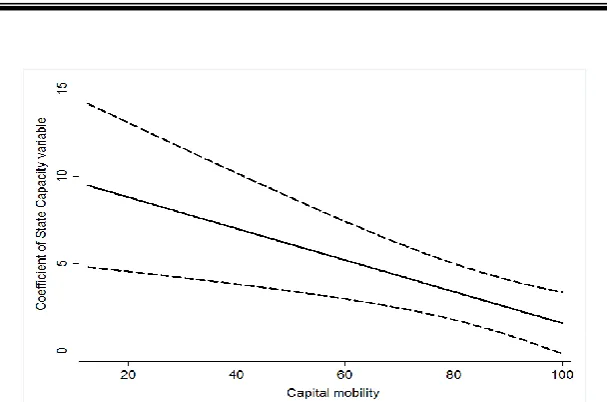
Testing this article’s hypothesis requires assessing the effects of state capacity at different levels of capital mobility. We can use the results in Table 1 to calculate the conditional effects of state capacity given different levels of capital mobility. Figure 2 presents a good amount of support for our claims. The figure presents the coefficients and the upper and lower bounds of 95 percent confidence intervals for the effects of state capacity conditional on different levels of capital mobility (ceteris paribus). The graph clearly illustrates that the coefficient for state capacity is positive and significant (as indicated by the fact that the bounds of the 95 percent confidence interval are both above zero) when capital mobility varies from its minimum to maximum value. Consistent with our theoretical expectations, higher levels of state capacity are associated with higher levels of capital taxation when the threat of capital flight is not enough to prevent governments from taxing capital heavily. The intuition behind this result is that the efficiency and performance of the state in enforcing revenue collection from the economy largely impact its ability to implement high tax rates on capital. The figure clearly confirms the conventional view that at high levels of state capacity, governments have high levels of extraction from the economy (ceteris paribus).
Fig. 2. Effects of state capacity conditional on levels of capital mobility mobility and state capacity creates downward pressures on capital taxation. In other words, under the condition of capital mobility, high levels of state capacity enable governments to transfer their revenue tax base from capital to other forms of revenue sources associated with reductions in capital tax rates. To be precise, strong state capacity allows an engagement in international tax competition. Policymakers, thereby, set lower tax rates on capital in order to prevent capital from fleeing.
In all three models, the coefficient on the temporal lag, which is a one-period lag of the dependent variable, is positive and statistically significant indicating that tax rates on capital have a tendency to persist. As a robustness check, we show analytically that small changes to the model specification could have different effects on the spatial effect estimates. To address this issue, Pluemper and Neumayer (2010) demonstrate the consequences of modification of the model specification on the estimation results for the spatial effect. We take a similar approach in the analysis of spatial dependence1. The coefficient size of the spatial lag in Model 1 is 0.039 and statistically significant. The intuition of this outcome is straightforward. Tax cuts in one jurisdiction induce negative externalities on other jurisdictions, pushing them to cut taxes in response.
To discuss whether the specification of the weighting matrix should be row-standardized, we present Model 2 without row standardization. To do so, the weighting matrix is row standardized by diving each cell in a row by that row’s sum so that the weights in each row of the matrix should add up to one (Franzese and Hays, 2009). Row standardizing the spatial weights
matrices allows us to check on the spatio-temporal stationarity: it requires 𝜑+𝜌 < 1 or the sum of the coefficients size of the temporal and spatial lags to be less than one (Franzese and Hays, 2008). One advantage of this method is that row standardization makes the spatial lag have the same unit or metric as the dependent variable itself (Ward and Gleditsch, 2008: 80).
In Model 2, the spatial lag is still positive and the value of spatial dependence is 0.021, which is slightly lower than the degree of spatial dependence in Model 1, which was 0.039. The positive spatial lag demonstrates that spatial dependence exists. Pluemper and Neumayer (2010) argue that, by changing the relative weight of units from being row standardized to not row standardized, all contiguous countries exert the same influence no matter how many neighbours each country has. In brief, they assert that row standardization is not substantively neutral on model specification in the analysis of spatial dependence.
There are two basic types of spatial weights matrices: contiguity-based and distance-based: A binary contiguity matrix based on shared borders or units that are closer than a certain specified threshold with values of one for contiguous units and zero otherwise, and a contiguous or geographical distance measure for a spatial relationship based on the distance between two units (Beck et al., 2006).
In Model 3, geographical distance as the measure of connectivity between two countries is used instead of a contiguity measure for the weighting matrix. We expect the spatial dependence from neighbouring countries to be stronger than the dependence from geographical distance. Pluemper and Neumayer (2010) use 1/lnd = (lnd)-1 in the weighting matrix, which gives more distant units a relatively higher weight, where d is distance in kilometres between countries. The coefficient of the spatial lag is negative and statistically significant. This seems an intuitive result. The negative coefficient on the spatial lag may actually suggest, interestingly, that higher taxes in other countries with respect to geographical distance, particularly more proximate or neighbouring countries, reduce the domestic capital tax rate. In sum, the substantive results remain unchanged regardless of the functional form used in the weighting matrix.
6.
Conclusions
message delivered from the reported empirical results is as follows. When capital is fully mobile, strong state capacity allows governments to shift their tax burden away from capital to other forms of revenue sources to avoid the capital outflows that occur in response to tax cuts in competitor countries.
The aforementioned findings have major policy implications for developing countries to cushion their economies from the vagaries of internationalization of capital markets. Clearly, the failure to recognize the importance of the interaction between state capacity and capital mobility could lead to capital outflow hindering the national investment. Lastly, there is sufficient evidence to suggest that future empirical work on taxation needs to allow for state capacity, which is still all too rare in the literature.
References
Acemoglu, D. (2006). A Simple Model of Inefficient Institutions. Scandinavian Journal of Economics, 108, 515-546.
--- (2005). Politics and Economics in Weak and Strong States. Journal of Monetary Economics, 52, 1199–1226.
Arbetman-Rabinowitz, M., & Kugler, J. (1997). Political Capacity and Economic Behavior. Boulder: Westview Press.
Arbetman-Rabinowitz, M., & Johnson, K. (2007). Relative Political Capacity. Empirical and Theoretical Underpinnings. Claremont, CA.
Basinger, S. J., & Hallerberg, M. (2004). Remodelling the Competition for Capital: How Domestic Politics Erases the Race to the Bottom. American Political Science Review, 98 (2), 261-276.
Beck, N., Gleditsch, K. S., & Beardsley, K. (2006). Space is more than Geography: Using Spatial Econometrics in the Study of Political Economy. International Studies Quarterly, 50, 27–44.
Besley, T., & Persson, T. (2010). State Capacity, Conflict, and Development. Econometrica, 78 (1), 1-34.
Bretschger, L., & Hettich, F. (2002). Globalisation, Capital Mobility and Tax Competition: Theory and Evidence for OECD Countries. European Journal of Political Economy, 18, 695–716.
Bucovetsky, S. (1991). Asymmetric Tax Competition. Journal of Urban Economics, 30, 67 – 181.
Campbell, J. L. (1993). The State and Fiscal Sociology. Annual Review of Sociology, 19, 163–185.
Cao, X. (2010). Networks As Channels of Policy Diffusion: Explaining Worldwide Changes in Capital Taxation, 1998-2006. International Studies Quarterly, 54 (3), 823–854.
Cheibub, J. A. (1998). Political Regimes and the Extractive Capacity of Governments: Taxation in Democracies and Dictatorships. World Politics, 50 (3), 349–376.
Dehejia, V. H., & Genschel, P. (1999). Tax Competition in the European Union. Politics and Society, 27 (3), 403–30.
Ehrhardt-Martinez, K. E., Crenshaw, J. C., & Jenkins (2002). Deforestation and the Environmental Kuznets Curve: A Cross-National Investigation of Intervening Mechanisms. Social Science Quarterly, 83, 226-243.
Elhorst, J. (2001). Dynamic Models in Space and Time. Geographical Analysis, 32, 119-140.
Franzese, R., & Hays, J. (2008). Interdependence in Comparative Politics: Substance, Theory, Empirics, Substance. Comparative Political Studies, 41 (4/5), 742–80.
--- (2007). Spatial-Econometric Models of Cross-Sectional Interdependence in Political-Science Panel and Time-Series-Cross-Section Data. Political Analysis, 15 (2), 140–164.
Franzese, R., Hays, J., & Schaffer, L. (2010). Spatial, Temporal, and Spatiotemporal Autoregressive Probit Models of Binary Outcomes: Estimation, Interpretation, and Presentation. APSA 2010 Annual Meeting Paper.
Garrett, G., & Mitchell, D. (2001). Globalization, Government Spending and Taxation in the OECD. European Journal of Political Research, 39, 145–177.
Hays, J. (2003). Globalization and Capital Taxation in Consensus and Majoritarian Democracies. World Politics, 56 (1), 79-113.
--- (2009). Globalization, Domestic Institutions and the New Politics of Embedded Liberalism. Oxford, Oxford University Press.
Janicke, M. (1997). The Political System’s Capacity for Environmental Policy. In M. Janicke and H. Weidner (Eds.). National Environmental Policies. New York: Springer, 1-24.
Jensen, N., & Lindstädt, R. (2011). Leaning Right and Learning from the Left: Diffusion of Corporate Tax Policy Across Borders. Comparative Political Studies, 45 (3), 283–311.
Pluemper, T., & Neumayer, E. (2010). Model Specification in the Analysis of Spatial Dependence. European Journal of Political Research, 49 (3), 418-442.
Pluemper, T., Troeger, V. E., & Manow, P. (2005). Panel Data Analysis in Comparative Politics: Linking Method to Theory. European Journal of Political Research, 44, 327–354.
Pluemper, T., Troeger, V. E., & Winner, H. (2009). Why is There No Race to the Bottom in Capital Taxation?. International Studies Quarterly, 53, 761–786.
Quinn, D. (1997). The Correlates of Change in International Financial Regulation. American Political Science Review, 91 (3), 531-551.
Scharpf, F. W. (1997). Economic Integration, Democracy, and the Welfare State. Journal of European Public Policy, 4, 8-36.
Schwartz, J. (2003). The Impact of State Capacity on Enforcement of Environmental Policies: The Case of China. Journal of Environment & Development, 12(1), 50-81.
Skocpol, T. (1985). Bringing the State Back In: Strategies of Analysis in Current Research, in Peter B. Evans, Dietrich Rueschemeyer, and Theda Skocpol, Eds., Bringing the State Back In. Cambridge: Cambridge University Press.
Swank, D. (2002). Global Capital, Political Institutions, and Policy Change in Developed Welfare States. Cambridge: Cambridge University Press.
--- (1998). Funding the Welfare State: Globalization and the Taxation of Business in Advanced Market Economies. Political Studies, 46 (4), 671-692.
Thies, C. G. (2010). Of Rulers, Rebels, and Revenue: State Capacity, Civil War Onset, and Primary Commodities, Journal of Peace Research, 47(3), 321-332.
Tilly, C. (1985). Warmaking and State Making as Organized Crimes, in Evans, Peter, Rueschemeyer, Dietrich, and Theda Skocpol (Eds.) Bringing the State Back In. Cambridge: Cambridge University Press.
Van de Walle, N. (2001). African Economies and the Politics of Permanent Crisis, 1979-1999. New York, Cambridge University Press
Ward, H., & Cao, X. (2012). Domestic and International Influences on Green Taxation. Comparative Political Studies, 45(9): 1075–1103.
Ward, H., & Cao, X.,& Mukherjee, B. (2014). State Capacity and the Environmental Investment Gap in Authoritarian States. Comparative Political Studies, 1-35.
Wilson, J. (1991). Tax Competition with Interregional Differences in Factor Endowments. Regional Science and Urban Economics, 21, 423–452.
Winner, H. (2005). Has Tax Competition Emerged in OECD Countries? Evidence from Panel Data. International Tax and Public Finance, 12 (5), 667-687.