DEMOGRAPHIC RESEARCH
VOLUME 30, ARTICLE 5, PAGES 151-186
PUBLISHED 21 JANUARY 2014
http://www.demographic-research.org/Volumes/Vol30/5/ DOI: 10.4054/DemRes.2014.30.5
Research Article
Structural and diffusion effects in the Dutch
fertility transition, 1870-1940
Hilde Bras
This publication is part of the Special Collection on “Socioeconomic status and fertility before, during and after the demographic transition”, organized by Guest Editors Martin Dribe, Michel Oris, and Lucia Pozzi.
© 2014 Hilde Bras.
This open-access work is published under the terms of the Creative Commons Attribution NonCommercial License 2.0 Germany, which permits use, reproduction & distribution in any medium for non-commercial purposes, provided the original author(s) and source are given credit.
1 Introduction 152
2 Background 153
2.1 Structural and diffusion effects 153
2.2 Industrialization and shifting patterns of sociability in the Netherlands
156
2.3 Hypotheses 160
3 Data, measures, and methods 161
3.1 Data and setting 161
3.2 Measures 164
3.3 Methods 168
4 Results 169
4.1 Starting, spacing, and stopping during the Dutch fertility transition 169 4.2 Occupational and social network effects on age at last birth and net
family size
172
5 Conclusions 177
6 Acknowledgments 179
Structural and diffusion effects in the Dutch fertility transition,
1870-1940
Hilde Bras1
Abstract
BACKGROUND
Ever since the Princeton European Fertility Project, structural and diffusion effects on fertility behavior have been juxtaposed. However, we still hardly know what the relative effects were of shifting socio-economic conditions and shifts in sociability in explaining the historical fertility decline.
OBJECTIVE
To what extent and how did structural and diffusion effects play a role in the adoption of fertility control in the Dutch historical fertility transition?
METHODS
A national data set was used with more than 3,000 maternity histories of married Dutch women aged 15-50, whose reproductive careers took place between 1870 and 1940. Apart from husbands‟ occupations, characteristics of the set of couples‟ marriage witnesses were included to measure their social networks. Cox regression analyses of age at last birth and negative binomial regressions of net family size were conducted.
RESULTS
Results indicate that unskilled laborers and farm laborers were laggards in the practice of fertility control during the Dutch fertility transition. Besides SES differentials, differences in couples‟ social networks were important in explaining fertility behavior. Those who had networks consisting of lateral kin, age peers, and people of urban background stopped childbearing earlier and had smaller families than other couples did. Particularly the presence of lateral kin of the bride and of female witnesses was strongly associated with smaller family size.
CONCLUSIONS
The evidence lends support for so-called „blended diffusion models‟ and suggests that the fertility transition must be understood as much from the viewpoint of changed
1
benefit calculations related to structural changes, as from shifting patterns of sociability associated with the decline of patriarchy and the increasing lateralization and age homophily of people‟s social networks.
1. Introduction
Economic development, changes in the occupational structure, and educational transformation are central elements in structural explanations of the demographic transition (Davis 1945; Notestein 1953; Thompson 1929). Innovation diffusion explanations, on the other hand, have emphasized the cascading spread of novel attitudes and reproductive practices through social interactions and social networks (Bocquet-Appel and Jacobi 1998; Bongaarts and Watkins 1996; Cleland and Wilson 1987; Kohler 2001). Increasingly, structural and diffusion explanations are seen as complementary, with diffusion theory adding independent elements to an enlarged theory of fertility decline, in so-called „blended diffusion models‟ (Cleland 2001). Under the blended theory the engine of demographic change is the structural transformation and diffusion is the lubricant. Such blended models, such as Casterline‟s (2001) „social effects model‟, posit structural causes alongside indicators of social networks.
However, we still hardly know what the relative effects of shifting socio-economic conditions and changes in sociability were in the historical fertility transition in Europe. Particularly the influence of social networks has been hard to measure empirically, at least for the historical transition. Moreover, there are reasons to believe that structural and diffusion effects may not simply be regarded as independent additive factors, but that they influenced each other and fertility behavior in more complex ways. First of all, the influence of structural characteristics such as social class, occupation, and education on fertility behavior may in fact not be direct, but indirect, i.e., mediated by social networks. The recurrent finding that the elite and middle classes were the forerunners in the process of adoption of fertility control may not only be due to the structural changes with which these groups were confronted, but perhaps primarily by their access to channels of communication that allowed them to learn novel attitudes, preferences, or practices earlier than other social classes did. In addition, the relative importance and interdependence between structural and social effects may have changed over time with different phases of the fertility transition.
ways. First, we try to find out to what extent SES differences in fertility control in consecutive phases of the Dutch historical fertility transition were actually independent effects or, alternatively, whether they can be explained by differences in social networks. Secondly, we investigate the influence of social networks with an eye on uncovering how diffusion took place, i.e., via what mechanisms? Finally, we connect structural and diffusion effects to broader structural and cultural shifts and developments, thereby addressing the question of why the fertility transition took place.
We base our analysis on the Historical Sample of the Netherlands, from which we reconstructed individual-level longitudinal maternity histories of married women aged 1550 for the period 18701940. Our analytical sample includes more than 3,000 couples. We explore fertility differentials according to socio-economic group as indicated by the husband‟s occupation, as well as by variables that capture attributes of the couples‟ social networks. The set of couples‟ witnesses at marriage gives information on the size, relationships, age composition, occupational heterogeneity, geographical spread, and rural-urban composition of their social networks. Cox regression analysis was used to estimate the relative risks of stopping behavior (age at last birth) and negative binomial regression to assess net family size.
In the remainder of this paper we first elaborate on structural and diffusion explanations of fertility decline and the state of the art of empirical research in the field. Next, we sketch the most important structural and social changes taking place in the Netherlands during the period 18701940 and derive a set of testable hypotheses. Subsequently, our data, measures, and methods are described. We start by presenting general parameters of starting, spacing, and stopping behavior in the Dutch fertility transition and examine socio-economic differentials therein. Multivariate models, including a full set of control variables, are then estimated and presented. In the conclusion and discussion our results are summarized and interpreted by connecting the historical fertility transition to socio-economic change and cultural shifts in sociability.
2. Background
2.1 Structural and diffusion effects
educational levels, cost-benefit calculations concerning the demand for children would have changed, resulting in couples increasingly opting for fewer children (quality-quantity trade-off). Hence, from a structural perspective, altered fertility behavior is envisaged as adaptation to changed economic and social circumstances (Carlsson 1966; Woods 1984).
Several empirical studies on the basis of aggregate (regional or community level) data have found an association between the level of economic development and the adoption of fertility control (Brown and Guinnane 2002, 2007; Dribe 2008; Galloway, Hammel and Lee 1994; Richards 1977; Schultz 1985). In individual-level studies, however, in which socio-economic status is measured by variables such as social class, occupational group, wealth, income, literacy, and/or educational level, results have been equivocal. „Intermediate‟ structural explanations, which can be found, for instance, in the work of Szreter (1996), Garrett et al. (2001), and Atkinson (2010), have stressed the importance of differing discourses across social class and regional lines. In these studies a bridge is made between individual-level indicators such as social class and local or regional opportunity structures. Drawing on the concept of „communication communities‟ (Szreter 1996) local and regional discourses, norms, and practices around fertility are stressed, but personal social networks are not explicitly operationalized.
Innovation diffusion explanations of fertility behavior, on the other hand, posit that new behavior is adopted by individuals irrespective of their socio-economic position, even among those whose socio-economic position is hypothetically associated with cost-benefit calculations that do not necessarily require the new behavior (Palloni 2001: 68). Although it is not always clear what exactly is diffused - novel attitudes towards family life (Aries 1980; Caldwell 1982), altered ideational preferences (Lesthaeghe 1983), or new contraceptive practices (Knodel 1977; Knodel and Van de Walle 1979) - diffusion is thought to take place through social interactions and social networks (Bongaarts and Watkins 1996; Watkins 1990). In the diffusion literature two main mechanisms through which „others‟ influence individuals‟ decision-making are usually discerned: social learning and social pressure.
age-homophilous networks, but also testifies to the effectiveness of homophilous networks in influencing behavior (McPherson et al. 2001). Siblings form a special sub-category of age peers. Because of their position as same-age kin and their role as consociates over the life course, siblings are important role models, influencing reproductive preferences and behavior via processes of social learning (Axinn, Clarkberg, and Thornton 1994; Balbo and Mills 2012; Lyngstad and Prskawetz 2010).
One can speak of social pressure when the balance of costs and benefits of a certain behavior is altered because others impose rewards or sanctions on certain behaviors or attitudes (Bernardi 2003: 535). Social pressure is associated with power differences. According to Casterline (2002: 23), in all societies “individuals make some decisions under orders from others. The orders may be issued in personal relationships or in codified rules that are enforced through institutionalized power. This applies to reproductive outcomes as well. Marriages can be arranged, and contraception be prohibited”. In many cases such positions of authority will be covered by people‟s parents, as they often control the family‟s resources (Bernardi 2003: 537) or provide help in situations of crisis (Baas 2008: 153). However, the extent and nature of parental authority has changed considerably over time. Significant in this respect is the decline of patriarchy, i.e., the decrease of power of the male household head over his wife and children, since the second half of the nineteenth century (Folbre 1983; Gruber and Szoltysek 2012; Ruggles 2012; Therborn 2004). This is not to say that parental social pressure has disappeared; parents still have an impact on their children‟s behavior, usually in the form of implicit contracts (Hagestad 2003), while also affecting their children‟s reproductive attitudes and behavior (Bernardi 2003).
Apart from social influence, premises on the cohesion and composition of social networks are also often invoked in diffusion models of fertility behavior. One of the most applied hypotheses in this respect is Granovetter‟s (1973) notion of „the strength of weak ties‟, i.e., that individuals learn most about novel attitudes or practices when they are embedded in heterogeneous networks containing weak ties to distant others, as opposed to homogeneous networks composed of people that are more or less similar.
still hardly know which individuals or groups were relevant in terms of the diffusion of attitudes or practices of reproductive behavior.
Increasingly, diffusion processes and social networks are seen as vital elements of an enlarged theory of fertility decline, operationalized in „blended diffusion models‟ (Cleland 2002). Under the blended theory, the engine of demographic change is the structural transformation and diffusion is the lubricant. Early adopters are thought to be more cosmopolitan, urban, and educated, but adoption and reduced fertility spreads to other sectors, largely through interpersonal communication networks (Cleland 2002: 45). However, the additive formulation of such a blended model may be too simplistic. First, network effects may not have been independent factors, adding in the explanation of fertility change, but mediators of structural effects. Moreover, as Emirbayer and Goodwin (1994) have argued, social network explanations are generally deficient in historicizing transformations in social networks and patterns of sociability. Network effects are hardly ever interpreted against the background of long-term cultural developments and changing cultural discourses. This applies to diffusion explanations in the historical fertility transition as well. The link between declining fertility and the transformation of patterns of sociability has barely been problematized, inhibiting a more informative explanation of social network effects. In the following section, therefore, both structural changes and shifts in sociability in the Netherlands during the period 1870-1940 are sketched. We then derive specific hypotheses with regard to the Dutch case.
2.2 Industrialization and shifting patterns of sociability in the Netherlands
At the beginning of the nineteenth century population growth in the Netherlands had stagnated and depression reigned: high unemployment, pauperism, and lingering industries characterized the once prosperous Dutch towns. Around 1850 excise duties on primary necessaries were abolished and wages increased, thereby raising purchasing power and the demand for industrial and agricultural products. First of all mechanization and specialization took place in the agricultural sector: farms increased in size and commercialized. Then the industrial sector started to expand. Although Dutch large-scale manufacturing only took off after 1890, a first acceleration of the growth rate could already be observed around 1850. Dutch industry was very much intertwined with agriculture and services, which were internationally oriented. Industry was based on imported sources, while foreign markets were essential for the agricultural sector (Van Zanden and Van Riel 2004).
group of skilled laborers and the large group of unskilled laborers, which became apparent in wages, living conditions, and lifestyles. The opportunity for receiving additional income from the poor law system and the low level of education and limited physical capacity of the unskilled laborers pushed wages down. Moreover, bad infrastructure and the fact that dependency allowance was only given in one‟s birthplace kept many laborers from migrating to more distant labor markets. A large number of unskilled and farm laborers still lived in with their employers. The patriarchal character of these labor relations also hampered wage rises. After 1890 real wages and purchasing power increased for a larger group of the population as a result of greater employment opportunities in the industrial sector, in particular in the ports of Amsterdam and Rotterdam and in the textile, leather, metal, and shipbuilding industries. For women, work was primarily located in urban domestic service.
Spousal relations in the nineteenth century were also patriarchal. With the codification of the Dutch Civil Law in 1838 the patriarchal element was reconfirmed. Marriage law stipulated that the husband, as head of the household, had absolute control over his family. Women had to be obedient and were seen as incapacitated, meaning that they could not carry out business transactions without the permission of their husbands. The enlightened Dutch liberal Minister of Justice said in parliament in 1900: “The character of marriage is nevertheless, in my view, incompatible with a principled equality between man and woman” (Sevenhuisen 1987:235). Under the influence of industrialization Dutch society started to modernize and as of 1870 emancipatory questions arose. Feminists started to debate the „women‟s question‟, demanding the recognition of both paid women‟s work and the unpaid work of housewives. However, the ideal of the woman as mother and (house)wife and the cult of domesticity were very much alive in Dutch society. Very few married Dutch women were gainfully employed, also in comparison to other European countries. In 1909 7% of all married Dutch women were gainfully employed, as against 49% in France, 26% in Germany, and 10% in England (Kloek 2004: 195). The male-breadwinner family dominated. Dutch women were hardly ever employed in factory work, only when absolutely necessary.
However, there are indications that in household matters Dutch women might have had more power vis-à-vis their husbands. The so-called „key power‟ in domestic matters was stipulated by law (Kloek 2009:141), and this may have applied specifically to decision-making concerning the maintenance of the family and kin network, family planning, and the education of children. It has been argued that women were central in the cultivation of the bourgeois ideal of the family. Women were the kin keepers, facilitating communication among family members, creating female-centered kin networks, and keeping track of the numerous birthdays, weddings, and family gatherings that were so central to the ideal of the family (Gillis 1996; Matthijs 2006; Maynes 2002). A recent study showed that couples with educated (literate) wives more often chose same-generation kin as their marriage witnesses (Bras 2011). Other research also suggests that women played an instrumental role in household bargaining and decision-making processes around fertility limitation (Folbre 1983). Empirical studies on Denmark and the Netherlands have shown the influence of women in the intergenerational transmission of modern reproductive behavior during the demographic transition, particularly in more liberal religious and urban contexts (Bras, Van Bavel, and Mandemakers 2013; Kohler, Rodgers and Christensen 1999). Thus, while patriarchy still dominated Dutch society, couples likely varied along a spectrum between patriarchal and more equal relations, both in their parental homes and in their own households.
and at home. Youngsters became less dependent on their fathers because they did not have to wait for the transmission of the headship of a farm, workshop, or business, but could rely on an income from wage work to carve out an existence. Unmarried women enlarged their social networks, geographical horizons, and savings through working in the urban domestic service sector. Youngsters lived in with their employers less often. Because of improved infrastructure and transportation they could commute from home to work. Moreover, compulsory schooling was more strictly imposed from the beginning of the twentieth century (in 1905 until twelve years old), taking increasingly more children away, at least for a period, from the rule of the father.
Structural change and a decline in patriarchal relations went together with shifts in youngsters‟ social networks. First of all an increased sociability among age peers could be observed, related to a broader transformation of the life phase of young adulthood (see also Bras 2011). Before the middle of the nineteenth century most youngsters spent the phase between childhood and adulthood in apprenticeships or life-cycle service. Adults controlled the entry and exit to this life phase, while youngsters remained economically semi-dependent. With industrialization and the growth of job opportunities in factories and services many working-class children started to earn their own wages, giving them more freedom from the authority of their parents. A working-class youth culture arose which included leisure time and an ethos of consumption; age peers came to constitute the social networks of youngsters (Brinkgreve and de Regt 1991; Gillis 1974; Hanawalt 1992). In bourgeois milieus, on the other hand, parental control over the marriage of offspring continued throughout the nineteenth century. Delayed inheritance and the need to be able to provide a decent living before one could marry kept youngsters under parental supervision. This did not prevent middle-class youngsters from spending more time with age peers, boys in the increasingly age-graded educational system and girls with the numerous female kin at home. Groups of siblings and cousins frequented balls and picnics and spent weekends at each other‟s houses. In this way, intimate ties between familial age peers developed (Davidoff 2005, 2012; Sanders 2002).
The rise of less instrumental and more egalitarian views on marriage and partner selection may also have reinforced a stress on age-peer relations (Coontz 2005; Van de Putte et al. 2009). A new marriage pattern developed, which included earlier and more universal marriage and a smaller spousal age gap than had been common in the West-European Marriage Pattern (Matthijs 2002). According to Van de Putte and colleagues (2009), the new marriage pattern was associated with a cultural shift by which emotionalism, sentimentalism, and romantic love, besides economic considerations, became the basis for partner choice. It might be envisaged that as people increasingly sought out age peers as their marriage partners they also selected age peers in their social networks. This became apparent, for instance, in a strong rise in the choice of brothers and cousins as witnesses at marriage and as godparents (Alfani and Gourdon 2012), at the expense of professional witnesses and patronage relations (Bras 2011; Gourdon 2008; Matthijs 2006). To what extent were these economic and cultural shifts associated with innovations in fertility behavior?
2.3 Hypotheses
Arguing from a structural explanation, we might expect that economic development and changes in the occupational structure led to increased fertility control as a result of changed cost-benefit calculations among the upper and middle classes in the industrializing Netherlands after 1870. These were the first groups to profit from the new economic opportunities that opened up in the growing secondary and tertiary sectors of the Dutch economy. They were also in the forefront of the changed „bildungsideal‟ (educational ideal) which emphasized adolescence, forerunners in the spread of literacy among women, and, in a later period, in mass entrance into the educational system. In a later stage of the transition the same developments may likely have affected the skilled laboring classes and, to a lesser extent, the lower-skilled laborers as well, instigating fertility control in these groups too. The unskilled laborers were likely laggards in the adoption of modern fertility behavior. Their situation remained unfavorable for a long time, as they did not profit from the increased economic prospects in the same way as other groups did.
the nineteenth century with its emphasis on sibling and cousin sociability (Davidoff 2012; Sabean et al. 2007), siblings (in-law) and cousins and horizontal intragenerational ties likely played a salient role in people‟s social networks. Contemporary research has shown that age-homophilous networks promote social learning and diffusion of innovation (Bernardi 2003; McPherson et al. 2001). Furthermore, given the historical decline of patriarchy during the same period (Ruggles 2012; Therborn 2004) and the concomitant decrease of social pressure from parents (i.e., fathers) on children, the opportunities for social learning via siblings, cousins, and other age peers likely increased, accelerating this process. Therefore, we expect that individuals with networks composed of relatively more lateral kin and age peers would have had better chances for social learning about fertility innovations, and may therefore have adopted norms, values, and practices of family limitation earlier than couples with networks composed primarily of vertical intergenerational ties. Furthermore, we might expect this to hold particularly for couples with lateral kin witnesses chosen by the bride, given the instrumental role of women in family networks and in the demographic transition. Moreover, with patriarchal power decreasing in the household as well, the bargaining power of women in reproductive decision-making may have become stronger over time. Following network theory, and specifically Granovetter‟s (1973) notion of „the strength of weak ties‟, we also expect that couples with more heterogeneous networks, i.e., with connections to people from different places and of diverse occupations, were likely precursors in the fertility transition because of their better chances of coming into contact with fresh ideas and techniques of reproductive behavior.
We expect that in the early stages of the fertility transition structural characteristics were (partly) mediatedby social network characteristics. The forerunning groups were not only the most urban and educated people, who encountered new economic conditions, but at the same time the groups with the most innovative social networks, which brought them into contact with the most novel ideas and practices. In a later stage of the transition both structural and network influences may have been equally important in explaining the adoption of fertility control.
3. Data, measures, and methods
3.1 Data and setting
sample of all Dutch men and women (hereafter Research Persons) born between 1812 and 1922 (Mandemakers 2006).
The most important source for reconstructing the life courses was the Dutch population register, which was initiated in 1850. A „dynamic‟ population register developed out of the censuses of the first half of the nineteenth century. In 1828 a Royal Decree stipulated that municipalities should organize the first general census; in 1839 and 1849 two more general censuses were held. These censuses were ten-yearly snapshots of the municipal population. As of January 1, 1850, however, municipalities started to update the information of the last general census on a dynamic, continuous basis. The registers were kept up by the clerks of the civil registers. In the Royal Decree of 1861 new regulations were set. The population registers were to be maintained by civil servants hired specifically for the task. Furthermore, an obligation was imposed upon the population to report changes and events that were vital for keeping up the registers, and municipal regulations were substituted by rules that were generally applicable for the whole Kingdom of the Netherlands. Every ten years the information was updated based on the decennial census (usually in the year after the census was constructed). Further changes could only take place after submission of a certificate. The system only worked well when all parties complied with the rules and the municipalities correctly copied the information in the register, which was not always the case (Knotter and Meijer 1995:8284; Vulsma 1988: 73-75).
In the population registers, information is available on date and place of birth, relation to the head of the household, sex, marital status, occupation, and religion, for each individual in a household. The starting point of the first registers was the census of 1849, the returns of which were copied into the population register. All changes occurring in the household were mentioned in the register. New household members that arrived after the registration had started were added to the list of individuals already recorded, and those moving out by death or migration were deleted with reference to place and date of migration or date of death. This means that families and individuals can, in principle, be traced on a day-by-day basis over a long period of time. The decennial censuses were used to update the system.
The reproductive careers were linked to the couples‟ marriage certificates. In a marriage record, information on occupation, age, birthplace, place of residence, and literacy of the bride and groom, their parents, and a set of two to four witnesses are included. The Napoleonic code and the initial Dutch civil code stipulated that four witnesses were needed in order to contract a marriage. This changed by law in 1913 when at least two witnesses became obligatory. Women were not allowed to act as a marriage witness until 1927 (Vulsma 1988: 51).
The HSN in principle covers the whole country including rural and urban places and Research Persons from different social classes and religious denominations. However, to date the HSN dataset is not complete and the data set used has several restrictions (see also Van Poppel et al. 2012: 309310). The first one is that the earliest cohort of women for whom we have data was born in 1850. These women started reproducing only after 1870, the start year of our period of observation. Data for the 1870s will thus mostly consist of reproductive histories of women that started childbearing at an early age. This will cause a downward bias in ages of first childbirth and an upward bias in children ever born for couples reproducing in the pre-transition period, here defined as the period 18701890.
Secondly, data for all birth cohorts has only been entered for three of the eleven Dutch provinces (and for the city of Rotterdam), whereas information for all of the eleven provinces is only available as of birth cohort 1883 onwards. Thus, the provinces of Zeeland, Utrecht, and Friesland, for which data on all cohorts are fully available and which had a relatively early fertility decline, dominate the data set. For the mainly Catholic southern and the eastern provinces, which experienced a later than average fertility decline, less data is available. By combining the data the time trend is distorted and the decline is slightly underestimated. However, as we are mainly interested in how structural versus network characteristics affect stopping behavior and net family size, and not in fertility levels, this is not a major problem.
Thirdly, related to the above problem, marriage records are not available (yet) for all couples in the database. The amount of marriage data is again different for each of the periods and regions and depends on the current state and logistics of the HSN database. In general, the percentage of marriage certificates is higher for the three provinces of Zeeland, Utrecht, and Friesland, and particularly for the city of Rotterdam, which gives the analytical sample an urban bias and explains why the percentage of farmers is small.
Figure 1: General marital fertility (number of births per 1,000 women of age 1545) in the Netherlands, 18301960
Source: Based on E. Hofstee (1981). Korte demografische geschiedenis van Nederland van 1800 tot heden. Haarlem: p. 132.
3.2 Measures
In the descriptive analyses we examine starting, spacing, and stopping behavior by period and socio-economic group. In the multivariate analyses the dependent variables are the age at stopping and net family size. A series of indicators was constructed to operationalize the different explanations. First, the occupation of the bridegroom was taken as an indicator of the structural explanation, predicting the forerunning role of particularly the upper and middle classes. The social class of the marriage couple was charted on the basis of the occupation of the groom given in the marriage record. We coded all occupations by a coding scheme named the Historical International Standard Classification of Occupations (HISCO) (Van Leeuwen et al. 2002). The occupational categories were further classified into an abridged version of a historical social class scheme proposed by Van Leeuwen and Maas (2010, 2011), known as HISCLASS. The following seven categories were employed in the analyses: higher managers and professionals, lower managers and professionals combined with clerical and sales
100 150 200 250 300 350 400
1831-35 1851-55 1871-75 1891-95 1911-15 1931-35 1951-55
M
ar
ita
l fe
rtil
ity
people, foremen and skilled workers, farmers and fishermen, lower-skilled workers, unskilled workers, and farm workers.
Characteristics of the set of marriage witnesses were used to capture couples‟ social networks. The choice of witnesses shows with whom couples had contact or wanted to have contact and who was excluded, and what was the role of age peers and (lateral) kin in those networks. Because the selection of witnesses was in principle free, in the sense that it was not imposed by law or other regulations (except for rules regarding number and gender of witnesses in specific periods), witness networks represent chosen patterns of sociability. Although (changes in) the choice of witnesses and godparents have been studied before (see for instance Bras 2011; Gourdon 2008; Matthijs 2006), they have hardly been used to measure network effects on demographic behavior. An exception is the study by Rosental (1999), who has used marriage witnesses, albeit in a different manner, to characterize family networks and show how different types of family networks influenced migration decisions and the changes therein in nineteenth-century France. We included the number of witnesses chosen to account for institutional changes. Based on the type of relationship of the witnesses (no relation, vertical kin, lateral kin, or acquaintance) and the designated link to either the bride or the groom, as stated in the marriage record, the percentages of lateral kin of the groom and of the bride among all witnesses were calculated. We also included the average age of the witnesses and constructed a dummy variable indicating whether a female witness was present at the wedding. Furthermore, variables catching the geographical spread of the network in terms of the places of origin of the witnesses (all from the same place, one from a different place, or two or more from a different place) in relation to the marriage place of the couple, the urbanization of the places of origin of the witnesses (all from rural origin, one of urban origin, two or more of urban origin) and the occupational heterogeneity of the network in terms of the occupations of the witnesses (all same occupation as husband, one different, two or more different) were included.
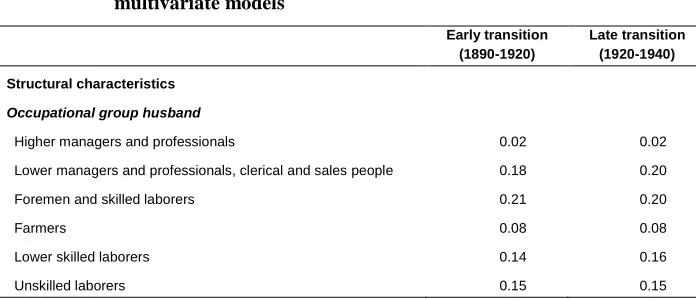
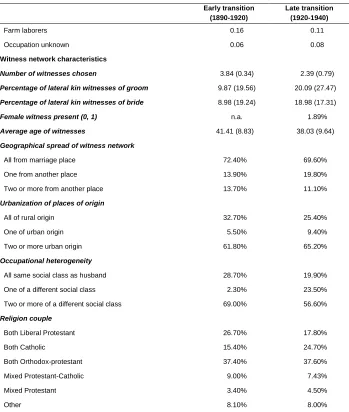
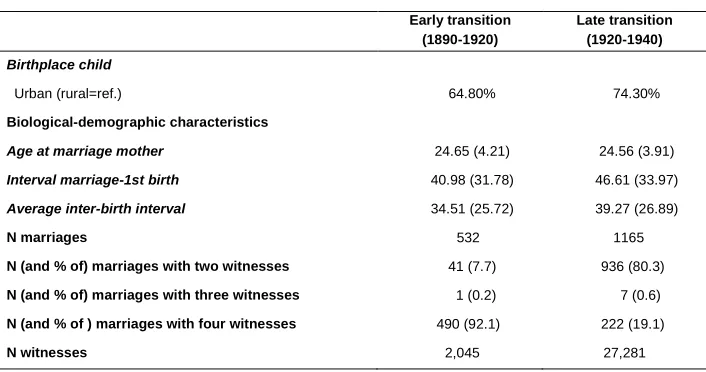
In all, we reconstructed reproductive histories for 3,119 couples. In the multivariate analyses (see 3.3.) we studied only marriages with at least two children, excluding marriages which were permanently sterile or where only one child was born. In all, we had full information for an analytical sample of 1,827 couples (period 18701890 N=130; period 18901920 N=532; period 1920-1940 N=1,165). Because of the small case numbers for the pre-transition period (1870-1890), in the multivariate analyses we only included couples reproducing during the early and late transition. Table 1 gives descriptive information about the different variables used in the multivariate models. A comparison between the periods 18901920 and 19201940 shows that the occupational structure was more or less the same in both periods. Also the percentage of farmers is strikingly low (8%). This can be explained by the fact that a large part of the data release used is from the city of Rotterdam and the rural southern and eastern provinces were only included as of birth cohorts 1883. We can also observe the effect of the changed institutional regulation of 1913 regarding the obligatory number of witnesses (from four to at least two) reflected in the data. During the period 18901920 on average 3.84 witnesses were present; during the latter period this was strongly reduced, to 2.39 witnesses on average. As the data set covers the period 18701940, primarily information on male witnesses is included (barely 2% of the witnesses during the period 19201940 being female). Over the two periods a strong rise in the percentage of lateral kin witnesses of the groom and the bride can be observed, as well as a modest decrease in the mean age of the witnesses. Over time witness networks became more urban and more occupationally heterogeneous, in the sense that witnesses less often had the same occupation as the groom.
Table 1: Means, standard deviations, and percentages of variables used in the multivariate models
Early transition (1890-1920)
Late transition (1920-1940)
Structural characteristics
Occupational group husband
Higher managers and professionals 0.02 0.02
Lower managers and professionals, clerical and sales people 0.18 0.20
Foremen and skilled laborers 0.21 0.20
Farmers 0.08 0.08
Lower skilled laborers 0.14 0.16
Table 1: (Continued)
Early transition (1890-1920)
Late transition (1920-1940)
Farm laborers 0.16 0.11
Occupation unknown 0.06 0.08
Witness network characteristics
Number of witnesses chosen 3.84 (0.34) 2.39 (0.79)
Percentage of lateral kin witnesses of groom 9.87 (19.56) 20.09 (27.47)
Percentage of lateral kin witnesses of bride 8.98 (19.24) 18.98 (17.31)
Female witness present (0, 1) n.a. 1.89%
Average age of witnesses 41.41 (8.83) 38.03 (9.64)
Geographical spread of witness network
All from marriage place 72.40% 69.60%
One from another place 13.90% 19.80%
Two or more from another place 13.70% 11.10%
Urbanization of places of origin
All of rural origin 32.70% 25.40%
One of urban origin 5.50% 9.40%
Two or more urban origin 61.80% 65.20%
Occupational heterogeneity
All same social class as husband 28.70% 19.90%
One of a different social class 2.30% 23.50%
Two or more of a different social class 69.00% 56.60%
Religion couple
Both Liberal Protestant 26.70% 17.80%
Both Catholic 15.40% 24.70%
Both Orthodox-protestant 37.40% 37.60%
Mixed Protestant-Catholic 9.00% 7.43%
Mixed Protestant 3.40% 4.50%
Table 1: (Continued)
Early transition (1890-1920)
Late transition (1920-1940)
Birthplace child
Urban (rural=ref.) 64.80% 74.30%
Biological-demographic characteristics
Age at marriage mother 24.65 (4.21) 24.56 (3.91)
Interval marriage-1st birth 40.98 (31.78) 46.61 (33.97)
Average inter-birth interval 34.51 (25.72) 39.27 (26.89)
N marriages 532 1165
N (and % of) marriages with two witnesses 41 (7.7) 936 (80.3)
N (and % of) marriages with three witnesses 1 (0.2) 7 (0.6)
N (and % of ) marriages with four witnesses 490 (92.1) 222 (19.1)
N witnesses 2,045 27,281
Source: HSN Release 2007.01.
3.3 Methods
4. Results
4.1 Starting, spacing, and stopping during the Dutch fertility transition
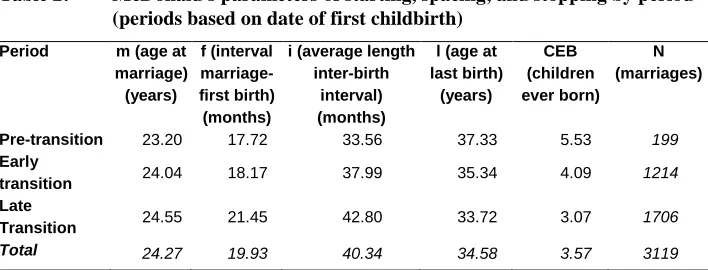
What changes in fertility behavior took place between the pre-transition period (18701890) and the late transition (19201940)? Table 1, presenting McDonald‟s (1984) parameters of starting, spacing, and stopping, shows that between the pre- and late transitions the average number of children ever born (CEB) decreased from about five and a half to three children. This decline was for the most part due to a fall in the age at last birth, which declined three and a half years from on average 37.3 years to 33.7 years. Spacing, however, also played a part in the decline, with inter-birth intervals becoming on average nine months longer and the interval of first birth increasing by almost four months. Marriage ages in the Netherlands rose from 23.2 between 1870 and 1890 to 24.6 in the period 19201940.
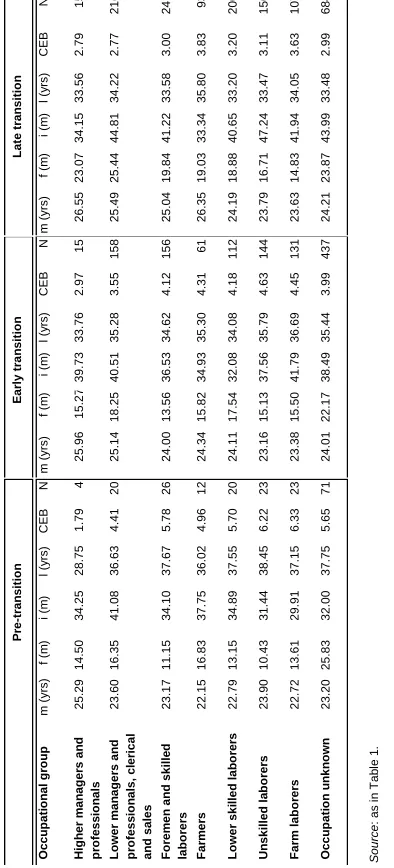
A cross-tabulation by social class (Table 2) shows that there was a social gradient in these changes in reproductive behavior. Lengthening of the first birth interval took place among all social groups, but in every period the upper and middle classes led the way and postponed the birth of their first child the most. Strikingly, while in other groups inter-birth intervals increased between the pre- and late-transition periods, among farmers they only became shorter. Conversely, spacing seemed to have been an important means of fertility control among the lower social classes, particularly among the lower-skilled, the unskilled, and farm laborers, who much more than other social groups increased inter-birth intervals as the transition unfolded. Except for the group of farmers, a process of convergence among the social classes can thus be observed in terms of spacing behavior.
We do not observe strong social class differentials for stopping behavior. In the pre-transition period the age at last birth of all social groups hovers around the average age of 37 years; in the early transition this declines to around 35 years, and in the late transition period the age at last birth drops again to somewhat less than 34 years. Only the foremen and skilled laborers and the lower-skilled laborers seem to deviate from this general trend and stop childbearing at younger ages.
Clearly, most of the innovations in reproductive behavior first took place among the upper and middle classes. However, the same developments could also be witnessed in most of the other social groups, albeit for some reproductive behaviors with a time lag. Although spacing was an important means by which the lower social classes limited their families during the transition, stopping was the most important reason for the decline in family size in The Netherlands. We saw that the trends in stopping, or age at last birth, did not strongly differ among social groups. To what extent did (other) structural characteristics of couples as well as the composition of their social networks influence the adoption of earlier stopping behavior during the transition?
Table 2: McDonald's parameters of starting, spacing, and stopping by period (periods based on date of first childbirth)
Period m (age at
marriage) (years)
f (interval marriage-first birth)
(months)
i (average length inter-birth
interval) (months)
l (age at last birth)
(years)
CEB (children ever born)
N (marriages)
Pre-transition 23.20 17.72 33.56 37.33 5.53 199
Early
transition 24.04 18.17 37.99 35.34 4.09 1214
Late
Transition 24.55 21.45 42.80 33.72 3.07 1706
Total 24.27 19.93 40.34 34.58 3.57 3119
Table 3: McDonald's parameters of starting, spacing and stopping by socio-economic group and period (of first birth)
4.2 Occupational and social network effects on age at last birth and net family size
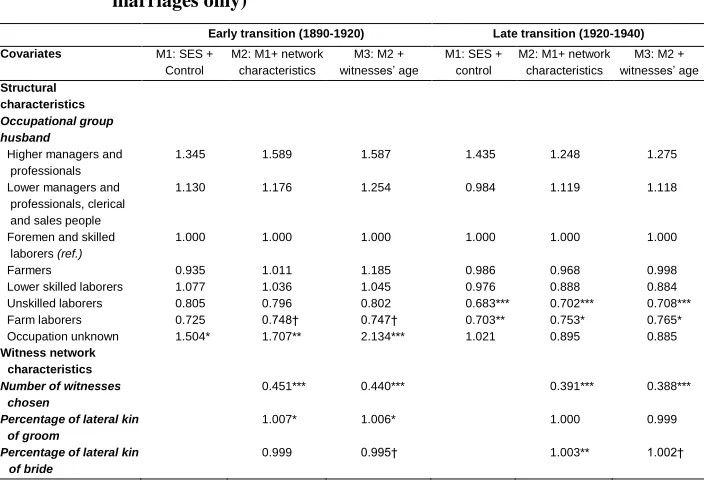
In order to assess the relative effects of structural and network characteristics, three Cox proportional hazard models of age at last birth for both the early transition (18901920) and the late transition (19201940) were estimated (Table 4). In the first model the structural characteristic (occupational group of the husband) and the control variables (religion, urban or rural birthplace, and biological-demographic characteristics) are included. The second model also contains attributes of the social networks of couples, such as those measured by the set of their marriage witnesses. The aim of this stepwise estimation is to find out to what extent both structural and social network variables influenced stopping behavior, as suggested by blended models (Casterline 2002), or whether structural effects were indeed mediatedby network influences, lending support to a more „pure‟ diffusionist explanation. Finally, in the third model the mean age of the social network members is added in order to test the hypothesis that the effect of choosing lateral kin (siblings and cousins) as network members is actually an age-peer effect.
For the early transition period (18901920) we find hardly any significant effects of occupational group on the timing of last childbirth (model 1). This corroborates the results of the descriptive analysis, where we found no strong social gradient in stopping behavior either. The Cox regression shows that only those couples where the groom‟s occupation was not known had a higher risk of stopping childbearing early. This group consisted of both the very poor (households in which the husband was unemployed) and the very rich (who did not need to work) and their motivation to stop childbearing early could result from constraint or opportunity. As far as the control variables are concerned, we observe strong effects of the markers of women‟s previous maternity history on her age at last birth. Those stopping towards the end of the early phase in the transition (19101920) stopped at younger ages, reflecting the time trend shown in Table 2.
associated with the development of smaller networks composed primarily of horizontal kin relations. Finally, as far as the control variables go, the effect of being Orthodox-protestant has a significant negative effect on age at last birth.
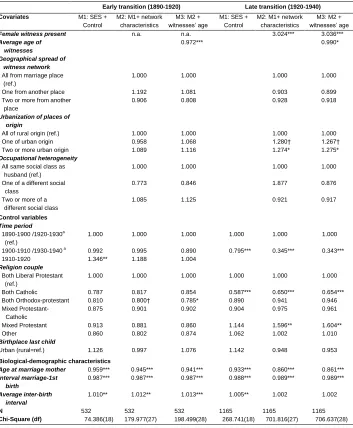
The third model includes the mean age of the witnesses. The results show that a network of relatively young witnesses is associated with modern fertility behavior. Mean witness age does not explain away the positive significant effect of the presence of the groom‟s lateral kin on age at last birth. Thus, siblings (in-law) were not necessarily the youngest network members.
During the late transition (19201940) we find more significant structural effects. Model 1 shows that unskilled laborers and farm laborers stopped childbearing later than the reference category of foremen and skilled laborers. Also interesting to note is the religious gradient in stopping behavior, which becomes apparent only this late in the transition, i.e., Catholic couples significantly delayed stopping compared to couples of liberal protestant denomination. Women who had their last child between 1920 and 1930 stopped at younger ages than women that ended childbearing between 1930 and 1940, net of other factors.
Model 2 shows that the negative effect of a husband working as an unskilled or farm laborer on stopping behavior remains even after including the network variables. Many network attributes have significant effects. Couples that had mainly brothers (in-law) in their network stopped childbearing earlier than couples that selected vertical kin, professionals, or patronage relations as witnesses. Intriguingly, it is the presence of brothers of the wife, not of the groom, that was strongly associated with modern reproductive behavior. Moreover, couples with a female witness also stopped significantly earlier, even after controlling for period. Finally, couples with urban-based networks, i.e., composed of witnesses of urban origin, had lower ages at last birth. The inclusion of the mean age of the witnesses in model 3 does not explain away the positive effect of the wife‟s lateral kin on the timing of last birth.
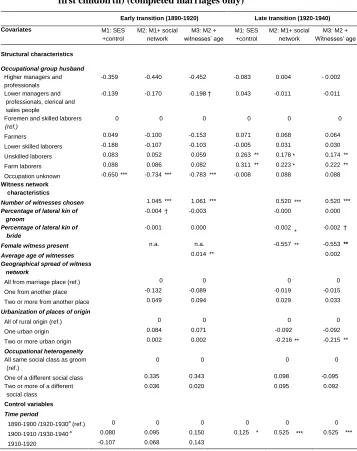
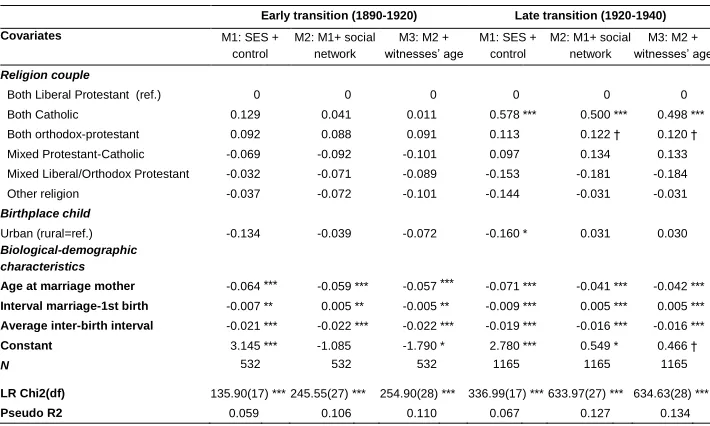
During the late transition we again find that unskilled and farm laborers, as well as Catholics, significantly lagged behind in the adoption of modern fertility behavior, having on average larger families. During the late transition it is particularly couples with restricted witness networks, which included lateral kin of the bride, female witnesses, and witnesses of urban origin, which were associated with the adoption of birth control. Entering the network variables reduces the magnitude and significance of the effects of SES on net family size. Thus, unskilled and farm laborers had less „innovative‟ witness networks. Controlling for couples‟ network attributes shows that Orthodox-protestant couples also had larger families than Liberal Protestants. By finally including the average age of witnesses in model 3 we observe that the negative influence of the bride‟s lateral kin in couples‟ networks on net family size is partly an age-peer effect.
Table 4: Cox regression analysis of age at last birth, by period (completed marriages only)
Early transition (1890-1920) Late transition (1920-1940)
Covariates M1: SES +
Control
M2: M1+ network characteristics
M3: M2 + witnesses’ age
M1: SES + control
M2: M1+ network characteristics
M3: M2 + witnesses’ age
Structural characteristics Occupational group husband
Higher managers and professionals
1.345 1.589 1.587 1.435 1.248 1.275
Lower managers and professionals, clerical and sales people
1.130 1.176 1.254 0.984 1.119 1.118
Foremen and skilled laborers (ref.)
1.000 1.000 1.000 1.000 1.000 1.000
Farmers 0.935 1.011 1.185 0.986 0.968 0.998 Lower skilled laborers 1.077 1.036 1.045 0.976 0.888 0.884 Unskilled laborers 0.805 0.796 0.802 0.683*** 0.702*** 0.708*** Farm laborers 0.725 0.748† 0.747† 0.703** 0.753* 0.765* Occupation unknown 1.504* 1.707** 2.134*** 1.021 0.895 0.885
Witness network characteristics Number of witnesses
chosen
0.451*** 0.440*** 0.391*** 0.388***
Percentage of lateral kin of groom
1.007* 1.006* 1.000 0.999
Percentage of lateral kin of bride
Table 4: (Continued)
Early transition (1890-1920) Late transition (1920-1940)
Covariates M1: SES +
Control
M2: M1+ network characteristics
M3: M2 + witnesses’ age
M1: SES + Control
M2: M1+ network characteristics
M3: M2 + witnesses’ age
Female witness present n.a. n.a. 3.024*** 3.036***
Average age of witnesses
0.972*** 0.990*
Geographical spread of witness network
All from marriage place (ref.)
1.000 1.000 1.000 1.000
One from another place 1.192 1.081 0.903 0.899 Two or more from another
place
0.906 0.808 0.928 0.918
Urbanization of places of origin
All of rural origin (ref.) 1.000 1.000 1.000 1.000 One of urban origin 0.958 1.068 1.280† 1.267† Two or more urban origin 1.089 1.116 1.274* 1.275*
Occupational heterogeneity
All same social class as husband (ref.)
1.000 1.000 1.000 1.000
One of a different social class
0.773 0.846 1.877 0.876
Two or more of a different social class
1.085 1.125 0.921 0.917
Control variables Time period
1890-1900 /1920-1930a (ref.)
1.000 1.000 1.000 1.000 1.000 1.000
1900-1910 /1930-1940 a
0.992 0.995 0.890 0.795*** 0.345*** 0.343*** 1910-1920 1.346** 1.188 1.004
Religion couple
Both Liberal Protestant (ref.)
1.000 1.000 1.000 1.000 1.000 1.000
Both Catholic 0.787 0.817 0.854 0.587*** 0.650*** 0.654*** Both Orthodox-protestant 0.810 0.800† 0.785* 0.890 0.941 0.946 Mixed Protestant-
Catholic
0.875 0.901 0.902 0.904 0.975 0.961
Mixed Protestant 0.913 0.881 0.860 1.144 1.596** 1.604** Other 0.860 0.802 0.874 1.062 1.002 1.010
Birthplace last child
Urban (rural=ref.) 1.126 0.997 1.076 1.142 0.948 0.953
Biological-demographic characteristics
Age at marriage mother 0.959*** 0.945*** 0.941*** 0.933*** 0.860*** 0.861***
Interval marriage-1st birth
0.987*** 0.987*** 0.987*** 0.988*** 0.989*** 0.989***
Average inter-birth interval
1.010** 1.012** 1.013*** 1.005** 1.002 1.002
N 532 532 532 1165 1165 1165
Chi-Square (df) 74.386(18) 179.977(27) 198.499(28) 268.741(18) 701.816(27) 706.637(28)
Source: as in Table 1.
a. Period for the models of the late transition (1920-1940)
Table 5: Negative binomial regression analysis of net family size, by period (of first childbirth) (completed marriages only)
Early transition (1890-1920) Late transition (1920-1940)
Covariates M1: SES
+control
M2: M1+ social network
M3: M2 + witnesses’ age
M1: SES +control
M2: M1+ social network
M3: M2 + Witnesses’ age
Structural characteristics
Occupational group husband
Higher managers and professionals
-0.359 -0.440 -0.452 -0.083 0.004 - 0.002
Lower managers and professionals, clerical and sales people
-0.139 -0.170 -0.198 † 0.043 -0.011 -0.011
Foremen and skilled laborers (ref.)
0 0 0 0 0 0
Farmers 0.049 -0.100 -0.153 0.071 0.068 0.064 Lower skilled laborers -0.188 -0.107 -0.103 -0.005 0.031 0.030 Unskilled laborers 0.083 0.052 0.059 0.263 ** 0.178 * 0.174 ** Farm laborers 0.088 0.086 0.082 0.311 ** 0.223 * 0.222 ** Occupation unknown -0.650 *** -0.734 *** -0.783 *** -0.008 0.088 0.088
Witness network characteristics
Number of witnesses chosen 1.045 *** 1.061 *** 0.520 *** 0.520 ***
Percentage of lateral kin of groom
-0.004 † -0.003 -0.000 0.000
Percentage of lateral kin of bride
-0.001 0.000 -0.002
* -0.002 †
Female witness present n.a. n.a. -0.557 ** -0.553 **
Average age of witnesses 0.014 ** 0.002
Geographical spread of witness network
All from marriage place (ref.) 0 0 0 0 One from another place -0.132 -0.089 -0.019 -0.015 Two or more from another place 0.049 0.094 0.029 0.033
Urbanization of places of origin
All of rural origin (ref.) 0 0 0 0 One urban origin 0.084 0.071 -0.092 -0.092 Two or more urban origin 0.002 0.002 -0.216 ** -0.215 **
Occupational heterogeneity
All same social class as groom (ref.)
0 0 0 0
One of a different social class 0.335 0.343 0.098 -0.095 Two or more of a different
social class
0.036 0.020 0.095 0.092
Control variables
Time period
1890-1900 /1920-1930a
(ref.) 0 0 0 0 0 0
1900-1910 /1930-1940 a 0.080 0.095 0.150 0.125 * 0.525 *** 0.525 ***
Table 5: (Continued)
Early transition (1890-1920) Late transition (1920-1940)
Covariates M1: SES +
control
M2: M1+ social network
M3: M2 + witnesses’ age
M1: SES + control
M2: M1+ social network
M3: M2 + witnesses’ age
Religion couple
Both Liberal Protestant (ref.) 0 0 0 0 0 0 Both Catholic 0.129 0.041 0.011 0.578 *** 0.500 *** 0.498 *** Both orthodox-protestant 0.092 0.088 0.091 0.113 0.122 † 0.120 † Mixed Protestant-Catholic -0.069 -0.092 -0.101 0.097 0.134 0.133 Mixed Liberal/Orthodox Protestant -0.032 -0.071 -0.089 -0.153 -0.181 -0.184 Other religion -0.037 -0.072 -0.101 -0.144 -0.031 -0.031
Birthplace child
Urban (rural=ref.) -0.134 -0.039 -0.072 -0.160 * 0.031 0.030
Biological-demographic characteristics
Age at marriage mother -0.064 *** -0.059 *** -0.057 *** -0.071 *** -0.041 *** -0.042 ***
Interval marriage-1st birth -0.007 ** 0.005 ** -0.005 ** -0.009 *** 0.005 *** 0.005 ***
Average inter-birth interval -0.021 *** -0.022 *** -0.022 *** -0.019 *** -0.016 *** -0.016 ***
Constant 3.145 *** -1.085 -1.790 * 2.780 *** 0.549 * 0.466 †
N 532 532 532 1165 1165 1165
LR Chi2(df) 135.90(17) *** 245.55(27) *** 254.90(28) *** 336.99(17) *** 633.97(27) *** 634.63(28) ***
Pseudo R2 0.059 0.106 0.110 0.067 0.127 0.134
Source: as in Table 1.
a
. Period for the models of the late transition (1920-1940)
* Significant at 0.05 level. ** Significant at 0.01 level. *** Significant at 0.001 level.
5. Conclusions
networks was particularly associated with modern fertility behavior. Our results thus point to the central role of women in household bargaining processes around reproduction during the historical fertility decline.
Our results show that structural and diffusion effects both played a role in the adoption of fertility control in the Dutch demographic transition. Socio-economic differences in the adoption of modern fertility behavior were partly explained away by differences in social networks. Particularly unskilled laborers and farm laborers lagged behind in the adoption of fertility control because of their less horizontal, and hence less innovative, networks. The findings thus corroborate such blended models as Casterline‟s (2002) social effects model, which posits structural causes alongside indicators of diffusion. Our results show that both influences were already important in the early phase of the demographic transition, but that structural effects were partly mediated by diffusion effects during the later phase of the transition.
Although social learning and social pressure are usually invoked as underlying mechanisms of diffusion, few studies of the historical fertility decline have been able to give them concrete substance. This study points out that both mechanisms were at play and it shows which reference groups were salient role models for social learning. Declining paternal authority - and more generally decreasing patriarchal relations between parents and children and husbands and wives - as a result of the opening up of new economic opportunities most likely led to less social pressure to adhere to the fertility norms and values of the previous generations. Moreover, the new economic possibilities for youngsters, the inception of an adolescent youth phase and youth culture, the rise of kin-based family businesses, and the development of a more egalitarian view of marriage and partner selection stimulated social learning via age peers. The quintessential age-peer reference group for late-nineteenth century youngsters consisted of siblings, siblings-in-law, and cousins – lateral kin, who were still abundant in this generation.
6. Acknowledgements
References
Alfani, G. and Gourdon, V. (2012). Entrepreneurs, formalization of social ties, and trustbuilding in Europe (fourteenth to twentieth centuries). Economic History Review 65(3): 1005–1028. doi:10.1111/j.1468-0289.2011.00614.x.
Aries, P. (1980). Two successive motivations for the declining birth rate in the West.
Population and Development Review 6(4): 645–650. doi:10.2307/1972930. Atkinson, P. (2010). Cultural causes of the nineteenth-century fertility decline: A study
of three Yorkshire towns. [PhD thesis]. Leeds: The University of Leeds, School of History.
Axinn, W.G., Clarkberg, M.E., and Thornton, A. (1994). Family influences on family size preferences. Demography 31(1): 65–79. doi:10.2307/2061908.
Baas, S. (2008). Soziale Netzwerke verschiedener Lebensformen im Längsschnitt – Kontinuität oder Wandel? In: Bien, W. and Marbach, J.H. (eds.). Familiale Beziehungen, Familienalltag und soziale Netzwerke. Wiesbaden: VS-Verlag: 148–183. doi:10.1007/978-3-531-91980-5_5.
Bernardi, L. (2003). Channels of social influence on reproduction. Population Research and Policy Review 22(5/6): 427–555.
Bernardi, L., Keim, S., and Lippe, H. (2006). Freunde, Familie und das eigene Leben: Zum Einfluss sozialer Netzwerke auf die Lebens- und Familienplanung junger Erwachsener in Lübeck und Rostock. In: Hollstein, B. and Straus, F. (eds.).
Qualitative Netzwerkanalyse – Konzepte, Methoden, Anwendungen. Wiesbaden: VS-Verlag: 359–390. doi:10.1007/978-3-531-90074-2_15.
Balbo, N. and Mills, M. (2011).The influence of the family network on the realization of fertility intentions. Vienna Yearbook of Population Research 9: 179–206. doi:10.1553/populationyearbook2011s179.
Bocquet-Appel, J.-P. and Jacobi, L. (1998). Evidence for a spatial diffusion of contraception at the onset of the fertility transition in Victorian Britain.
Population: An English Selection 10(1): 181–204.
Bras, H. (2011). Intensification of family relations? Changes in the choice of marriage witnesses in the Netherlands, 1830–1950. Tijdschrift voor Sociale en Economische Geschiedenis 8(4): 102–135.
Bras, H., Van Bavel, J., and Mandemakers, K. (2013). Unraveling the intergenerational transmission of fertility: Genetic and shared-environment effects during the demographic transition in the Netherlands, 1810–1910. The History of the Family. An International Quarterly 18(2): 116–134. doi:10.1080/1081602X. 2013.803491.
Brinkgreve, C. and de Regt, A. (1991). Adolescentie als opgave. Ontwikkelingen in een levensfase 1750-1990. In: van der Zande, I. (ed.). Het is meisjes menens. Inleiding meisjesstudies. Amersfoort and Leuven: Acco: 15–35.
Brown, J.C. and Guinnane, T.W. (2002). Fertility transition in a rural, Catholic population: Bavaria, 18801910. Population Studies 56(1): 35–50. doi:10.1080/00324720213799.
Brown, J.C. and Guinnane, T.W. (2007). Regions and time in European fertility transition: problems in the Princeton Project‟s statistical methodology. Economic History Review 60(3): 574–595. doi:10.1111/j.1468-0289.2006.00371.x.
Caldwell, J.C. (1982). Theory of fertility decline. London: Academic Press.
Carlsson, G. (1966). The decline of fertility. Innovation or adjustment process.
Population Studies 20(2): 149–174. doi:10.2307/2172980.
Casterline, J.B. (2001). Diffusion processes and fertility transition: Introduction. In: Casterline, J.B. (ed.) Diffusion processes and fertility transition: Selected perspectives. Washington, DC: National Academy Press: 1–38.
Cleland, J. (2001). Potatoes and pills: An overview of innovation-diffusion contributions to explanations of fertility decline. In: Casterline, J.B. (ed.)
Diffusion processes and fertility transition: Selected perspectives. Washington, DC: National Academy Press: 39–65.
Cleland, J. and Wilson, C.R. (1987). Demand theories of the fertility transition: An iconoclastic view. Population Studies 41(1): 5–30. doi:10.1080/003247 2031000142516.
Davidoff, L. (2005). Kinship as a categorical concept: A case-study of nineteenth-century English siblings. Journal of Social History 39(2): 411–428. doi:10.1353/jsh.2005.0132.
Davidoff, L. (2012). Thicker than water. Siblings and their relations, 1780–1920. Oxford: Oxford University Press.
Davis, K. (1945). The world demographic transition. Annals of the American Academy of Political and Social Science 237(1):1–11. doi:10.1177/000271624523700102. De Regt, A. (2004). Children in the 20th-century family economy: From co-providers
to consumers. The History of the Family. An International Quarterly 9(4): 371–384. doi:10.1016/j.hisfam.2003.01.003.
Dribe, M. (2008). Demand and supply factors in the fertility transition: A county-level analysis of age-specific marital fertility in Sweden, 1880-1930. European Review of Economic History 13(1): 65–94. doi:10.1017/S1361491608002372. Emirbayer, M. and Goodwin, J. (1994). Network analysis, culture, and the problem of
agency. American Journal of Sociology 99(6): 1411–1454. doi:10.1086/230450. Fertig, C. (2012). Familie, verwandtschaftliche Netzwerke und Klassenbildung im
ländlichen Westfalen (1750 – 1874). Stuttgart: Lucius & Lucius.
Folbre, N. (1983). Of patriarchy born: The political economy of fertility decisions.
Feminist Studies 9(2): 261–284. doi:10.2307/3177490.
Galloway, P.R., Hammel, E.A., and Lee, R.D. (1994). Fertility decline in Prussia, 1875–1910: A pooled cross-section time series analysis. Population Studies
48(1): 135–158. doi:10.1080/0032472031000147516.
Garrett, E., Reid, A., Schürer, K., and Szreter, S. (2001). Changing family size in England and Wales: Place, class and demography, 1891–1911. Cambridge: Cambridge University Press. doi:10.1017/CBO9780511495816.
Gillis, J.R. (1974). Youth and history. Tradition and change in European age relations 1770-present. New York and London: Academic Press.
Gillis, J.R. (1996). A world of their own making. Myth, ritual, and the quest for family values. Cambridge, MA: Harvard University Press.