_____________________________________________________________________________________________________
*Corresponding author: Email: [email protected];
Reliability Assessment of a Cement Industry by
Application of Weibull Method
Onoriode K. Idiapho
1*, William E. Odinikuku
2and Onomine M. Akusu
21
Department of Production Engineering, University of Benin, Nigeria.
2Department of Mechanical Engineering, Petroleum Training Institute, Warri, Nigeria.
Authors’ contributions
This work was carried out in collaboration among all authors. Author OKI designed the study, performed the statistical analysis, wrote the protocol and wrote the first draft of the manuscript. Authors WEO and OMA managed the analyses of the study. All authors read and approved the final manuscript.
Article Information
DOI: 10.9734/JERR/2019/v7i216965
Editor(s):
(1) Dr. Pijush Samui, Associate Professor, Department of Civil Engineering, NIT Patna, India and Adjunct Professor, Ton Duc Thang University, Ho Chi Minh City, Vietnam.
Reviewers:
(1) Yash Dave, India. (2)Marzena Kurpińska, Gdansk University of Technology, Poland. (3)Francisco Alves Pinheiro, Federal University of São Francisco Valley, Brazil. Complete Peer review History:http://www.sdiarticle4.com/review-history/51428
Received 12 July 2019 Accepted 16 September 2019 Published 25 September 2019
ABSTRACT
The financial cost of downtime can be very significant, especially in manufacturing industries. As a result, no business wants to experience downtime. In this study, the reliability of two identical machines code named GDA and GDB used in a cement manufacturing industry was assessed by analysis of failure times data of components in the machines by applying Weibull distribution method. The estimates of the Weibull parameters, θ and β were obtained using a reliability software tool ‘Windchill Quality Solutions 11.0 Tryout’ and the mean time to failure, failure rate and reliability of the machines was successfully determined. The result obtained showed that, the machines are undergoing rapid wear out as the values of the shape parameter obtained were greater than four. The plots of the failure rate also showed that the machines are in their wear out periods as the failure rate curves were observed to be increasing. The values of the mean time to failure of the two machines were found to be very close. The reliability of the machines was found to be increasing as their values of scale parameter, θ increases with machine GDA having the highest reliability.
Keywords: Weibull method; reliability assessment; Weibull probability plots; failure times; Windchill quality solutions.
1. INTRODUCTION
Reliability assessment for mechanical equipment is important in condition-based maintenance to lower cost and improve equipment reliability, thus, it emerges repeatedly and has become an
important research area for mechanical
equipment reliability analysis and life prediction [1]. Wang et al. [2] proved that the bounded intensity process was suitable for reliability assessment of deterioration in machine tools with frequent maintenance actions. How to assess reliability is also helpful for predictive life [3] and maintenance time [4]. Reliability engineering is a tool used to define the probability that a unit component or system will perform its intended function uninterruptedly, under a specified operational working condition over a given period of time. According to Shakuntla et al. [5] reliability analysis helps us to obtain the necessary information about the control of various parameters. Regattieri et al. [6] studied the
reliability assessment of a mechanical
component of an automatic machine for packaging using the accelerated test approach. The results confirmed that the assessment method through ALT is effective for lifetime prediction with shorter test times and for the same reason it can improve the design process of automatic packaging machines. According to Barringer and Barringer [7], reliability plays an important role in the selection of equipment for lowest long term cost of ownership. According to Okpala and Yelebe [8], machine failures in the cement industries can be predicted by the application of reliability analysis. According to Idiapho and Odinikuku [9], the reliability of base transceiver stations can be assessed using 2-parameter Weibull method. In this study, the failure times of two identical machines used in the cement industries was investigated using the Weibull distribution method and the reliability of the machines was assessed.
2. METHODOLOGY
Reliability data of two identical machines used for this study were obtained from maintenance report books in a cement manufacturing plant. The data obtained covers a period of six years and consists of failure times of components of the two machines code named machines GDA and GDB. According to O’Connor and Kleyner
[10], it is useful in engineering to determine which distribution that best fits a set of data and
to derive estimates of the distribution
parameters. The main challenge of fitting distributions to reliability data is finding the type of distribution and the values of the parameters that give the highest probability of producing the observed data. One of the most common probability density functions used in industry is the Weibull distribution. According to Lyonnet [11], the Weibull model is the most suitable when carrying out reliability analysis for mechanical components and O’ Connor and Kleyner [10] also stated that the Weibull probability analysis is the most utilized technique for processing and interpretation of life data. Weibull distribution can be applied to a large number of situations. The main advantage of using this distribution is its ability to handle small samples of failure data and its flexibility in fitting different failure modes. Small samples are common in reliability testing where tests are often destructive in nature and require costly resources. In this study, the two-parameter Weibull failure method was used to assess the reliability of the machines under study because it is more efficient and accurate when dealing with small samples of failure data Behr et al. [12].
2.1 Weibull Parameters Estimation
There are several methods for estimating the Weibull parameters from a given set of failure data. They can be classified either as manual or computational methods. Manual calculations can be performed by: (a) least square regression (LR); (b) weighted least squares regression (WLR) and; (c) a linear approach based on good linear unbiased estimators (GLUEs); while computational (computer-based) methods are: (a) the maximum likelihood estimation (MLE) and; (b) the method of moments estimation (MME).
scale parameter that influences both the mean and spread of dispersion of the distribution. As θ
increases, the reliability increases at a given point in time. The slope of the hazard
rate decreases as θ increases. The parameter θ
is also called the characteristics life and it has units identical to those of failure time t. Beta (β) is referred to as the shape parameter. Its
effect on the distribution varies for
different values are shown in Table 1.
The failure rate or hazard function is
characterized by the equation:
λ (t) = × β− 1 (1)
The Mean Time to Failure (MTTF) of 2-parameter Weibull distribution is given by:
= × Γ (1 + ) (2)
Where Γ= gamma functions
The reliability of a 2-parameter Weibull is calculated using the equation:
Reliability, ( ) = ( ) (3) Where:
= Scale parameter
= Shape parameter, also known as the
Weibull slope
= Variable time
According to (Lyonnet, 1991), the failure density function or unreliability, ( ) is given by:
( ) = 1 − ( ) (4)
3. RESULTS AND DISCUSSION
3.1 Results
Table 2 shows the failure times of components of
machines GDA and GDB ranked in
ascending order.
3.1.1 Analysis of machine GDA
The failure times of machine GDA shown in Table 2 were analyzed using the software tool PTC Windchill Quality Solutions 11.0 Tryout to obtain the 2-parameter Weibull estimates:
= 15.8344
= 1616.0623
= 0.7281
= 0.8533
Where = Coefficient of determination and
= Coefficient of correlation
Since the value of = 15.8344, it indicates increasing failure rate (IFR) or wear out period. The failure of the components in the machine is probably due to aging, fatigue, corrosion, friction and cyclical loading.
For absolute values of , 0 - 0.19 is regarded as very weak, 0.2 - 0.39 as weak, 0.40 - 0.59 as moderate, 0.6 - 0.79 as strong and 0.81 - 1 as very strong correlation.
From the above value obtained for the coefficient of correlation, = 0.85, it shows that there is strong correlation of the dataset and that the independent variable is a good predictor of the dependent variable, therefore regression is very suitable.
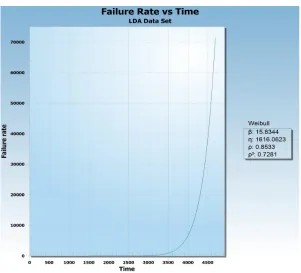
Figs. 1, 2, 3, 4 and 5 were plotted using PTC Windchill quality solutions 11.0 Tryout software. Fig. 1 shows the Weibull probability plot which is observed to be linear. Fig. 2 shows the failure rate plot of the machine which can be seen to be increasing over time. This indicates increasing failure rate (IFR) of the components of the machine which may be as a result of overloading of the machine, aging, wear and friction or fatigue. Fig. 3 shows the plot of probability density function against time.
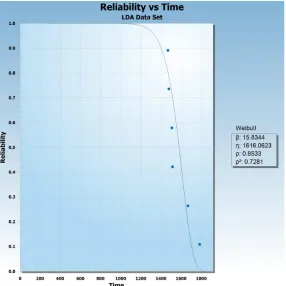
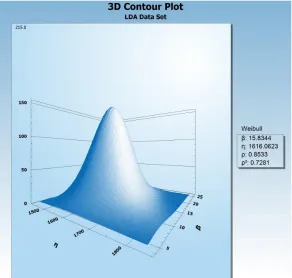
Fig. 4 shows the plot reliability against time. From Fig. 4, it can be seen that the reliability of the machine is decreasing over time. Fig. 5 shows the 3D contour plot which is used to compare the data sets.
Table 1. Types of failures corresponding to β values
β value Type of failure Meaning
β<1 infant mortality (DFR) high probability of failing at early stages β=1 random failures (CFR) failures are independent of time
Fig. 1. Weibull probability Vs time plot of machine GDA
Fig. 3. Probability density function Vs time plot of machine GDA
Fig. 5. 3D Contour plot of machine GDA
Table 2. Failure time of machines
Rank Failure time (hrs)
GDA GDB
1 1468 1300
2 1478 1318
3 1507 1412
4 1515 1497
5 1668 1555
6 1783 1802
From eqn. (2), the Mean Time to Failure (MTTF) of 2-parameter Weibull distribution is:
= × Γ (1 + )
= 1616.0623 × Γ (1 +
. )
= 1616.0623 × Γ (1.06)
Where Γ(1.06) is a gamma function obtained
from gamma standard tables to be = 0.9615
= 1616.0623 × 0.9615
= 1553.8439 ℎ (5)
From eqn. (1), the failure rate or hazard rate =
λ (t) = × β− 1
Failure rate = λ (t) = .
. ×
. .
15.8344-1
Failure rate = λ (t) = 9.7981 × 10 ×
(0.9615)14.8344
Failure rate = λ (t) = 5.4727 × 10 /ℎ (6)
From eqn. (3), Reliability, ( ) = ( )
Reliability, ( ) = .. .
Reliability, ( ) = .
Reliability, ( ) = 0.5845 (7)
From eqn. (4), ( ) = 1 − ( )
( ) = 1 − 0.5845 = 0.4155 (8)
3.1.2 Analysis of machine GDB
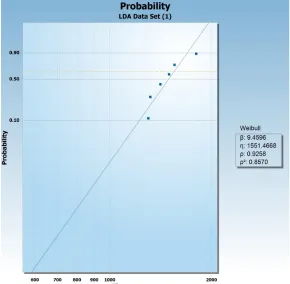
The failure times of machine GDB shown in Table 2 were analyzed using Windchill Quality Solutions 11.0 Tryout. The following Weibull parameters were obtained:
= 9.4596
= 1551.4668
The value of = 9.4596 shows that machine GDB is experiencing rapid wear out (IFR). The failure of the components in the machine is probably due to aging, fatigue, corrosion, friction and overloading.
From the above value obtained for the coefficient of correlation, =0.93, it shows there is a strong correlation of the data and that the independent variable is a good predictor of the dependent variable.
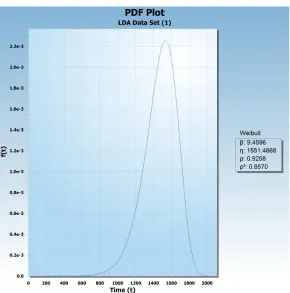
Figs. 6, 7, 8, 9 and 10 were obtained using PTC Windchill quality solutions 11.0 Tryout software. Fig. 6 shows the Weibull probability plot which is observed to be linear. Fig. 7 shows the failure rate plot of the machine which can be seen to be increasing over time. This indicates increasing failure rate (IFR) of the components of the machine which may be as a result of overloading of the machine, aging, wear and friction or fatigue. Fig. 8 shows the plot of probability density function against time.
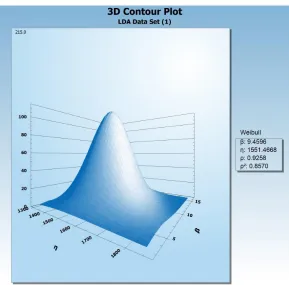
Fig. 9 shows the plot reliability against time. From Fig. 9, it can be seen that the reliability of the machine is decreasing over time. Fig. 10 shows the 3D contour plot which is used to compare the data.
The Mean Time to Failure (MTTF) of machine
GDB, = × Γ (1 + )
= 1551.4668 × Γ (1 +
. )
= 1551.4668 × Γ (1.11)
Where Γ(1.11) is a gamma function obtained
from gamma standard tables to be = 0.9420
Table 3. Weibull distribution parameters for machine GDA
β θ r
15.8344 1616.0623 0.8533
= 1551.4668 × 0.9420
= 1461.48 ℎ (9)
Failure rate or hazard rate , λ (t) = × β− 1
Failure rate = λ (t) = .
. ×
. .
9.4596-1
Failure rate = λ (t) = 6.0972 × 10 ×
(0.942)8.4596
Failure rate = λ (t) = 3.6780 × 10 /ℎ (10)
Fig. 7. Failure rate Vs time plot of machine GDB
Fig. 9. Reliability Vs time plot of machine GDB
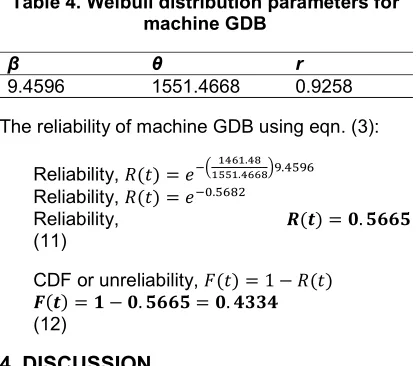
Table 4. Weibull distribution parameters for machine GDB
β θ r
9.4596 1551.4668 0.9258
The reliability of machine GDB using eqn. (3):
Reliability, ( ) =
.
. .
Reliability, ( ) = .
Reliability, ( ) = .
(11)
CDF or unreliability, ( ) = 1 − ( )
( ) = − . = .
(12)
4. DISCUSSION
The Weibull distribution parameters were
estimated using TPC Windchill Quality
Solutions 11.0 Tryout software package. Figs. 1 and 6 show the Weibull probability plots of machines GDA and GDB. From Figs. 1 and 6, it can be seen that the plots are linear. Figs. 2 and 7 show the failure rate plots of the two machines. From Figs. 2 and 7, the plots can be seen to be
increasing over time. This indicates
increasing failure rate (IFR) of the components of the machine which may be as a result of overloading of the machine, aging, wear and friction or fatigue. Figs. 3 and 8 show the plots of probability density function against time. Figs. 4 and 9 showed the plot reliability against time. It can be seen from the plots that the reliability of the machine is decreasing over time. Figs.5 and 10 show the 3d contour plots which are used to compare the data sets.
From the analysis carried out on the failure times data of machines GDA and GDB, the results obtained showed the two machines having shape
parameter = 15.8344 and 9.4596
respectively as shown in Tables 3 and 4. From literature, when > 4, the type of failure is the wear out period or increasing failure rate (IFR).
Since the value of shape parameter
estimate obtained for the two machines, β > 4, it shows that the machines are experiencing rapid wear out which may be as a result of aging, wear due to friction, corrosion, overheating due to
overload, and fatigue of the machine
components. The downtime of the machines can be reduced by preventive maintenance strategies
and parts replacement technology. From
Weibull plots, the value of correlation coefficient,
r obtained, for both machines showed that a strong positive correlation exists between the
datasets. The values of the mean time to failure (MTTF) of the two machines were found to be very close. As the mean time to failure of the machines increases, their reliability is seen to also increase. From our results for reliability in equations (7) and (11), the reliability of the two identical machines was found to be increasing as their values of scale
parameter, θ increases. Machine GDA had a
scale parameter, θ = 1616 hrs which resulted in a reliability of 0.5845 (58%) while machine GDB had the highest reliability of 0.5665 (57%) for θ = 1551 hrs.
5. CONCLUSION
The reliability assessment of two identical machines used in a cement manufacturing company has been studied. The study involves the rank-ordering of the failure time data of two machines, determination of the probability of failures of the machines, the Weibull scale parameter, θ and Weibull shape parameter, β of the machines, the mean time to failure of the machines, their failure rates and reliability of each machine.
The data obtained from two identical machines were analyzed using 2-parameter Weibull failure distribution technique. The Weibull parameters θ and β were obtained using TPC Windchill Quality Solutions 11.0 Tryout software tool. The mean time to failure, failure rate and reliability of each machine was successfully computed. The results obtained showed machine GDA having a higher reliability than machine GDB.
In this study, the failure times of two identical machines in a cement industry for a period of six years was successfully analyzed by applying 2-parameter Weibull failure distribution method and the reliability of each machine was successfully determined.
ACKNOWLEDGEMENT
The authors wish to acknowledge the efforts of Michael Etete and Jeffrey Ehibor for the success of this work.
COMPETING INTERESTS
Authors have declared that no competing interests exist.
REFERENCES
approach for a thermonuclear system. Qual. Reliab. Eng. Int. 2016;32:1677– 1691.
2. Wang ZM, Yang JG. Bounded intensity
process and its applications in reliability assessment of NC machine tools. J. Shanghai Jiaotong Univ. 2012;46,1623– 1631.
3. Zhao M, Lin J. Health assessment of
rotating machinery using a rotary encoder. IEEE Trans. Ind. Electron. 2017;65:2548– 2556.
4. Wang ZM, Yang JG, Wang GQ, Zhang
GB. Reliability assessment of multiple NC machine tools with minimal repair. J. Harbin Inst. Technol. 2011;43:127–130.
5. Shakuntlaa Sanjay K, Lala AK, Bhatiaa
SS, Jai Singh. Availability analysis of polytube industry when two sub-systems are simultaneous fail. Bangladesh Journal of Scientific and Industrial Research. 2011; 46(4):475-480.
6. Regattieri A, Piana F, Gamberi M, Galizia FG, Casto A. Reliability assessment of a
packaging automated machine by
accelerated life testing approach. Procedia Manufacturing. 2017;11:2178-2186.
7. Barringer HP, Barringer PE, Associates
Inc. Life cycle cost & reliability for process
equipment. Conference & Exhibition,
Houston, Texas. PennWell Publishing; 1997.
8. Okpala AN, Yelebe SR. Application of
reliability analysis for predicting failures in cement industry. The International Journal of Engineering and Science. 2016;5:1-7.
9. Idiapho OK, Odinikuku WE. Reliability
assessment of a base transceiver station using 2-Parameter Weibull distribution method. Journal of Engineering Research and Reports. 2018;2(4):1-15.
10. O’Connor DT, Kleyner A. Practical
reliability engineering, John Wiley and Sons,Chichester, UK, 5th edition; 2012.
11. Lyonnet P. Tools of Total Quality, An
Introduction to statistical Process Control. Chapman and Hall, London; 1991.
12. Behr RA, Karson MJ, Minor JE. Reliability analysis of window glass failure pressure data. Struct Saf. 1991;11(1):43–58.
© 2019 Idiapho et al.; This is an Open Access article distributed under the terms of the Creative Commons Attribution License (http://creativecommons.org/licenses/by/4.0), which permits unrestricted use, distribution, and reproduction in any medium, provided the original work is properly cited.
Peer-review history: