________________________________
Author for Correspondence: G. Jaya Syamala,
Sri Siddhartha Pharmacy College, Nuzvid, Ammavarithota,
Research Article
ISSN Print 2231 – 3648 Online 2231 – 3656
Available Online at: www.ijpir.com
UV spectroscopic analytical method development and validation of
Lurasidone in bulk and tablet dosage form
G. Jaya Syamala*, V.
Naresh*, M. Kishore Babu*
*
Sri Siddhartha Pharmacy College , Nuzvid,Ammavari thota, Andhra Pradesh -521 201,India.
ABSTRACT
A Simple, accurate, rapid, sensitive and precise UV Spectrophotometric method has been developed for estimation of Lurasidone in tablet dosage form using UV detector, with a mobile phase consisting of acetone and water 70:30(v/v) was used and the effluents were monitored at 324 nm. The Proposed study describes a new UV–Spectrophotometric method development and validation of Lurasidone using simple mobile phase. The method gives good correlation coefficient with in a short analysis time. The method was validated and found to be simple, sensitive, accurate and precise. Percentage recovery shows that the method is free from interference of excipients used in formulation. Therefore, the proposed method can be used for routine analysis of Lurasidone in tablet dosage form.
Keywords:
Lurasidone, Limit of Detection, Limit of Quantification, Method development and validationINTRODUCTION
Analytical research and development is a requisite part of the pharmaceutical industry whose goals include contributing to the development of new active substances and pharmaceutical dosage forms by providing information based on analytical chemistry, by developing analytical methods and specifications used in quality control of material for toxicological and clinical trials, and by subsequent transfer of these methods and specifications to operations. The development of a way for analysis of a sample should take into consideration that the analytical information is characterized with quality and reliableness [1]. Quality control could be a
thought that strives to provide an ideal invention by sequence of trails frame to forestall as well as eliminate errors at different phases of manufacture.
The quality of a drug on being analyzed ought to replicate the standards associated with efficacy, safety and efficaciousness. As always, in method development, the sample could be a crucial consideration for analytical method and instrument.
Lurasidone HCl is an atypical antipsychotic drug approved by the U.S. Food and Drug Administration (FDA) for treatment of Schizophrenia.
In the present study, an attempt was made to develop a simple and accurate UV Spectrophotometric method for the quantification
of lurasidone in bulk and pharmaceutical formulations, and further to validate the established method according to ICH Q2 (R1) guidelines.
The main objective of this study is to validate the developed method by using parameters:
Linearity Accuracy Precision Robustness Ruggedness LOD LOQ
MATERIALS AND METHODS
Methodology
Solubility studies
Solubility studies for Lurasidonewere performed by using various solvents. Phase solubility studies were performed according to the method reported by Higuchi and Connors, 1965.
The solubility of the drug was analyzed in distilled water, butyl alcohol, diethyl amine, formalin, conc.H2SO4, alcohol, benzaldehyde, tween 80, acetone. The excess amounts of drug were transferred in to 10 mL stoppered conical flasks and volume was made upto the mark with respective solvents. The mixture was shaken in thermostatic shaker bath for 24hr at 37±5 0c. The aliquots of 5 mL were withdrawn and filter through a 0.45-μm Whatman filter paper for determining drug concentration by UV spectrophotometer. As per the spectral analysis Lurasidone is soluble in acetone and water in the ratio of 70:30 and same solvent was selected as diluent for further analysis.
Method development for assay of Lurasidone
tablets
Method development for assay of Lurasidone tablets was initiated based on general method development guidelines and literature.
Preparation of Diluent
The diluent was prepared by taking acetone and water in the ratio of 70:30 and mixed well.
Preparation of solutions for Assay
Preparation of standard solution
The standard solution was prepared by accurately weighing 100.0 mg of Lurasidone (equivalent to 100 mg of lurasidone) in 100 mL volumetric flask containing 30 mL of diluent and sonicated for about 10 min, and then the volume was made up to the mark with the same diluent to get the final concentration of 1000 µg/mL. From this 10mL was pipette out into a 100 mL volumetric flask and volume was made up to the mark with diluent to get final concentration of 100 μg/mL.
Preparation of sample solution
20 tablets were weighed and average weight of tablet was determined. The tablets were crushed into a fine powder. Accurately weighed 375.0 mg of powder (equivalent to 100 mg of Lurasidone) was transferred to clean 100 mL standard volumetric flask. Add few ml of diluent and dissolve, make up the final volume with diluent. The solution is sonicated for 30 minutes and marked as sample stock solution. Pipette out 10 mL from sample stock into a clean 100mL standard volumetric flask and filtered through 0.45 µ membrane filter and make up the volume to 100 mL with diluent to get the final concentration of 100 µg/mL.
Determination of absorption maxima
Standard solution (100 µg/mL) approximately 3.0 mL was taken in cuvette and scanned from 200-400 nm with fixed slit width of 2.0 nm.
Method validation
The method was validated according to international conference on harmonization guidelines [ICH Q2 (R1)].
Specificity
Solutions of standard and sample were prepared and analyzed as per test procedure in UV Spectrophotometer.
LINEARITY
A series of solutions of standard drug substances were prepared in the concentration ranging from 15-90 µg/ml. A calibration graph is plotted between amount of concentration Vs absorbance.
The standard solution was prepared by accurately weighing 100.0 mg of Lurasidone (equivalent to 100 mg Lurasidone) in 100 mL volumetric flask containing 30 mL of diluent and sonicated for about 10 min, and then the volume was made up to the mark with the same diluent (1000 µg/mL).
From this 10 mL was pipette out into a 100 mL volumetric flask and volume was made up to the mark with diluent to get final concentration of 100 μg/mL. Aliquots of these solutions were transferred into respective volumetric flasks by using A grade bulb pipette and made up to volume with water to get final concentrations of 15-90µg/ml. The solutions were then filtered through a 0.45 µ membrane filter. Each solution was scanned three times and linearity was evaluated by linear-regression analysis.
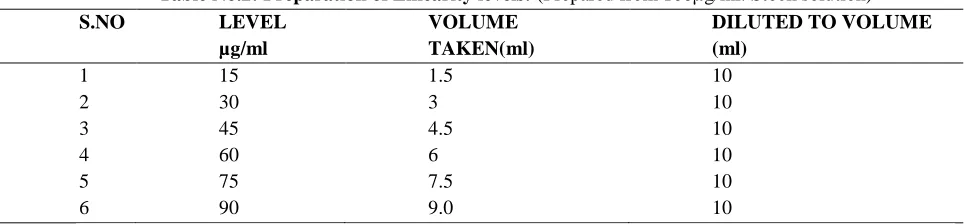
Table No.2: Preparation of Linearity levels: (Prepared from 100µg/ml. Stock solution)
S.NO LEVEL
µg/ml
VOLUME TAKEN(ml)
DILUTED TO VOLUME (ml)
1 15 1.5 10
2 30 3 10
3 45 4.5 10
4 60 6 10
5 75 7.5 10
6 90 9.0 10
Accuracy
The accuracy was carried out by adding known amounts of standard drug to the analyte (three concentrations levels - 50, 100 and 150 % - of the labelled claim). At each level, three determinations were performed and the results were recorded. The accuracy was expressed as percent analyte recovered by the proposed method.
Preparations for Accuracy levels
Accuracy Level 1 (50%)
187.5 mg of Lurasidone (equivalent to 50 mg of Lurasidone) reference standard was accurately weighed and transferred into 100 mL volumetric flask. 40ml of diluent was added and kept for sonication for about 10min. Now make up the volume upto 100ml (500µg/mL).From this solution take 10ml and transfer to 100ml volumetric flask and diluted up to the mark which produce (50µg/mL) and then filtered through 0.45 µ membrane filter.
Accuracy level 2 (100%)
375.0mg of Lurasidone (equivalent to 100mg of Lurasidone) reference standard was accurately weighed and transferred into 100 mL volumetric
flask. 40ml of diluent was added and kept for sonication for about 10min. Now make up the volume upto 100ml (1000µg/mL).From this solution take 10ml and transfer to 100ml volumetric flask and diluted up to the mark which produce (100µg/mL) and then filtered through 0.45 µ membrane filter.
Accuracy level 3 (150%)
562.5 mg of Lurasidone (equivalent to 150 mg of Lurasidone) reference standard was accurately weighed and transferred into 100 mL volumetric flask. 40ml of diluent was added and kept for sonication for about 10min. Now make up the volume upto 100ml (1500µg/mL).From this solution take 10ml and transfer to 100ml volumetric flask and diluted up to the mark which produce (150µg/mL) and then filtered through 0.45 µ membrane filter.
Precision
Precision was determined as Repeatability. System precision and Method precision was established in accordance with ICH guidelines.
The method precision was determined by analyzing the samples of Lurasidone.
System precision
The standard solution was prepared by accurately weighing 100.0mg of Lurasidone (equivalent to 100 mg Lurasidone) in 100 mL volumetric flask containing 30 mL of diluent and sonicated for about 10 min and then the volume was made up to the mark with the same diluent to get the final concentration of 1000 µg/mL. From this 10 mL was pipette out into a 100 mL volumetric flask and volume was made up to the mark with diluent to get final concentration of 100 μg/mL and analyzed six times as per test procedure.
Method precision
20 tablets were weighed and average weight of tablet was determined. The tablets were crushed into a fine powder. Accurately weighed and transferred 375.0mg of powder equivalent to 100 mg of Lurasidone was transferred to clean 100 mL standard volumetric flask. Add few ml of diluent and dissolve, make up the final volume with diluent. To get finial concentration of 1000 µg/ml. The solution is sonicated for 10 minutes and filtered through 0.45 µ membrane filter and marked as sample stock solution. Pipette out 10 ml from sample stock into a clean 100 mL standard volumetric flask and make up the volume to 100ml with diluent to get the final concentration of 100 µg/ml.
Sample preparation 1
Weigh accurately 375.0 mg of sample was transferred to clean 100 mL standard volumetric flask. Add few ml of diluent and dissolve, make up the final volume with diluent. The solution is sonicated for 10 minutes and filtered through 0.45 µ membrane filter and marked as sample stock solution. Pipette out 10 mL from sample stock into a clean 100 mL standard volumetric flask and make up the volume to 100 mL with diluent to get the final concentration of 100 µg/mL.
Sample preparation 2
Weigh accurately 375.12 mg of sample was transferred to clean 100 mL standard volumetric flask. Add few ml of diluent and dissolve, make up the final volume with diluent. The solution is
sonicated for 10 minutes and filtered through 0.45 µ membrane filter and marked as sample stock solution. Pipette out 10 mL from sample stock into a clean 100 mL standard volumetric flask and make up the volume to 100 mL with diluent to get the final concentration of 100 µg/mL.
Sample preparation 3
Weigh accurately 375.1mg of sample was transferred to clean 100 mL standard volumetric flask. Add few ml of diluent and dissolve, make up the final volume with diluent. The solution is sonicated for 10 minutes and filtered through 0.45 µ membrane filter and marked as sample stock solution. Pipette out 10 mL from sample stock into a clean 50 mL standard volumetric flask and make up the volume to 100 mL with diluent to get the final concentration of 100 µg/mL.
Sample preparation 4
Weigh accurately 375.04 mg of sample was transferred to clean 100 mL standard volumetric flask. Add few ml of diluent and dissolve, make up the final volume with diluent. The solution is sonicated for 10 minutes and filtered through 0.45 µ membrane filter and marked as sample stock solution. Pipette out 10 mL from sample stock into a clean 100 mL standard volumetric flask and make up the volume to 100 mL with diluent to get the final concentration of 100 µg/mL.
Sample preparation 5
Weigh accurately 375.06mg of sample was transferred to clean 100 mL standard volumetric flask. Add few ml of diluent and dissolve, make up the final volume with diluent. The solution is sonicated for 10 minutes and filtered through 0.45 µ membrane filter and marked as sample stock solution. Pipette out 10 mL from sample stock into a clean 100 mL standard volumetric flask and make up the volume to 100 mL with diluent to get the final concentration of 100 µg/mL.
Sample preparation 6
solution. Pipette out 10 mL from sample stock into a clean 100 mL standard volumetric flask and make up the volume to 100 mL with diluent to get the final concentration of 100 µg/mL.
Robustness
100µg/mL of stock solution was taken and from this 20ml of solution was takenin 100ml volumetric flask and diluted up to the mark which produce (20µg/mL) and then filtered through 0.45 µ membrane filter. The robustness of the drug was determined by using different analysts and Instruments and the respective values were recorded.
Ruggedness
100µg/mL of stock solution was taken and from this 20ml of solution was taken in 100ml volumetric flask and diluted up to the mark which produce (20µg/mL) and then filtered through 0.45 µ membrane filter. The ruggedness of the drug was determined by using different wavelengths and temperatures and the respective values were recorded.
Limit of Detection (LOD)
100µg/ml of stock solution was taken and from this solution 10ml was pipetted out and it is taken
into 100ml volumetric flask and make up to the mark which produce 10µg/ml solution. From this take 50ml of solution into 100ml volumetric flask and make it up to the mark, and the value of LOQ was observed at 5µg/ml.
Limit of Quantification (LOQ)
100µg/ml of stock solution was taken and from this solution 10ml was pipetted out and it is taken into 100ml volumetric flask and make up to the mark which produce 10µg/ml solution. From this take 80ml of solution into 100ml volumetric flask and make it up to the mark, and the value of LOQ was observed at 8µg/ml.
RESULTS AND DISCUSSION
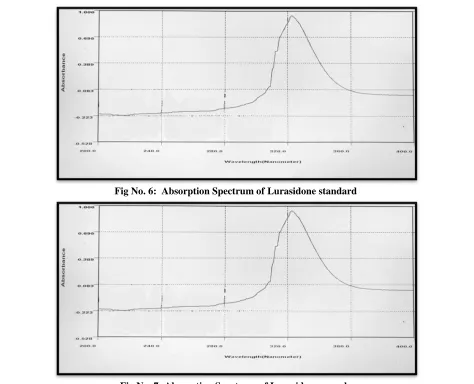
Lurasidone was analyzed using proposed UV spectrophotometric method in pharmaceutical formulation. It was soluble in acetone and water in the ratio of 70:30 after sonicated for 30 minutes and hence it was selected as the diluent for Lurasidone to obtained UV spectrum in the range of 200 -400 nm. After the evaluation of the spectrum, Lurasidone showed maximum absorption at 324 nm.
Fig No: 5 Absorption Spectrum of Lurasidone
Assay
The UV spectrophotometric method was applied to the quantification of Lurasidone in
established methods. The validated method could be useful for quality control of Lurasidone in pharmaceutical formulations.
Acceptance criteria
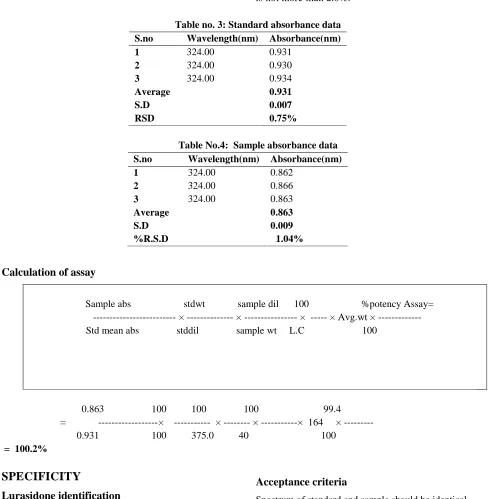
RSD for the absorbance of the standard solution is not more than 2.0%.
Table no. 3: Standard absorbance data S.no Wavelength(nm) Absorbance(nm)
1 324.00 0.931
2 324.00 0.930
3 324.00 0.934
Average 0.931
S.D 0.007
RSD 0.75%
Table No.4: Sample absorbance data S.no Wavelength(nm) Absorbance(nm)
1 324.00 0.862
2 324.00 0.866
3 324.00 0.863
Average 0.863
S.D 0.009
%R.S.D 1.04%
Calculation of assay
Sample abs stdwt sample dil 100 %potency Assay= --- × --- × --- × --- × Avg.wt × --- Std mean abs stddil sample wt L.C 100
0.863 100 100 100 99.4 = ---× --- × --- × ---× 164 × --- 0.931 100 375.0 40 100
= 100.2%
SPECIFICITY
Lurasidone identification
Solutions of Standard and Sample were prepared as per the test method and analysed in the spectrophotometric system.
Acceptance criteria
Fig No. 6: Absorption Spectrum of Lurasidone standard
Fig No. 7: Absorption Spectrum of Lurasidone sample
The spectrums of standard and sample were identical with nearly same hence it is concluded that the standard and sample are same.
Blank Interference
Diluent was prepared as per the test method and analyzed in Spectrophotometric system.
Acceptance criteria
Spectrum of blank should not show any interference with of analyte. There is no interference at the wavelength of analyte which indicates that the method is specific.
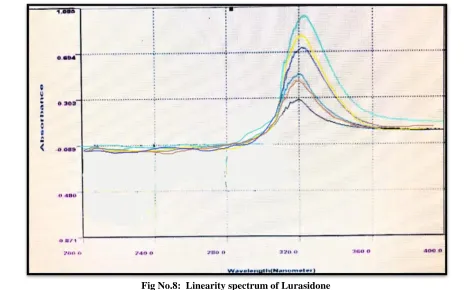
Linearity
Fig No.8: Linearity spectrum of Lurasidone
Acceptance criteria
Correlation coefficient should be not less than 0.9995% and %RSD for should be not more than 2
Table No.5: Linearity Results
S.no Concentration(µg/mL) Absorbance(nm)
1 15 0.298
2 30 0.425
3 45 0.561
4 60 0.724
5 75 0.869
Fig No: 9: Calibration curve of Lurasidone (15-90µg/mL)
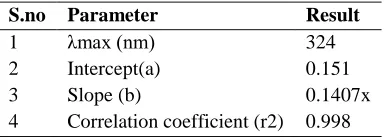
Table No: 6: Linearity Data of Lurasidone
S.no Parameter Result
1 λmax (nm) 324
2 Intercept(a) 0.151
3 Slope (b) 0.1407x
4 Correlation coefficient (r2) 0.998
With increase in the concentration, absorbance is increasing linearly, hence the method had linearity range from 15 – 90 µg/ml.
Accuracy
The accuracy of the method was evaluated through the recovery studies. Recovery studies
were carried out by addition of known quantity of pure drug to pre-analyzed sample at three different concentration levels (50, 100 and 150%). The percentage recovery values were found to be 99.8-100.32 with %RSD of <1% which indicates that the proposed method was accurate.
Table No: 7: Accuracy Results of Lurasidone (standard addition method) S.No. Spiked level absorbance % recovery S.D %RSD % mean recovery
1. 50%
0.47 99.8%
0.002 0.35 99.8%
0.45 99.9%
0.46 99.7%
2. 100%
0.90 100 .04%
0.003 0.41 100.04%
0.93 100.06%
0.91 100.08%
3. 150%
1.28 100.42%
0.002 0.44 100.42%
1.32 100.41%
1.29 100.43%
From the accuracy tables it was found that recovery value of pure drug was in the range 99 - 102%, which indicates that the method is accurate
Fig.no.10: 50% accuracy data
Fig no.12: 150% accuracy peak of lurasidone
Precision
Precision was determined as system precision and method precision, in accordance with ICH guidelines. The results of system and method precision studies were shown in Table no (8). The low %RSD values obtained from the analysis of tablets indicated that the method was highly precise.
Acceptance criteria
The individual assays of Lurasidone tablets should be within 98% to 102%.
Relative standard deviation of % Assay results should not more than 2.0%.
SYSTEM PRECISION
Table No: 8 System Precision Data of Lurasidone (standard) S.No Wave lenght Absorbance
1 324 0.943
2 324 0.945
3 324 0.942
4 324 0.944
5 324 0.945
6 324 0.949
Avg 0.944
S.D 0.0073
%R.S.D 0.77%
METHOD PRECISION
Table No: 9 Method Precision Data of Lurasidone (formulation) Sample Wavelenght Absorbance %assay
1 324 0.861 100.1%
2 324 0.867 100.9%
% Assays and % RSD of Assay are within limit, hence the method passes repeatability
Robustness
Table No: 10: Robustness Data of Lurasidone S.
s.no
Change in wave length Absorbance %RSD
1. Low (323nm) 0.243
0.63 2. Original( 324nm) 0.245
3. High (325nm) 0.242
The results of robustness are presented in the above table no (10) and the parameter is said to be within the method’s robustness range.
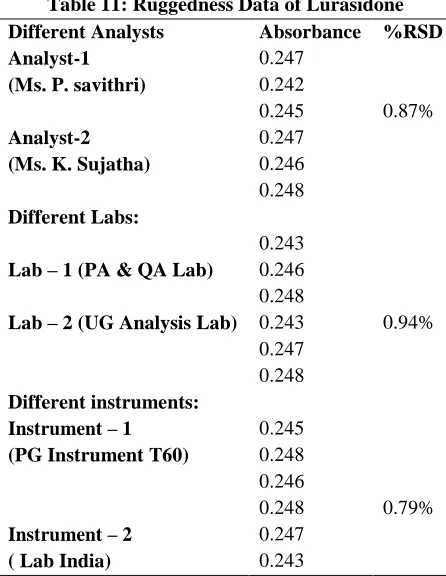
Ruggedness
Table 11: Ruggedness Data of Lurasidone Different Analysts Absorbance %RSD Analyst-1
(Ms. P. savithri)
0.247
0.87% 0.242
0.245 Analyst-2
(Ms. K. Sujatha)
0.247 0.246 0.248 Different Labs:
Lab – 1 (PA & QA Lab)
0.243
0.94% 0.246
0.248 Lab – 2 (UG Analysis Lab) 0.243 0.247 0.248 Different instruments:
Instrument – 1 (PG Instrument T60)
0.245
0.79% 0.248
0.246
Instrument – 2 ( Lab India)
0.248 0.247 0.243
The absorbances of standard solution were measured by different analysts and different instruments. The ruggedness values are presented in the above table no (11).
L.O.D and L.O.Q
The LOD and LOQ values are presented in the above table no (12) according to the signal to noise ratio (3:1and 10:1)
4 324 0.864 100.5%
5 324 0.862 100.2%
6 324 0.865 100.7%
Avg 100.5%
S.D 0.48%
Table No: 12 L.O.D & L.O.Q Data
Parameter Lurasidone
Limit of Detection 0.275µg/ml Limit of Quantification 0.549µg/ml
Table 13: Results in Method Validation S.no Parameter Result Acceptance Criteria 1 Linearity r² = 0.9987 r² = 0.999
2 Accuracy 99.82-100.40% 98-102% 3 Precision Method -0.57%
System-0.77%
RSD < 2%
4 Assay 100.02% 98-102%
5 Robustness 0.63% RSD < 2%
6 Ruggedness 0.87% RSD < 2%
7 L.O.D 0.275µg/ml Signal noise ratio should be more than 3:1 8 L.O.Q 0.549µg/ml Signal noise ratio should be more than 10:1
SUMMARY AND CONCLUSION
An UV spectrophotometric method was developed and validated for various parameters as per ICH guidelines. The acetone and water were selected as diluent in the ratio of 70:30 for proposed method for quantification of Lurasidone in bulk and tablet dosage forms. The Lurasidone showed maximum absorbance at 324 nm using acetone and water in the ratio of 70:30 as diluent. There is no interference between the drug and the excipients. Hence the developed method is specific.
The sensitivity of the method is good and also linearity which is observed over wide concentration range of 15-90 µg/ml. Regression equation and correlation coefficient values were found to be y = 0.1407x+0.151 and R² = 0.998, respectively indicating that the proposed method was linear. The
accuracy of the method was determined by recovery studies. The recovery of drug is well within the acceptance limits of 98-102%.
The precision was determined by analyzing the samples of Lurasidone. The low %RSD values obtained from the analysis of tablets indicated that the method was highly precise. For routine analytical purposes it is always of interest to establish methods capable of analyzing a sample in a short time period with due accuracy and precision. The main purpose of this study was to develop specific, accurate, precise and economic methods for the determination of Lurasidone. The proposed method was found to be suitable for the routine quality control of Lurasidone in tablet dosage form.
REFERENCES
[1]. Pharmaceuticals for Human Use, ICH Harmonization Tripartite Guideline. Validation of Analytical Procedures: Text and Methodology Q2 (R1), Complementary Guideline on Methodology 1996, Incorporated in London. 2005.
[2]. Martindale, “The Extra Pharmacopoeia”, ed. Reynolds, J.E.F., Royal Pharmaceutical Society, London, 31, 1996, 404 – 406.
[3]. Klaus Florey, “Analytical profiles of drug substances and excipients”, Brittain H.G., Academic Press, An Imprint of Elsevier, New Jersey, 27, 67 –112.
[5]. Method Development, Validation And Stability Studies For Determination of Lurasidone Hydrochloride In Tablet Dosage Form By Rp-Hplc Bhavani Thota1, Geetha Susmita Adepu2, Rajitha Galla3* International journal of pharmacy and pharmaceutical sciences, 10(12), 2018, 58-63.
[6]. Second Order Derivative Spectrophotometric Method for Estimation of Lurasidone in Bulk and Pharmaceutical Formulation .Zamir G. Khan, Bhavsar S. Vaidehi, Gujarathi N. Sarang, Gujarathi B. Shivam, Prashant B. Patil* journal of pharm sci tech. 7(1), 2017.
[7]. A Review Of Analytical Methods For Estimation In Pharmaceutical Formulation Zamir G. Khan, S. B. Bari And D. Patilkhan et al., IJLSR, 2(2), 2016, 17-22.
[8]. Stability Indicating Rp-Hplc Method for Determination and Validation of Lurasidone Hcl in Bulk and Pharmaceutical Dosage Forms. Suneetha A*, Manasa K 2015.
[9]. Development And Validation Of Uv Spectrophotometric Method For Estimation Of Lurasidone In Bulk And Phar K. Vijaya Sri*, S. Sravani, M. Shiva Kumar. asian j. pharm maceutical Formulation res. 5(2), 2015, 102-107.
[10].Solubility Enhancement Studies On Lurasidone Hydrochloride Using Mixed Hydrotropyjyotsana R. Madan, Kiran T. Pawar, Kamal Dua1department Of Pharmaceutics, Sinhgad technical Education Society’s, Smt. Kashibainavale College Of Pharmacy, Pune, Maharashtra, India, Published In 2015.
[11].Validated UV spectrophotometric method for quantitative analysis of Lurasidone hydrochloride in pharmaceutical dosage form.Ravisankar P.*1, G. Rajyalakshmi1, Devadasu Ch.1 and DevalaRao G.Der Pharmacia Sinica, 5(5), 2014, 1-7.
[12].Simple and Validated Ultraviolet Spectrophotometric Method for the Estimation of Lurasidone in Bulk Form. Muvvala S Sudhir1 and Ratnakaram V Nadh 2,* 4(1), 609-617.
[13].United States Pharmacopoeia 25 and the National Formulary 20, the Official Compendia of Standards. First Annual Asian edition; United States Pharmacopoeial Convention, INC 12601, Twin brook Parkway, Rockville, M D,USA, 2007, 1141.
[14].British Pharmacopoeia. The Stationery Office (on behalf of Medicines and Healthcare Products Regulatory Agency (MHRA)), London, England, 1, 2007. 1036-37, 2, 1384-85, 3, 2643-44.
[15].Indian Pharmacopoeia. Ministry of Health and Family Welfare, New Delhi, India, 1, 1996, 371-72.
[16].B.K Sharma,“Instrumental methods of chemical analysis, Introduction to Analytical Chemistry”, Goal Publishing House, Meerut, 23, 2004, 1-4.
[17].ICH, “Q2 (R1), Validation of Analytical Procedures: Text and Methodology”, In Proceedings of International Conference of Harmonization, Geneva, Switzerland, 1, 2005.
[18].United States Food and Drug Administration Guidance for Industry, ICH Q6A, Specifications: Test Procedure and Acceptance Criteria for New Drug Substances and New Drug Products: Chemical Substances, 1999. [19].FDA Guidance for Industry-Analytical Procedures and Method Validation, Chemistry, Manufacturing, and
Controls Documentation, Center for Drug Evaluation and Research (CDER) and Center for Biologics Evaluation and Research (CBER), 2000.