Pawanjeet. J. Chahabda et al., J. Sci. Res. Phar. 2013, 2(4), 1-6
J
ournal of
S
cientific
R
esearch in
P
harmacy
Research Article
Available online thr oug h
ISSN: 2277-9469
www.jsrponl
ine.com
Development and Validation of a Simple and Stability Indicating LC Method for Analysis of E zogabine in
Bulk Drug and Pharmaceutical Dosage form
Pawanjeet. J. Chhabda*,M. Balaji, Srinivasarao .V
Department of Biochemistry, Ahmednagar College, Ahmednagar, India.
Department of Chemistry, Gitam Institute of Science, GITAM University, Visakhapatnam, India.
Received on: 26-09-2013; Revised and Accepted on: 12-10-2013
ABSTRACT
A
novel, simple, precise and stability indicating reverse phase high performance liquid chromatography method has been developed and validated for the assay determination of Ezogabine in bulk drug and dosage form. LC separation was achieved on a purospher star RP18 (4.6x150) mm, 5 µm column in isocratic mode using buffer (0.01M Na2HPO4 Ph 9.0) and acetonitrile in the ratio 60:40%v/v as mobile phase,pumped in to the column at flow rate 0.8 ml/min and the detection of eluent from the column was carried out using Diode array detector at 220 nm. The column was maintained at 25˚c temperature and the total run time was 20min. The retention time of ezogabine was 8.9min and the standard curves were linear over the concentration range of 20-150 µg/ml with r2= 0.9999. The percentage relative standard deviation in
accuracy and precision studies was found to be less than 2%. The method was successfully validated as per ICH guidelines. Val idation studies demonstrated that the proposed method is specific, simple, rapid and reproducible. Forced degradations were carried out under acidic, basic, oxidation, dry heat and photolytic stress conditions. In the stressed sample chromatograms, it demonstrated the specificity o f the assay method for their estimation in presence of degradation impurities. The proposed method is suitable for the routine quality control analysis of Ezogabine in bulk and dosage forms and is stability indicating.
Keywords: Ezogabine, Validation, HPLC, Stability indicating.
INTRODUCTION
R
etigabine or Ezogabine is an anticonvulsant used as treatment for partial epilepsies. Ezogabine works primarily as a potassium channel opener that is, by activating a certain family of voltage gated potassium channels in the brain. This mechanism of action is unique among antiepileptic drugs, and may hold promise for the treatment of other neurologic conditions, including migraine and neuropathic pain. The drug was developed by Valeant pharmaceuticals and GlaxoSmithKline, it was approved by the European Medicines agency under the trade name Trobalt and by the United Food and drug administration under the trade name Potiga [16]. Ezogabine is chemically ethylN-[2-amino-4-[(4-fluorophenyl)methylamino]phenyl]carbamate with empirical formula is C16H18FN3O2 and molecular weight 303.33 [17].
Various methods in the literatures involve determination of Ezogabine in dog plasma by LCMS/MS [10],pharmacokinetics,
pharmacodynamics [1-9], pharmaceutical dosage forms using
spectrophotomatric method [11] and hplc method [12, 13]. In the
present work we have developed a new, simple precise and stability indicating method for determination of Ezogabine in bulk drug and pharmaceutical dosage form.
Fig. 1: Structure of Ezogabine
*Corresponding author:
Pawanjeet. J. Chhabda
Department of Biochemistry,
Ahmednagar College, Ahmednagar, India.
*E-Mail: [email protected]
EXPERIMENTAL
Chemicals & Reagents:
Ezogabine is available as tablets with brand name POTIGA was purchased from local market, containing Ezogabine 400mg. HPLC acetonitrile, ortho phosphoric acid and di sodium hydrogen phosphate were purchased from Merck, Mumbai. High pure water was prepared by using Millipore Milli-Q plus purification system.
Chromatographic Conditions:
The chromatograph consisted of an Agilent 1100 HPLC system with G1311A quaternary pump, G1315A diode array detector, a G1313A auto- sampler, and a G1322A vacuum degasser. The data were evaluated by empower2 Software. Buffer consisted of 0.01m disodium hydrogen phosphate (1.41g of disodium hydrogen phosphate in 1000 ml of water) PH adjusted 9.0 with phosphoric acid. A purospher star RP18 (4.6x150) mm, 5 µm column and isocratic mixture of solution A (Buffer) solution B (Acetonitrile) used as stationary and mobile phase respectively. The isocratic program was fixed as (60:40%v/v). Acetonitrile used as diluent. The column oven maintained at 25˚c with 0.8ml flow rate. An injection volume 10µl was used. The elution compounds were monitored at 220 nm.
Preparation of Stock and standard solutions:
Accurately 100mg of Ezogabine standard dissolved in 100ml diluent to get a concentration of 1000µg/ml. Further 10ml of stock solution was taken in 100ml flask and diluted up to the mark with diluent to get concentration of 100µg/ml.
Preparation of Tablets for assay:
Pawanjeet. J. Chahabda et al., J. Sci. Res. Phar. 2013, 2(4), 1-6
Forced Degradation studies:Forced degradation studies were performed to evaluate the stability indicating properties. All solutions for used in stress studies were prepared at an initial concentration of 1000µg/ml of Ezogabine.
Acid Degradation studies:
Acid decomposition was carried out in 0.1N HCL at concentration of 1000µg/ml Ezogabine and after refluxation for 24hrs at 80˚c, the stressed sample was cooled, neutralized and diluted as per requirement with diluents filtered and injected. The resulting chromatogram is shown in Fig. 3(g). The results are tabulated in Table 5.
Alkali Degradation studies:
Base decomposition was carried out in 0.1N NaOH at concentration of 1000µg/ml Ezogabine and after refluxation for 12hrs at 80˚c, the stressed sample was cooled, neutralized and diluted as per requirement with diluents filtered and injected. The resulting chromatogram is shown in Fig. 3(i). The results are tabulated in Table 5.
Oxidation:
Oxidation was conducted by using 3%H2O2 solution at room temperature. After 24hrs 10ml of solution was taken in 100ml flask and diluted up to the mark with diluent to get concentration of 100µg/ml filtered and injected. The resulting chromatogram is shown in Fig. 3(k). The results are tabulated in Table 5.
Temperature Stress studies:
1g of Ezogabine sample was taken into a petridish and kept in oven at 80˚c for 7 days. 100mg of sample was taken into 100
ml flask diluted volume with diluent, further 10ml to 100ml made up with diluent. The results are tabulated in Table 5.
Photo stability:
1g of Ezogabine was taken in to a petridish and kept in photo stability chamber 200 W.hr/m2 in UV Fluorescent light and
1.2M LUX Fluorescent light. 100mg of sample was taken in 100ml flask, dissolved in diluent, further 10ml in 100ml flask diluted volume with diluent. The results are tabulated in Table 5.
RESULTS AND DISCUSSION
HPLC Method Development and Optimization:
The analytical method conditions were selected after testing the different parameters such as column, wavelength, aqueous and organic phase, buffer concentration, mobile phase propation, diluents, concentration of analyte, flow and other parameters. purospher star RP18 (4.6x150 mm), 5 µm column was used because of its wide pH range(1-12), high resolution capacity and low degree of tailing. For mobile phase selection, the preliminary trials using different compositions of mobile phases containing water and acetonitrile gave poor peak shape. For improving peak shape instead of water disodium hydrogen phosphate and acetonitrile (60:40%v/v) and thus, better peak shape was obtained. Acetonitrile used as diluents because Ezogabine freely soluble. The detection wavelength was chosen as 220nm for Ezogabine because they have better absorption and sensitivity at this wavelength (Fig. 2). Hence selected method was best among the all trails by many aspects.
193.0
222.0
303.0
365.0381.0
AU
0.000 0.001 0.002 0.003 0.004 0.005 0.006 0.007 0.008
nm
200.00 220.00 240.00 260.00 280.00 300.00 320.00 340.00 360.00 380.00 400.00
Fig. 2: wavelength spectrum of Ezogabine
Method Validation: Precision:
Precision study was established by evaluating method precision and intermediate precision study. Method precision of the analytical method was determined by analyzing six sets of sample preparation. Intermediate precision of the analytical method was determined by performing method precision on another day and another analyst under same experiment condition. The result obtained for method precision and intermediate precision are shown in Table 3. The percentage of RSD was calculated. The %RSD range was obtained as 0.08 and 0.23 for method precision and intermediate precision respectively (Table 4) which is less than 2% indicating that the method is more precise.
Accuracy:
The accuracy of the method was assessed by determination of recovery for three concentrations (corresponding to 50,100 and 150% of test solution concentration) covering the range of the method. For each concentration three sets were prepared and injected. The drug concentrations of Ezogabine were calculated, the results obtained are shown in Table 2. The drug concentrations of Ezogabine were calculated, the percentage recovery was found to be 99.27-99.96% with %RSD 0.05 - 0.2 (<2.0%) indicating that the method is more accurate (Table 2).
LOD and LOQ:
The LOD and LOQ were determined at a signal to noise ratio of 3:1 and 10:1 respectively by injecting a series of test solutions of known concentrations within the linearity range.
Precision study was also carried out at the LOQ level by injecting six pharmaceutical preparations. The LOD and LOQ were to be 0.09µg/ml and 0.30µg/ml respectively. The %RSD value was noticed to be less than 2.0% at LOQ concentration level.
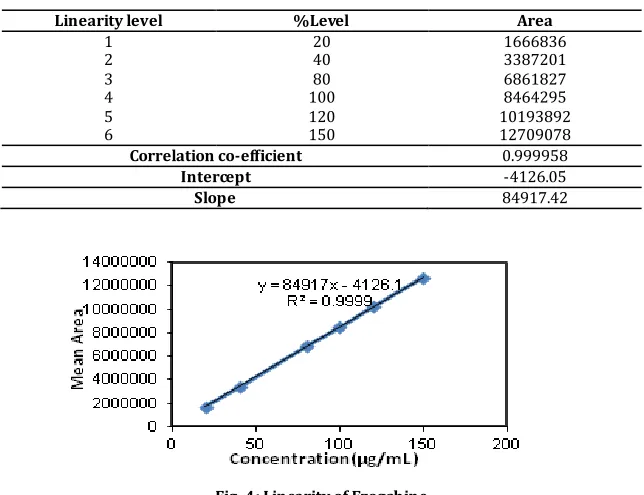
Linearity:
The linearity plot was prepared with six concentration levels (20, 40, 80,100,120 and 150 µg/ml of Ezogabine). These concentration levels were respectively corresponding to 20, 40, 80,100,120 and 150 % of test solution concentration. The results obtained are shown in Table 1. The peak areas were plotted against the corresponding concentrations to obtain the calibration curve (Fig. 4).
Robustness:
Robustness of methods were checked by making slight deliberate changes in chromatographic conditions like flow rate (±0.1 ml/min), ±5% acetonitrile and column temperature (±5˚c). The results are tabulated in table 4. Under all the deliberately varied chromatographic conditions, the reproducibility of results was observed to be reasonably good. Hence the proposed method has good robustness for the assay of Ezogabine in bulk and dosage forms.
Solution stability and Mobile phase stability:
Pawanjeet. J. Chahabda et al., J. Sci. Res. Phar. 2013, 2(4), 1-6
%RSD (NMT 2.0%) between initial assay value and assay valueobtained at predetermined time interval calculated.
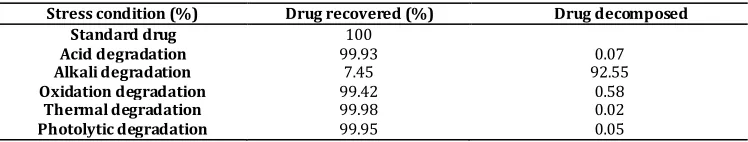
Forced Degradation Studies:
Stress studies on Ezogabine were carried out under oxidation, thermal stress, photolysis, acid and alkali hydrolysis conditions. Significant degradation was observed in base (Fig. 3i) of
Ezogabine. There were no significant degradation of Ezogabine upon exposure to dry heat, acid, oxidation and photolysis, which indicated that the drug was stable against these stress conditions. The developed method revealed that there was no interference from the impurities, degradation products and excipients to determine the assay of drug substance in pure and pharmaceutical formulation.
(a) (b)
(C) (d)
(e) (f)
Pawanjeet. J. Chahabda et al., J. Sci. Res. Phar. 2013, 2(4), 1-6
(i) (j)
E z o g a b in e 8 .7 7 5 Purity Auto Threshold AU D e g r e e s 0.00 0.05 0.10 0.15 0.20 0.25 0.30 0.35 0.00 2.00 4.00 6.00 8.00 10.00 12.00 14.00 16.00 18.00 20.00 22.00 24.00 26.00 28.00 30.00 32.00 Minutes
7.90 8.00 8.10 8.20 8.30 8.40 8.50 8.60 8.70 8.80 8.90 9.00 9.10 9.20 9.30 9.40 9.50 9.60 9.70
(k) (l)
E z o g a b in e 9 .0 0 1 Purity Auto Threshold AU D e g r e e s 0.000 0.002 0.004 0.006 0.008 0.010 0.012 0.014 0.016 0.018 0.020 0.022 0.00 5.00 10.00 15.00 20.00 25.00 30.00 35.00 40.00 45.00 50.00 55.00 60.00 65.00 Minutes
8.45 8.50 8.55 8.60 8.65 8.70 8.75 8.80 8.85 8.90 8.95 9.00 9.05 9.10 9.15 9.20 9.25 9.30 9.35 9.40
E z o g a b in e 8 .9 2 8 Purity Auto Threshold AU D e g r e e s 0.00 0.05 0.10 0.15 0.20 0.25 0.30 0.35 0.40 0.45 0.50 0.55 0.00 10.00 20.00 30.00 40.00 50.00 60.00 70.00 80.00 90.00 Minutes
8.10 8.20 8.30 8.40 8.50 8.60 8.70 8.80 8.90 9.00 9.10 9.20 9.30 9.40 9.50 9.60 9.70
(m) (n)
Fig. 3: Typical chromatograms of (a) Blank (b) Standard (c) Sample (d) precision injections (e) Linearity injections (f) Acid blank (g) Acid sample (h) Base blank (i) Base sample (j) Peroxide blank (k) Peroxide sample (l)Purity plot of acid (m) Purity plot of Base (n)
Purity plot of Peroxide.
Table No. 1: Results for linearity of Ezogabine
Linearity level %Level Area
1 20 1666836
2 40 3387201
3 80 6861827
4 100 8464295
5 120 10193892
6 150 12709078
Correlation co-efficient 0.999958
Intercept -4126.05
Pawanjeet. J. Chahabda et al., J. Sci. Res. Phar. 2013, 2(4), 1-6
Table No. 2: Recoveries study for EzogabineAccuracy (Recovery) study Accuracy
Level Set No. Amount Added (µg/ml) Amount Found (µg/ml) Recovery (%) recovery Average Std Dev. RSD %
1 50.12 49.86 99.48
50% 2 50.24 49.78 99.08 99.27 0.2 0.2
3 50.06 49.68 99.24
1 100.14 100.02 99.88
100% 2 100.16 100.04 99.88 99.85 0.05 0.05
3 100.1 99.9 99.8
1 150.16 150.06 99.93
150% 2 150.12 150.18 100.04 99.96 0.07 0.07
3 150.22 150.08 99.91
Table No. 3: Precision results for Ezogabine
Study Set No. Assay (%) Mean assay(%) Stdev RSD%
1 100.08
2 99.96
Method precision 3 99.92
4 100.1 100.04 0.08 0.08
5 100.12
6 100.04
1 99.88
2 100.06
Intermediate precision 3 100.28
4 99.78 99.94 0.23 0.23
5 99.64
6 100.02
Table No. :4 Robustness results for Ezogabine
Robust conditions variation Retention time(min) USP Tailing USP Plate count
0.9ml 7.8 1 6523
Flow 0.8ml 8.92 0.97 6326
0.7ml 10.08 0.93 6214
20˚c 9.13 0.96 6234
Temperature 25˚c 8.92 0.97 6326
30˚c 8.74 0.99 6432
45 7.94 1 6534
%Acetonitrile 40 8.92 0.97 6326
35 9.84 0.92 6125
Table No. 5: forced degradation results for Ezogabine
Stress condition (%) Drug recovered (%) Drug decomposed
Standard drug 100
Acid degradation 99.93 0.07
Alkali degradation 7.45 92.55
Oxidation degradation 99.42 0.58
Thermal degradation 99.98 0.02
Photolytic degradation 99.95 0.05
CONCLUSION
A
ll the above factors lead to the conclusion that proposed method was found to be a new, simple, precise, linear, accurate and specific. Degradation impurities did not interfere with the retention time of Ezogabine, and assay method is thus stability indicating.ACKNOWLEDGEMENTS
T
he authors are grateful of the M/S GITAM Institute of Science, GITAM University, Visakhapatnam, India for providing research facilities.REFERENCES:
1. Porter RJ, Partiot A, Sachdeo R, Nohria V and Alves WM. Randomized, multicenter, dose-ranging trial of retigabine for partial-onset seizures. Neurology, 2007; 68(15): 1197– 204.
2. Main MJ, Cryan JE, Dupere JR, Cox B, Clare JJ and Burbidge SA. Modulation of KCNQ2/3 potassium channels by the novel anticonvulsant retigabine". Molecular Pharmacology,
2000; 58(2): 253–62.
3. Ferron GM, Paul J and Fruncillo R.Multiple-dose, linear, dose-proportional pharmacokinetics of retigabine in healthy volunteers". Journal of Clinical Pharmacology, 2000; 42(2): 175–82.
4. Weisenberg JLZ and Wong M. Profile of ezogabine (retigabine) and its potential as an adjunctive treatment for patients with partial-onset seizures, Neuropsychiatric Disease and Treatment, 2011; 7: 409-414.
5. Martin J Gunthorpe, Charles H Large and Raman Sankar. The mechanism of action of retigabine (ezogabine), a firstin-class K+ channel opener for the treatment of epilepsy, Epilepsia, 2012; 53(3): 412-424.
Pawanjeet. J. Chahabda et al., J. Sci. Res. Phar. 2013, 2(4), 1-6
7. Hermann R, Borlak J, Munzel U, Niebch G, Fuhr U, Maus J andErb K. The role of gilbert's syndrome and frequent NAT2 slow acetylation polymorphisms in the pharmacokinetics of retigabine. The Pharmacogenomics Journal, 2006; 6: 211– 219.
8. Ferron GM, Paul J, Fruncillo R, Richards L, Knebel N, Getsy J and S Troy S. Multiple-dose,linear, dose-proportional pharmacokinetics of retigabine in healthy volunteers. J. Clin. Pharmacol., 2002; 42: 175-182.
9. Czuczwar P, Wojtak A, Cioczek-Czuczwar A, Parada-Turska J, Maciejewski R, Czuczwar SJ. Retigabine: the newer potential antiepileptic drug. Pharmacol. Rep., 2010; 62(2): 211-9. 10. Bu W, Nguyen M, Xu C, Lin CC, Yeh LT, Borges V.
Determination of N-acetyl retigabine in dog plasma by LC/MS/MS following off-line microelution 96-well solid phase extraction. J. Chromatogr. B Analyt. Technol. Biomed. Life Sci., 2007; 852(1-2): 465-72.
11. PVV. Satyanarayana and Alavala Siva Madhavi, New Spectrophoyometric methods for the Quantitative estimation of Ezogabine in formulations, IJRPC, 2012; 2(4). 12. B.Lakshmi, Prof.K.Saraswathi, Prof. T.V.Reddy , RP-HPLC
method development and validation for the analysis of Ezogabine in pharmaceutical dosage forms, Int. J. A. PS. BMS,
2012; 1(1): 7-14.
13. PVV. Satyanarayana and Alavala Siva Madhavi, Validated RP - HPLC Method for the Estimation of Ezogabine in Tablet Dosage Form, ijrpbsonline, 2012; 3(2).
14. ICH Q2 (R1), Validation of analytical procedures: Text and Methodology, Fed. Reg (19 May 1997) 62:27463.
15. Snyder LR, Kirkland JJ, Glajch JI. PracticalHPLC Method Development. 2nd ed.; 1997; p. 2-21.
16. www.wikipedia.org/wiki/ Retigabine. 17. www.chemblink.com/products/150812-12-7.
Conflict of interest: The authors have declared that no conflict of interest exists.