Cross-correlation of Barker code and
Long binary signals
A.NagaJyothi *[1]
[1]Research Scholar, Department of Electronics& Communication Engineering, Andhra University,Visakhapatnam,AndhraPradesh,India-530003
Prof. K.Raja Rajeswari [2]
[2] Professor, Department of Electronics& Communication Engineering, Andhra University,Visakhapatnam,AndhraPradesh,India-530003
Abstract:
The normal binary sequence is very well known and important in pulse compression radar. In this paper we present normal Barker sequence, and Nested binary sequence. Then we cross correlate all these sequences and plot ambiguity functions of the same .Cross correlated sequence has better PSLR,resolution and controlled side lobes.
At first we present ambiguity plot and auto correlation plots of 13 length barker code,63 Nested code ,kronecker tensor product function (13X13), Nested Barker code of length of 65. Next we cross correlate all these sequences and then results are plotted.
Keywords:-AF(Ambiguity Function),Barker codes, Nested Barker codes, ACF(Auto Correlation Function),Cross correlation, PSLR(Peak Side Lobe Ratio)
1.Introduction
Low probability of Intercept (LPI) pulse compression waveforms find applications in secure communication. In general for good detection most radar seeks to transmit long duration pulses to achieve high energy, on the other hand for good range resolution radar needs short pulses. Pulse compression is a technique which combines high energy of long pulse and resolution (the ability to differentiate nearby targets) of short pulse[1,6,10].
Pulse compression is a method for achieving the resolution of the short pulses while keeping within the practical constraints of peak power limitation. Pulse compression is achieved by modulating the transmitted pulse and then correlating the received signal with the transmitted pulse. Pulse compression also known as pulse coding, is a signal processing technique designed to maximize the sensitivity and resolution of radar system. Radar signal designers had been continuously putting their efforts to achieve suitable codes for the optimum performance of radar.
In general the ACF (which is an approximation for the matched filter output ) for a BN Barker code will be 2N∆τ wide. The main lobe is 2∆τ wide; the peak power value is equal to N. There are (N-1)/2 side lobes on either side of the main lobe. The main lobe is equal to the length of the code while all side lobes are unity. The most side lobe reduction offer by Barker code is -22dB, which may not be sufficient for the desired radar application[1,2] . In this paper Barker code is combined to generate much longer length codes. For this a code of length Bm can be used within a Bn code(m with n) to generate a code of length mn. The compression ratio for the combined Bmn code is equal to mn. Some side lobes of a Barker code auto correlation function can be reduced to minimum it can be up to zero by using mismatch filters, matched filter is followed by a linear transversal filter with Impulse response[6,7,9,10].
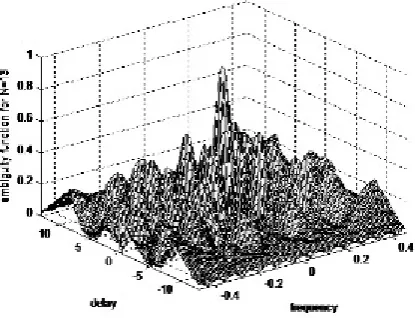
2.Barker Sequence of length N=13
Fig 1.a. shows the Ambiguity plot for Barker code N=13
Fig 1.b. shows the Auto correlation plot for Barker code N=13
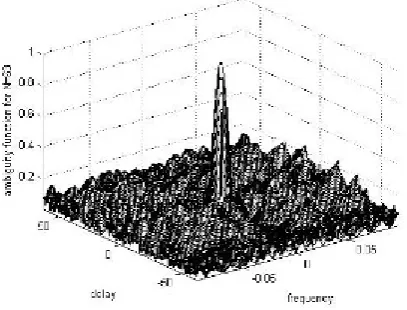
3. Binary signal of length of N=63
In this section we use two different binary signals, as an example we choose a signal whose initial matched response is good. The two signals are the minimum PSL signal and they are nested to form a binary sequence of length 63, which exhibits a matched filter response of -24.846 dB.
A minimum PSL signal of length 63 appears in [2];its peak side lobe is 4 and PSLR is given by -23.946 dB . The signal is given in [1,4]
Fig 2.a shows the AF and Fig 2.b shows the ACF of length N=63
Fig 2.a shows the Ambiguity plot for binary sequence N=63
Fig.2.b shows the Auto correlation plot for binary code N=63
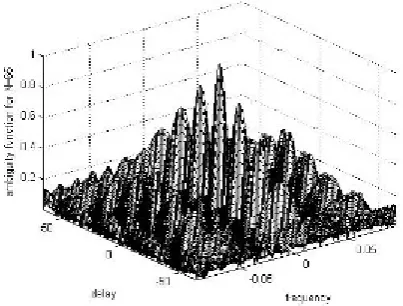
4. Binary signals of length N=65
A nested Barker code of length 65, shown below, was created from an outer Barker code of length 5 in which each element is a Barker code is of length 13. The code is given is directly taken from [6,7]
+1 +1 +1 +1 +1 −1 −1 +1 +1 − +1 −1 +1 +1 +1 +1 +1 +1 −1 −1 +1 +1 −1 +1 −1 +1 +1 +1 +1 +1 +1 −1 −1 +1 +1 −1 +1 +1 −1 −1 −1 −1 −1 +1 +1 −1 −1 +1 −1 +1 −1 +1 +1 +1 +1 +1 −1 −1 +1 +1 −1 +1 −1 +1
Fig 3.a shows the AF and Fig 3.b shows the ACF of length N=65
Fig 3.a shows the Ambiguity plot for binary sequence N=65
Fig.3.b shows the Auto correlation plot for binary code N=65
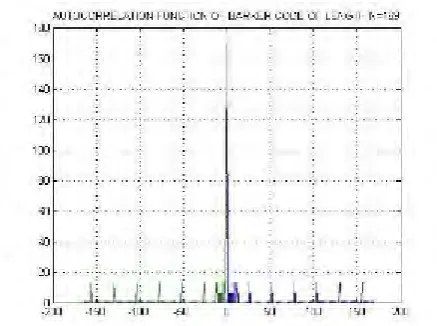
5. Binary signals of length N=169
In this section we used Barker code of N=13 nested with the same barker code of N=13 using Kronecker tensor product. The result is a large array formed by taking all possible products between the elements of X and those of Y. If X is m-by-n and Y is p-by-q, then kron(X,Y) is m*p-by-n*q [1,2,4].
Fig 4.a shows the AF and Fig 4.b shows the ACF of length N=13X13.
4.b shows the Auto Correlation Function plot for Binary sequence of length N=13X13
It is found that N=169 which is formed by Nesting of Barker code of length 13and has less side lobes and PSLR which is equal to -33.41dB .The binary sequence for N=169 is given by
+1 +1 +1 +1 +1 -1 -1 +1 +1 -1 +1 -1 +1 +1 +1 +1 +1 +1 -1 -1 +1 +1 -1 +1 -1 +1 +1 +1 +1 +1 +1 -1 -1 +1 +1 -1 +1 -1 +1 +1 +1 +1 +1 +1 -1 -1 +1 +1 -1 +1 -1 +1 +1 +1 +1 +1 +1 -1 -1 +1 +1 -1 +1 -1 +1 -1 -1 -1 -1 -1 +1 +1 -1 1 +1 1 +1 1 1 1 1 1 1 +1 +1 1 1 +1 1 +1 1 +1 +1 +1 +1 +1 1 1 +1 +1 1 +1 1 +1 +1 +1 +1 +1 +1 1 -1 +-1 +-1 --1 +-1 --1 +-1 --1 --1 --1 --1 --1 +-1 +-1 --1 --1 +-1 --1 +-1 --1 +-1 +-1 +-1 +-1 +-1 --1 --1 +-1 +-1 --1 +-1 --1 +-1 --1 --1 --1 --1 -1 +1 +1 -1 -1 +1 -1 +1 -1 +1 +1 +1 +1 +1 -1 -1 +1 +1 -1 +1 -1 +1
Table 1 shows all calculated PSLR values for Barker 13 , Binary sequence 63,65,169.
S.No Type of sequence PSLR(dB)
1 Barker 13 -22.27
2 Binary sequence N= 63 -24.84
3 Binary sequence N= 65 -19.08
4 Binary sequence N=169(using kronecker tensor product)
-33.41
6. Cross correlation of the sequences
In signal processing, cross-correlation is a measure of similarity of two waveforms as a function of a time-lag applied to one of them. This is also known as a sliding dot product or sliding inner-product. It is commonly used for searching a long-duration signal for a shorter, known feature. For continuous functions, f and g, the cross-correlation is defined as:
(2)
where f * denotes the complex conjugate of f.
Similarly, for discrete functions, the cross-correlation is defined as:
(3)
[ -0.0159 0.0159 0.1111 0.0476 -0.1111 0.0476 -0.0476 0.0476 0.0159 -0.0476 0.0159 -.1111 -0.0159 -0.0159 0.0159 -0.0159 0.0159 -0.0159 -0.0794 0.0794 0.0159 -0.0159 0.0476 0.1111 -0.0159 -0.0159 -0.0159 0.1111 0.0159 0.0794 -0.0476 -0.0476 -0.0159 0.0159 -0.0476 0.1746 -0.0476 -0.0159 -0.0476 0.0159 -0.0159 0.015 -0.0159 0.0476 -0.0476 0.0159 0.0159 -0.0476 -0.0794 -0.1429 -0.0159 0.0635 -0.0159 0 0.0159 0 -0.0159 -0.0317 -0.0476 -0.0635 -0.0476 -0.0317 -0.0159]
Fig 5.a. shows the Ambiguity plot for cross correlation of Barker code N=13 with binary sequence of length N=63
Fig 5.a. shows the Auto correlation plot for cross correlation Of Barker code N=13 with binary sequence of length N=63
8. Cross correlation of Barker 13 and Binary 65
In this we have take Barker sequence of length N=13 and Binary sequence of length N=65 from an outer Barker code of length 5 in which each element is a Barker code is of length 13 and we cross correlate these two sequences, then we plotted the AF and ACF. The resulted PSLR is also tabulated.
[ 0.2000 0.0154 0.0154 0.0154 0.0154 0.0154 0.0154 0.0154 0.0154 0.0154 0.0154 0.0154 0.0154 0.2000 0.0154 0.0154 0.0154 0.0154 0.0154 0.0154 0.0154 0.0154 0.0154 0.0154 0.0154 0.01540.2000 0.0154 0.0154 0.0154 0.0154 0.0154 0.0154 0.0154 0.0154 0.0154 0.0154 0.0154 0.0154 0.2000 0.0154 0.0154 0.0154 0.0154 0.0154 0.0154 0.0154 0.0154 0.0154 0.0154 0.0154 0.0154 0.2000 0 0.0154 0 0.0154 0 0.0154 0 0.0154 0 0.0154 0.0154]
Fig 6.a. shows the Ambiguity plot for cross correlation of Barker code N=13 with binary sequence of length N=65
Fig 6.b. shows the Auto correlation plot for cross correlation of Barker code N=13 with
binary sequence of length N=65
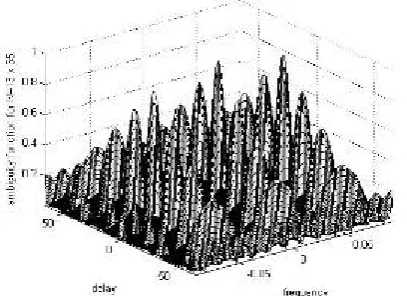
9. Cross correlation of Barker 13 and Binary 169
In this we have take Barker sequence of length N=13 and Binary sequence of length N=169 and they have been cross correlated and we plotted the AF and ACF. The resulted PSLR is also tabulated.
Fig 7.a. shows the Ambiguity plot for cross
correlation of Barker code N=13 with
binary sequence of length N=169
Fig 7.b. shows the Auto correlation plot for cross
correlation of Barker code N=13 with
binary sequence of length N=169
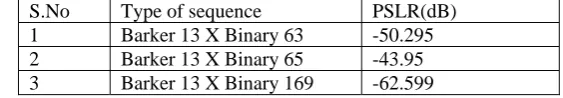
Table 2 shows all calculated PSLR values for Cross correlated sequences of Barker 13 with Binary sequence of length N=[63,65,169].
S.No Type of sequence PSLR(dB) 1 Barker 13 X Binary 63 -50.295 2 Barker 13 X Binary 65 -43.95 3 Barker 13 X Binary 169 -62.599
10. Conclusions
Several examples help strengthen the intuitively appealing assumption that nesting and cross correlating the sequences shows better pulse compression performances when compared to Barker sequence alone. Binary sequence of length N is equal to 63 has less side lobes than N is equal to 65 ,so preferably N is equal to 63 can be used than N is equal to 65.The examples included Barker code of length 13, binary sequence of lengths{63,65,169}, and cross correlating all the including binary sequences of lengths{63,65,169} with Barker code of length 13.
11. Future work
12. Acknowledgment
This work is being supported by Ministry of Science & Technology, Department of Science & Technology (DST), New Delhi, India, under Women Scientist Scheme (WOS-A) with the Grant No: 100/ (IFD)/8450/2010-11,Dated 15/11/2010.
References
[1] N. Levanon, “Cross-correlation of long binary signals with longer mismatched filters”, IEE Proc. Radar Sonar Navigation, vol 152, no. 6,pp 377-382, December 2005.
[2] Rao Nuthalapati, Lockheed Martin, Moorestown, NJ, USA., “Mismatched Filtering of Chaotic Codes”Proceedings ”, of the IEEE, vol. 978, no. 6,October 2010, pp. 45-47.
[3] R. Nuthalapati, “Design of mismatched filters for long binary codes”,in Proc. IEEE International Radar Conference, pp. 54-59, May 2008.
[4] G.E.Coxson and J.Russo, "Efficient exhaustive searchfor optimal-peak-sidelobe binary codes", 2004 NationalRadar Conference, Philadelphia, PA, USA, May, 2004.
[5] F.E.Nathanson, J.P.Reilly, and M.Cohen. Radar DesignPrinciples, 2 ed., New York: McGraw-Hill, 1991. [6] Levanon. N, Mozeson Radar Signal, 2004.
[7] Levanon.N, Radar Prirzciples Wiley, New York, 1988.
[8] Coxson, G. E., Cohen, M. N., and Hirschel, A.New results on minimum-PSL binary codes.Presented at the IEEE National Radar Conference,Atlanta, GA, May 2001.