Lung Nodule Classification Using Deep Learning Algorithm
R.Srivenkatalakshmi1 and Dr.S.Balambigai2
1PG student, M.E Communication Systems, Kongu Engineering College, India. Email: [email protected]. 2Associate Professor, Kongu Engineering College, India. Email: [email protected]
Article Received: 01 March 2018 Article Accepted: 09 April 2018 Article Published: 28 April 2018
1. INTRODUCTION
Lung cancer is the leading cause of cancer deaths in both men and women. The number of deaths caused due to lung
cancer is more than prostate, colon and breast cancers combined. Also, most patients detected with lung cancer
today are already at an advanced stage as lung cancer is hard to detect in early stages. The small lesions cannot be
detected by X-rays and are only detectable by a CT scan. Even after the detection, it takes a considerable amount of
effort and experience on the part of radiologists to detect and label the nodules as benign or as a probable case of
malignancy.
On considering the more number of cases encountered by radiologists every day there is a constant pressure on
them to analyse a huge amount of data and make a decision as quickly as possible based on the analysis. To detect
and analyse lung nodules in CT images and to reduce the burden of radiologists Computer Aided Diagnosis(CAD)
is used. There is always a need for a reference standard dataset to create such CAD systems, that can be used to
obtain ground truths and can also act as a basis for comparison of different CAD algorithms. To effectively
represent the structure and characteristics of region of interest in images CAD system is used for classification. To
obtain more abstract and useful representations of data, deep learning architectures are effectively formed.
The objective of this research work is to classify potential pulmonary lesions as nodule or non nodule using
convolutional neural networks. The main aim is to develop a fast, reliable and cost-effective program using
MATLAB, which would enable detection of cancerous or tumorous lesions in CT images of the lungs of affected
patients.
2. METHODOLOGY
In this article, the system uses three steps. The first step starts with collection of CT images of lungs. The second
step is image segmentation which uses simulated annealing algorithm and the third step is feature extraction and A B S T R A C T
Lung cancer is one of the major cause of death among people throughout the world. Early detection of lung cancer can increase the chance of survival among people. The reason for failure in detecting lung cancer in early stages is that there is only a dime-sized lesion growth known as nodule, inside the lung. Hence, a lung cancer detection system using deep learning algorithm is used to classify the presence of lung cancer in CT- images. Images are taken from LIDC (Lung Image Database Consortium) which contains 193 CT images of thoracic regions of patients. The proposed technique uses simulated annealing for segmentation, convolutional neural network for feature extraction and classification. The model classifies 93.04% of actual nodules and significantly reduces the false positive rates.
classification using convolutional neural networks.Fig.2.1 illustrates the block diagram of lung nodule extraction
and classification of this system.
Fig.2.1 Block diagram of lung nodule extraction and classification of this system.
2.1 IMAGE COLLECTION
The foremost step in medical image processing is collection of images. The lung CT images are collected from
LIDC data base. The medical data is usually in DICOM format, which is the standard for storage and transfer of
medical images. Computed tomography (CT) images have better clarity, low noise and distortion for lung
diagnosis. So, CT scan of lung images are given as input for this system. Dimensions of images are 512x512 pixels
in size. Fig.2.2 shows the original CT lung image with nodule.
Fig.2.2 Original CT lung image
2.2 IMAGE SEGMENTATION
The most important part of medical image processing is image segmentation. Image segmentation is a procedure
for extracting the region of interest (ROI) through an automatic or semi-automatic process. Many image
Image Collection
Image Segmentation
segmentation methods have been used in medical applications to segment tissues and body organs. Segmentation
can be used in separating different tissues from each other, through extracting and classifying features in medical
researches. One of the efforts is classifying image pixels into anatomical regions.
Image segmentation has been a long-standing problem in computer vision. It is a very difficult problem for general
images, which may contain effects such as highlights, shadows, transparency, and object occlusion. Segmentation
in the domain of medical imaging has some characteristics that make the segmentation task easier and difficult at
the same time. On the one hand, the imaging is narrowly focused on an anatomic region. The imaging context is
also well defined.
In particular, many of the existing techniques for image description and recognition depend highly on the
segmentation results. The aim of segmentation is to simplify or change the representation of the image into
something that is more easier to analyse and meaningful in representation. Image segmentation is usually used to
locate boundaries (lines, curves, etc.) and objects in images. The pixels with the same label share certain visual
characteristics when a label is assigned to every pixel in an image is referred as image segmentation.
A set of contours extracted from the image (edge detection) or a set of segments that collectively represents the
whole image is the result of image segmentation process. In a specified region all pixels are similar with respect to
some characteristics or computed property, such as intensity, colour, or texture. Adjacent regions are almost
different with respect to the same characteristics.
Segmentation algorithms are based on one of two basic properties of intensity values: discontinuity and similarity.
The first category is to partition the image based on abrupt changes in intensity, such as edges in an image. The
second one is based on partitioning the image into regions that are similar according to a predefined criterion.
2.2.1. SIMULATED ANNEALING ALGORITHM
A probabilistic technique for approximating the global optimum of a given function is Simulated annealing .
Specifically, it is a meta heuristic to approximate global optimization in a large search space. When the search
space is discrete it is often used. Finding an approximate global optimum is more important than finding a precise
local optimum for problems in a fixed amount of time, simulated annealing may be preferable to alternatives such
as gradient descent.
The Simulated Annealing algorithms in general work as mentioned below: The algorithm randomly selects a value
close to the current one, measures its quality, and then decides to move to it or it stays with the current value based
on either one of the two probabilities between which it chooses on the basis of the fact that the new solution is better
or worse than the current one at each time step.The value is progressively decreased from an initial positive value to
to 1 or is changed towards a positive value; instead, the probability of moving to a worse new solution is
progressively changed towards zero during the search.
From the original CT lung image binary mask and the closed binary mask are determined using this algorithm. Fig
2.3 shows the binary mask of the input image.
Fig.2.3. Binary mask
Fig 2.4 shows the closed binary mask of the input image.
Fig 2.4. Closed binary mask
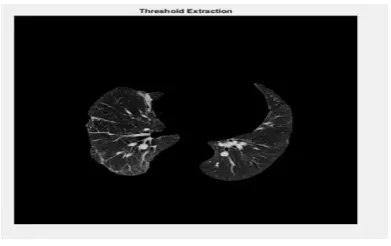
Thresholding is one of the most powerful tools for image segmentation. The segmented image obtained from
thresholding has the advantages of smaller storage space, fast processing speed and ease in manipulation, compared
with gray level image. A binary image is obtained from gray scale image by thresholding. In a non-linear operation
two values are defined to pixels that are below or above the specified threshold value is referred as thresholding. Fig
2.5 shows the threshold extraction of the input image.
2.2.2 CONVOLUTIONAL NEURAL NETWORK
After the segmentation is performed, the segmented lung nodule is used for feature extraction. A feature is a
significant piece of information extracted from an image which provides more detailed understanding of the image.
The features like geometric and intensity-based statistical features are extracted. Classification of the features is
done. Feature extraction and classification is done using Convolutional neural networks. Fig 2.6 shows the
architecture of convolutional neural network.
Fig 2.6 Architecture of convolutional neural network
Convolution neural network is a multi-layer neural network, which comprised of one or more convolution layers
and then followed by one or more fully connected layers as in a standard multilayer neural network. The benefit of
CNNs is that they are easier to train and have many fewer parameters than fully connected networks with the same
number of hidden units. Convolution neural network architecture is usually used in combination with the
convolution layer and pool layer. The affection of pooling layer is to confuse the features of the specific position.
Since some location features are not important, it just need other features and the relative position. The pooling
layer operation consists of Max pooling and Meaning-pooling. Mean-pooling calculates the average neighborhood
within the feature points, and max-pooling calculates neighborhood within a maximum of feature points. The error
of feature extraction mainly comes from two aspects: the neighborhood size limitation caused by the estimated
variance; convolution layer parameters estimated error caused by the mean deviation. The first error is reduced by
mean pooling layer, retaining more image background information. Max-pooling can reduce the second error,
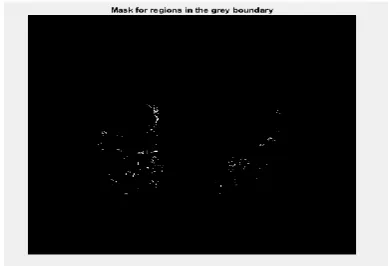
retaining more texture information. Fig 2.7 shows the mask for regions in the grey boundary of input lung image.
After the extraction of the masks in the grey boundary, the pixels that are larger than 5*5 is considered and then the
features are extracted. Fig 2.8 shows the masks for candidates that are larger than 5*5 pixels.
Fig 2.8 Masks for regions larger than 5*5 pixels.
The nodules that are larger than 5*5 is obtained. A linearity graph is drawn for the classified lung image. Fig 2.9
shows the linearity graph in which nodules and non nodules are shown.
Fig 2.9 Linearity graph
More number of iterations are done until the loss is minimized. For the minimization of the loss iterations are
increased. Fig 2.10 shows the CNN training loss. Here the loss is minimized with more iterations.
Also the image is tested with the artificial neural network and the classification of features is done. The accuracy
values are obtained. Table 1 shows the classification accuracy of the artificial neural network.
ANN Accuracy
Correct classification 90%
Incorrect classification 10%
Table 1 Classification accuracy of ANN
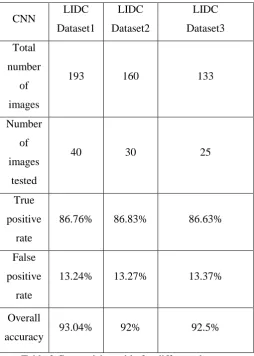
In the proposed work (CNN) the network calculates the true positive rate and the false positive rates along with the
area of the cancer cells. The accuracy is improved compared to ANN. The number of epochs is increased for better
training accuracy. The network is tested for various datasets and the corresponding true positive rate and the false
positive rate is obtained. Table 2 shows the comparison of different datasets along with the accuracy values.
CNN LIDC Dataset1 LIDC Dataset2 LIDC Dataset3 Total number of images
193 160 133
Number
of
images
tested
40 30 25
True
positive
rate
86.76% 86.83% 86.63%
False
positive
rate
13.24% 13.27% 13.37%
Overall
accuracy 93.04% 92% 92.5%
Table 2.Comparision table for different datasets
3. CONCLUSION
The CT captured images are processed. The region of interest i.e., nodule is identified from the original image.
From the extracted region of interest, the features are given to the classifiers which classifies the nodule based on
86.76%.The false positive rate is 13.24%.The overall accuracy obtained is 93.04% For future work, we can
implement this technique on some more images. Increasing the number of images can improve the accuracy.
REFERENCES
[1] S. Hussein, et al., “Risk Stratification Of Lung Nodules Using 3D CNN-Based Multi-task earning," IPMI,
2017.
[2] C. Jacobs, et al., “Automatic detection of subsolid pulmonary nodules in thoracic computed tomography
images," Medical Image Analysis 18, pp.374-384, 2016.
[3] Kumar D, Wong A, and Clausi D. A. (2015), Lung nodule classification using deep features in CT
images.12th Conference on Computer and Robot Vision, pp.133–138, 2015.
[4] S Vishukumar K. Patela and Pavan Shrivastavab “Lung Cancer Classification Using Image Processing”,
International Journal of Engineering and Innovative Technology Vol 2, Issue 3,2014.
[5] Ayman El-Baz, Garth M. Beache, et al., Computer-aided Diagnosis systems for Lung Cancer: Challenges
and Methodologies Review Article, International Journal of Biomedical Imaging, pp. 1-46,2013.
[6] V. Sudha and P. Jayashree, “Lung nodule detection in CT images using thresholding and morphological
operations," International Journal on Emerging Science and Engineering (IJESE) vol.1, 2013.
[7] S. M. N. K. A. K. Dhara, “Computer- aided detection and analysis of pulmonary nodule from CT images:
A survey,” IETE Tech. Rev., Vol. 29,no. 4, pp. 265_75, 2012.
[8] A.Amutha and R.S.D Wahidabanu, “A Novel Method for Lung Tumor Diagnosis and Segmentation using
Level Set- Active Contour Modelling”, European Journal of Scientific Research, Vol.90, No.2,
pp.175-187,2012.
[9] S.Sivkumar,“Lung Nodule Detection Using Fuzzy Clustering and Support Vector Machine ”, International
Journal of Engineering and Technology Vol.5, No. 1, ISSN: 0975-4024, March 2012.
[10] G. Hinton, “Dropout : A simple way to prevent neural networks from overfitting,” J. Mach. Learn. Res.,
vol. 15, pp. 1929–1958, 2012.
[11] C.Farabet, C.Couprie, L.Najman, and Y.LeCun, Learning hierarchical features for scene labeling, IEEE
PAMI, vol. 35 (8), , pp. 1915–1929,2012.
[12] J.A. Stark. Adaptive image contrast enhancement using generalizations of histogram equalization, IEEE
Transactions on Image Processing, vol. 9 (5), pp. 889-896,2011.
[13] J.Schmidhuber. Deep Learning in Neural Networks: An Overview, Neural Networks, vol. 61, pp.85–117,
2011.
[14] S. R. Kannan, A. Sathya, S. Ramathilagam, and R. Devi, “Novel segmentation algorithm in segmenting
medical images,” Journal of Systems and Software, vol. 83, no. 12, pp. 2487–2495, 2010.
[15] L. Sørensen, S. B. Shaker, and M. De Bruijne, “Quantitative analysis of pulmonary emphysema using