EFFECT OF PROCESS
PARAMETERS ON SURFACE
ROUGHNESS IN END MILLING OF
Al/S
i
C
p
MMC
R.AROKIADASS*
Department of Mechanical Engineering, Sri Manakula Vinayagar Engineering College, Puducherry
K. PALANIRADJA
Department of Mechanical Engineering, Pondicherry Engineering College, Puducherry
N. ALAGUMOORTHI
Department of Mechanical Engineering, Pondicherry Engineering College, Puducherry
Abstract
Metal matrix composites (MMCs) have emerged as an important class of materials, which are increasingly being
utilized in recent years. These materials are known as the difficult-to-machine materials because of the hardness and abrasive nature of reinforcements. The present work investigate the effect of spindle speed, feed rate, depth of cut and different % wt. of SiCp on surface roughness in end milling of LM25Al/SiCp.Experiments have been
conducted on a CNC milling machine according to the principles of Response surface methodology design of experiments (DoE) method. Central composite design (CCD) was employed in developing an efficient mathematical model for surface roughness. Analysis of variance (ANOVA) was used to test the adequacy of the developed mathematical model.The contour plots were generated to study the effect of process parameters as well as their interactions.
Keywords: Metal matrix composites (MMC), Response surface methodology (RSM), Surface roughness (Ra),
Contour plots.
1. Introduction
Metal-matrix composites (MMCs) have been increasingly used in industries because of their improved
properties over those of non-reinforced alloys. Among the various types of MMCs, aluminium-based composites
have been found in various engineering applications such as the aerospace and automobile industries. Some of the typical applications are bearings, automobile pistons, cylinder liners, piston rings, connecting rods, sliding electrical contacts, turbo charger impellers, space structures, etc. [1]. High hardness aluminium oxide (Al2O3) or
silicon carbide (SiC) particles are commonly used to reinforce aluminium alloys, but the full application of such
MMCs is, however, cost sensitive because of high machining cost [2]. The machinability of MMCs has received
considerable attention because of high tool wear associated with machining. Although efforts have been made to produce near-net-shape MMC products by casting or hot forging, the need for machining cannot be completely eliminated, and the near-net-shape products still have to be machined into the designed shape and dimension. MMCs reinforced with Al2O3 particles are extremely difficult to machine (turning, milling, drilling, or
threading) due to their extreme abrasive properties [3, 4]. Studies on the machinability of light alloy composites reinforced with Al2O3/SiC fibres/particles [5-7] indicate poor machinability due to the abrasive wear of tools.
Moreover, the quality of the machined surface also deteriorates with tool wear [7].
Several researchers have studied the machining of MMCs. Suresh Kumar Reddy et al. [8] studied
quality of components produced during end milling of Al/SiC particulate metal matrix composites (PMMCs).
Mathematical modeling in terms of process parameters for tool wear has been carried out by many researchers. Oktem et al. [10] developed a mathematical model based on response surface methodology and optimized cutting condition for surface roughness using genetic algorithm. Alauddin et al. [11] predicted the surface roughness of 190 BHN steel after end milling using a mathematical model depending on cutting speed, feed rate and depth of cut. They used the response surface methodology to explore the effect of these parameters on surface roughness. C-olak et al. [12] predicted surface roughness of milling surface related to cutting parameters by using the genetic expression programming method. They considered cutting speed, feed rate and depth of cut of end milling operations for predicting surface roughness and predicted a linear equation for surface roughness related to experimental study.
From the literature it is found that the machining of Al MMC is an important area of research, but only very few studies have been carried out on surface roughness (Ra) in end milling of metal matrix composite. In
the present study, an attempt has been made to investigate the effect of process parameters such as spindle speed, feed rate, depth of cut and different %wt. of SiCp on surface roughness in end milling of LM25Al/SiCp by
RSM approach. The adequacy of the developed mathematical model has also been tested by the analysis of variance test.
2. Design of experiment based on response surface methodology
Response surface modeling was used to establish the mathematical relationship between the response (Yu) and
the various process parameters [13, 14]. The general second order polynomial response surface mathematical model, which analyses the parametric influences on the various response criteria, can be described as follows:
2 0
1 1 1
k k k
u i i ii i i j i j
i i j
Y b b x b x b x x
--- (1)Where Yu is response and xi (1,2, … ,k) are coded levels of k quantitative variables. The coefficient b0 is the
constant term; the coefficients bi, bii, and bij are the linear, quadratic, and interaction terms.
The second term under the summation sign of this polynomial equation is attributable to linear effect, whereas the third term corresponds to the higher-order effect. The fourth term of the equation includes the interactive effects of the process parameters. In this response surface methodology each x-variable can be coded so that the upper level of x is taken as +2 and the lower level as -2 in order to design the experiments in an optimized way. The relationship between the coded and actual parametric values for the different x-variables can be expressed as follows:
Xi =
--- (2)
The actual and coded parametric values for each parameter are listed in Table 1. In this study, the spindle speed (x1), feed rate (x2), depth of cut (X3) and % wt. of SiCp (x4) are taken as process parameters. The surface
roughness is obtained through a series of experiments according to the experimental plan based on central composite rotatable design, as shown in Table 2, to develop the equations of the response surface. Design of experiment (DoE) features of MINITAB-15 software were utilized to obtain the central composite rotatable design and also to determine the coefficients of mathematical modeling based on the response surface regression model.
Table 1 Experimental parameters and their levels
Parameters Unit Symbol Levels
-2 -1 0 +1 -2
Spindle speed Rpm N 2000 2500 3000 3500 4000
Feed rate mm/rev f 0.02 0.03 0.04 0.05 0.06
Depth of cut mm d 0.5 1 1.5 2 2.5
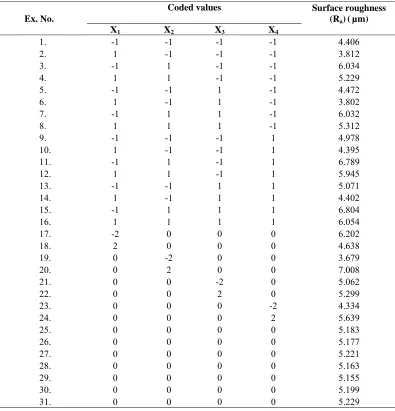
Table 2 Design of Experiment and Results
Ex. No.
Coded values Surface roughness
(Ra)(µm)
X1 X2 X3 X4
1. -1 -1 -1 -1 4.406
2. 1 -1 -1 -1 3.812
3. -1 1 -1 -1 6.034
4. 1 1 -1 -1 5.229
5. -1 -1 1 -1 4.472
6. 1 -1 1 -1 3.802
7. -1 1 1 -1 6.032
8. 1 1 1 -1 5.312
9. -1 -1 -1 1 4.978
10. 1 -1 -1 1 4.395
11. -1 1 -1 1 6.789
12. 1 1 -1 1 5.945
13. -1 -1 1 1 5.071
14. 1 -1 1 1 4.402
15. -1 1 1 1 6.804
16. 1 1 1 1 6.054
17. -2 0 0 0 6.202
18. 2 0 0 0 4.638
19. 0 -2 0 0 3.679
20. 0 2 0 0 7.008
21. 0 0 -2 0 5.062
22. 0 0 2 0 5.299
23. 0 0 0 -2 4.334
24. 0 0 0 2 5.639
25. 0 0 0 0 5.183
26. 0 0 0 0 5.177
27. 0 0 0 0 5.221
28. 0 0 0 0 5.163
29. 0 0 0 0 5.155
30. 0 0 0 0 5.199
31. 0 0 0 0 5.229
3. Experimental work
The experiments were conducted on a HASS vertical machining center: model tool room mill with 12mm diameter, 4 flute carbide end mill cutter under dry condition. The LM25 aluminum alloy (7 Si, 0.33 Mg, 0.3 Mn, 0.5 Fe, 0.1 Cu, 0.1 Ni, 0.2 Ti) reinforced with 5%, 10%, 15%, 20% and 25% weight of silicon carbide of particles size 25 μm was manufactured through stir-casting technique. The dimension of the work piece specimen was 100mm x 60mm x 40mm. The surface roughness of the machined test specimens was measured using a Talysurf tester.
4. Mathematical modeling
The mathematical relationship, obtained for analyzing the influences of the various dominant process parameters on the surface roughness criteria is given by:
Ra = 4.716 – (0.002 X1) + (61.948 X2) + (0.050 X3 ) + (0.099 X4) + (365.551 X22) – (0.017 X32) – (0.002 X42)
– (0.008 X1 X2) + (0.612 X2 X3) + (0.789 X2 X4)+ (0.002 X3 X4)
---(3) Where Ra is surface roughness and X1, X2, X3, and X4 represent the decoded values of spindle speed (N), feed
5. Analysis of the developed mathematical model for surface roughness
The analysis of variance (ANOVA) and the F-ratio test have been performed to justify the goodness of fit of the mathematical model. The calculated values of F ratio for lack of fit have been compared to standard values of F ratio corresponding to their degrees of freedom to find the adequacy of the developed mathematical model. The F ratio has been calculated as a ratio of mean sum of square of source to mean sum of experimental error.
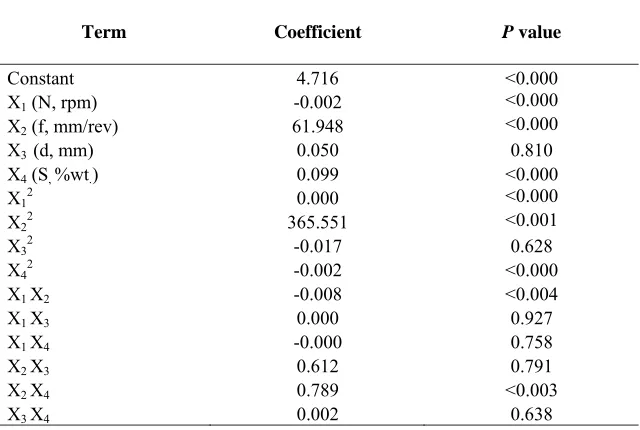
Table 3 Regression analysis of surface roughness (Ra)
Term Coefficient P value
Constant 4.716 <0.000
X1 (N, rpm) -0.002 <0.000
X2 (f, mm/rev) 61.948 <0.000
X3 (d, mm) 0.050 0.810
X4 (S, %wt.) 0.099 <0.000
X12 0.000 <0.000
X22 365.551 <0.001
X32 -0.017 0.628
X42 -0.002 <0.000
X1 X2 -0.008 <0.004
X1 X3 0.000 0.927
X1 X4 -0.000 0.758
X2 X3 0.612 0.791
X2 X4 0.789 <0.003
X3 X4 0.002 0.638
The fit summary recommended that the quadratic model is statistically significant for analysis of surface roughness. The results of quadratic model for surface roughness are shown in Table 3. The value of R2 for
surface roughness is 99.85%, which means that the regression model provides an excellent explanation of the relationship between the independent variables (parameters) and the response (Ra).
Table 4 Analysis of variance for surface roughness (Ra)
Source of variation
Degree of freedom
Sum of squares
Mean sum of squares
F- value p- value
Regression 14 22.0127 1.572334 763.09 0.000
Linear 4 21.7361 0.078294 38.00 0.000
Square 4 0.2282 0.057041 27.68 0.000
Interaction 6 0.0485 0.008076 3.92 0.013
Residual Error 16 0.0330 0.002060
Lack of fit 10 0.0282 0.002823 3.58 0.066
Pure Error 6 0.0047 0.000789
Total 30 22.0456
The associated P value for the model is lower than 0.05 (i.e., p=0.05 or 95% confidence), which indicates that the model is considered statistically significant. The P values of regression analysis of surface roughness indicates that linear effect of spindle speed, feed rate and percentage weight of SiCp are significant. In Square
terms, spindle speed , feed rate and percentage weight of SiCp are significant. In interaction terms, spindle speed
- feed rate and feed rate - %wt. SiCpare significant. The standard percentage point of F distribution for 95%
6. Result and discussion
Based on the mathematical model given by Eq. 3, the effects of various machining parameters on surface roughness (Ra) has been made so as to analyze the suitable parametric combinations that can be made for
achieving controlled surface roughness. The contour plots were drawn for various combinations. The number that represent in the contour plot is surface roughness (Ra).
The direct effects of spindle speed, feed rate, depth of cut and %wt. SiCp were experimentally
investigated. It is understood that increase in spindle speed reduces the surface roughness. Increase in spindle speed vanishes the built-up-edge formation, which reduces the surface roughness value 6.202 µm – 4.638 µm at f= 0.04 mm/rev, d=1.5mm and S=15%wt.
2000 2500 3000 3500 4000
4.6 4.8 5.0 5.2 5.4 5.6 5.8 6.0 6.2 6.4
Sur
fa
ce
ro
ug
hn
ess (Ra
)
Spindle speed (N)
f=0.04 mm/rev d=1.5 mm S=15%
Fig 1. Direct effect of spindle speed
0.02 0.03 0.04 0.05 0.06
3.5 4.0 4.5 5.0 5.5 6.0 6.5 7.0 7.5
Surf
ac
e r
o
ug
hn
es
s (
R
a
)
Feed rate (f)
N=3000 RPM d=1.5 mm S=15%
Fig 2. Direct effect of feed rate
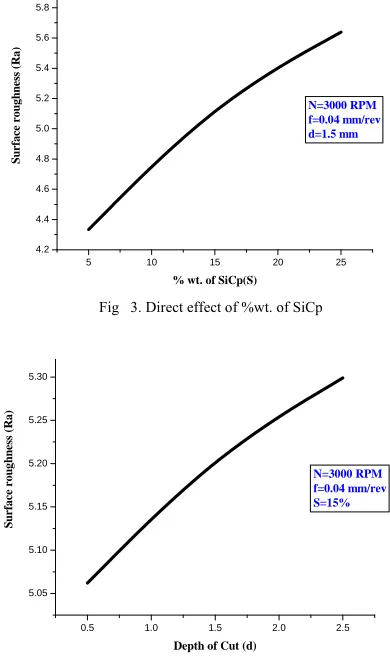
Also increase in feed rate increases the surface roughness. Increase in feed rate increases the chatter and heat generation, which increases the surface roughness values from 3.679µm – 7.008µm at N=3000rpm, d=1.5mm and S=15%wt. Decrease in %wt. SiCp reduces the surface roughness. Increase in %wt. of SiCp increases the
5 10 15 20 25 4.2
4.4 4.6 4.8 5.0 5.2 5.4 5.6 5.8
Surf
a
ce
r
o
ug
h
n
es
s (
R
a
)
% wt. of SiCp(S)
N=3000 RPM f=0.04 mm/rev d=1.5 mm
Fig 3. Direct effect of %wt. of SiCp
0.5 1.0 1.5 2.0 2.5
5.05 5.10 5.15 5.20 5.25 5.30
Sur
fa
ce
r
o
ug
hne
ss
(
R
a
)
Depth of Cut (d)
N=3000 RPM f=0.04 mm/rev S=15%
Fig 4. Direct effect of depth of cut
Strong interaction was observed between various process parameters for surface roughness. The most significant interaction effect was found between spindle speed - feed rate and feed rate - %wt. SiCp. The contour
graph between these most significant process parameter interactions are studied below.
Figure 5 shows that the interaction effect of spindle speed and feed rate. The surface roughness (Ra) decreases as the spindle speed (s) increases. At low spindle speed (s), the unstable larger BUE is formed and also the chips fracture readily producing the rough surface. As the spindle speed (s) increases, the BUE vanishes, chip fracture decreases, and, hence, the roughness decreases [15]. Also minimum surface roughness, were obtained at the lowest level of feed rate. The reason being, the increase in feed increases the heat generation and hence, tool wears, which results in higher surface roughness. The increase in feed also increases the chatter, and it produces incomplete machining of work piece, which led to higher surface roughness. The best surface finish was achieved at the lowest feed rate and highest spindle speed combination.
Figure 6 shows that the interaction effect of feed rate and %wt. SiCp. The surface roughness (Ra)
decreases as the feed rate (f) decreases. But the surface roughness (Ra) increases with the increase in %wt. SiCp
(S). The reason being, addition of reinforcing materials which are normally harder and stiffer than the matrix, machining becomes significantly more difficult than in the case for conventional materials [16, 17]. The best surface finish was achieved at the lowest feed rate and lowest %wt. SiCp combination.
Figure 7 shows that the interaction effect of spindle speed and %wt. SiCp. The surface roughness (Ra)
7
6
5
4
Spindle speed (N)
Feed
r
a
te
(
f)
4000 3500
3000 2500
2000 0.06
0.05
0.04
0.03
0.02
DOC 1.5
%wt. of SiCp 15 Hold Values
Fig 5. Effect of spindle speed (N) and feed rate (f) on surface roughness (Ra)
Fig 6. Effect of feed rate (f) and %wt. of SiCp (S) on surface roughness (Ra) 7 6
5 4
Feed rate (f)
%
w
t.
o
f S
iC
p
(S
)
0.06 0.05
0.04 0.03
0.02 25
20
15
10
5
Speed 3000
DOC 1.5
6.0
5.5
5.0
4.5
4.0
Spindle speed (N)
%
w
t.
o
f S
iC
p
(S
)
4000 3500
3000 2500
2000 25
20
15
10
5
Feed 0.04 DOC 1.5 Hold Values
Fig 7. Effect of spindle speed (N) and %wt. of SiCp (S) on surface roughness (Ra)
From the above results, the minimum surface roughness (Ra) values for machining metal matrix composites obtained at maximum spindle speed, minimum feed rate, less depth of cut and less %wt. SiCp were
studied.
7. Conclusion
The following conclusions were derived from the investigation.
1. An empirical relationship was developed to predict the surface roughness of metal matrix composite (LM25 Al/SiCp) at the 95 percent confidence level, incorporating end milling process and process parameters.
2. Response surface methodology used to develop a mathematical model to predict surface roughness in terms of spindle speed, feed rate, depth of cut and % wt. of SiCp.
3. The model indicates that the feed rate was the most dominant parameter on surface roughness followed by spindle speed and %wt. ofSiCp
.
Depth of cut has less influence on surface roughness.4. The interactions between the process parameters were analyzed and strong interactions were observed between Feed rate-Spindle speed and Feed rate-% wt. of SiCp on surface roughness.
5. The surface roughness model produced during this research work may be used in enhancing the surface quality of a product as process parameters are optimized and can give better surface finish.
Acknowledgment
The author would like to extend his gratitude for the support and technical assistance rendered by Mr.Tamilselvam and Mr.Jesu Bruno in machining.
References
[1] Ding X, Liew WYH, Liu XD. Evaluation of machining performance of MMC with PCBN and PCD tools, Wear 259:1225– 1234 (2005)
[2] N.P. Hung, F.Y.C. Boey, K.A. Khor, et al., Machinability of cast and powder-formed aluminum alloys reinforced with SiC particles, J.Mater. Process. Technol., 48, p.291 ((1995)
[3] S.Durante, G. Rutelli, and F. Rabezzana. Aluminum-based MMC machining with diamond-coated cutting tools, Surf.Coat. Technol., 94-95,p.632 (1997)
[4] Y. Sahin, M. Kok, and H. Celik. Tool wear and surface roughness of Al2O3 particle-reinforced aluminium alloy composites, J. Mater. Process. Technol., 128, p.280 (2002)
[6] L. Cronjäger and D. Meister. Machining of fibre and particle reinforced aluminium, CRIP Ann., 41, No.1, p.63 (1992)
[7] H. Chandrasekaran and J.O. Johansson. Influence of processing conditions and reinforcement on the surface quality of finish machined aluminium alloy matrix composites, CRIPAnn., 46, No.1, p.493 (1997)
[8] Suresh Kumar Reddy N, Shin K-S,Minyang Y. Experimental study of surface integrity during end milling of Al/SiC particulate metal– matrix composites, J Mater Process Technol 201:574–579 (2008)
[9] Ozben T, Kilickap E, Cakır O. Investigation of mechanical and machinability properties of SiC particle reinforced Al- MMC, J Mater Process Technol 198:220–225 (2008)
[10] H.Oktem, T. Erzurumlu and H. Kurtaran. Application of response surface methodology in the optimization of cutting conditions for surface roughness, Journal of Material Processing and Technology 170, pp. 11 – 16 (2005).
[11] Alauddin M, El Baradie MA, Hashmi MSJ. Computer-aided analysis of a surface-roughness model for end milling, J Mater Process Technol;55:123–7 (1995)
[12] C-olak O, Kurbano˘glu C, KayacanMC. Milling surface roughness prediction using evolutionary programming methods. Mater Des; 28:657–66 (2007)
[13] Doloi BN, Bhattacharyya B, Sarkar BR. Response surface methodology based parametric analysis on electrochemical discharge machining of silicon nitride ceramics. Proceedings of the 20th AIMTDR Conference, Ranchi, India, 2002, pp 248–254 (2002) [14] Cockran WG, Cox GM. Experimental designs, 2nd edn. Asia Publishing House, New Delhi (1977)
[15] Palanikumar K, Karthikeyan R. Assessment of factors influencing surface roughness on the machining of Al/SiC particulate composites, Mater Des 28:1584–1591 (2007)
[16] Monaghan.J.M., P.O’ Reilly. The drilling of an Al /SiC, journal of material Process Technol (1992)