
DEVELOPMENT AND VALIDATION OF HPTLC METHOD FOR SIMULTANEOUS DETERMINATION OF PAMABROM AND PARACETAMOL IN SYNTHETIC MIXTURE
5
0
0
Full text
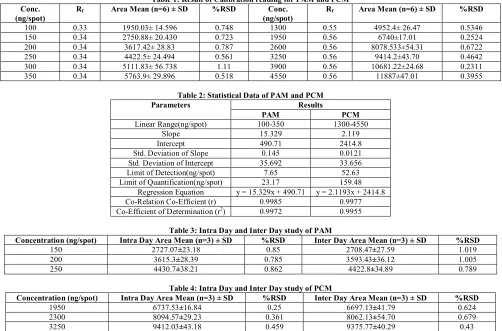
(2) Prajapati Premal P et al. IRJP 2012, 3 (11) solvent fronting due to high content of chloroform. Then acetonitrile was incorporated to the mobile phase composition and tried with different ratios. By decreasing the chloroform in mobile phase composition solvent fronting was resolved and ultimately, mobile phase consisting chloroform and acetonitrile (5: 5 v/v) showed good resolution without solvent fronting. Both the peaks were symmetrical in nature and no tailing was observed when plate was scanned at 277 nm. The chamber was saturated with the mobile phase for 30 min at room temperature. Linearity Linearity responses for PAM and PCM were assessed in the concentration range 100-350 ng/spot and 1300-4550 ng/spot of standard solutions, respectively. Precision Precision of the method was determined in the terms of intraday and inter-day variation (%RSD). Intra-day precision (%RSD) was assessed by analyzing standard drug solutions within the calibration range, three times on the same day. Inter-day precision (%RSD) was assessed by analyzing drug solutions within the calibration range on three different days over a period of 7 days. Accuracy To the pre-analyzed sample a known amount of standard solution of pure drug (PAM and PCM) was spiked at three different levels. These solutions were subjected to re-analysis by the proposed method. Sensitivity The sensitivity of measurement of PAM and PCM by the use of proposed method was estimated in terms of Limit of Detection (LOD) and Limit of Quantitation (LOQ). The LOD and LOQ were calculated by equation. Conc. (ng/spot) 100 150 200 250 300 350. Rf 0.33 0.34 0.34 0.34 0.34 0.34. Specificity Specificity of the method was ascertained by analyzing standard drug and sample. The mobile phase resolved both the drugs very efficiently as shown in Figure 7. The spot for PAM and PCM was confirmed by comparing the Rf and spectra of the spot with that of standard. The wavelength 277 nm for detecting peak purity of PAM and PCM was assessed by comparing the spectra at three different levels, i.e., peak start (S), peak apex (M) and peak end (E) positions of the spot. Repeatability Repeatability of sample application was assessed by spotting 8μL (200 ng/spot of PAM and 2600 ng/spot of PCM) of drug solution six times on a TLC, followed by development of plate and recording the peak area for six spots. Analysis of PAM and PCM in synthetic mixture Pamabrom (25 mg) and paracetamol (325 mg) standard drug powders were accurately weighed and then mixed with commonly used formulation excipients (113.35 mg avicel PH-101, 1.65 mg stearic acid11). The synthetic mixture was then transferred to 100 mL volumetric flask containing 50 mL methanol and sonicated for 20 min. The solution was filtered through 0.45 μm filter (Millifilter, MA) and the volume was adjusted up to mark with methanol. From the above solution 1 mL was taken into a 10 mL volumetric flask and the volume was adjusted up to mark with methanol to get a final concentration of PAM (25 μg/mL) and PCM (325 μg/mL). 6μL of this solution applied on TLC plate followed by development and scanning & the analysis was repeated for three times.. Table 1: Result of Calibration reading for PAM and PCM Area Mean (n=6) ± SD %RSD Conc. Rf (ng/spot) 1950.03± 14.596 0.748 1300 0.55 2750.88± 20.430 0.723 1950 0.56 3617.42± 28.83 0.787 2600 0.56 4422.5± 24.494 0.561 3250 0.56 5111.83± 56.738 1.11 3900 0.56 5763.9± 29.896 0.518 4550 0.56. Area Mean (n=6) ± SD. %RSD. 4952.4± 26.47 6740±17.01 8078.533±54.31 9414.2±43.70 10681.22±24.68 11887±47.01. 0.5346 0.2524 0.6722 0.4642 0.2311 0.3955. Table 2: Statistical Data of PAM and PCM Parameters Results PCM PAM Linear Range(ng/spot) 100-350 1300-4550 Slope 15.329 2.119 490.71 2414.8 Intercept Std. Deviation of Slope 0.145 0.0121 35.692 33.656 Std. Deviation of Intercept Limit of Detection(ng/spot) 7.65 52.63 Limit of Quantification(ng/spot) 23.17 159.48 Regression Equation y = 15.329x + 490.71 y = 2.1193x + 2414.8 Co-Relation Co-Efficient (r) 0.9985 0.9977 0.9972 0.9955 Co-Efficient of Determination (r2). Concentration (ng/spot) 150 200 250. Table 3: Intra Day and Inter Day study of PAM Intra Day Area Mean (n=3) ± SD %RSD Inter Day Area Mean (n=3) ± SD 2727.07±23.18 0.85 2708.47±27.59 3615.3±28.39 0.785 3593.43±36.12 4430.7±38.21 0.862 4422.8±34.89. %RSD 1.019 1.005 0.789. Concentration (ng/spot) 1950 2300 3250. Table 4: Intra Day and Inter Day study of PCM Intra Day Area Mean (n=3) ± SD %RSD Inter Day Area Mean (n=3) ± SD 6737.53±16.84 0.25 6697.13±41.79 8094.57±29.23 0.361 8062.13±54.70 9412.03±43.18 0.459 9375.77±40.29. %RSD 0.624 0.679 0.43. Page 168.
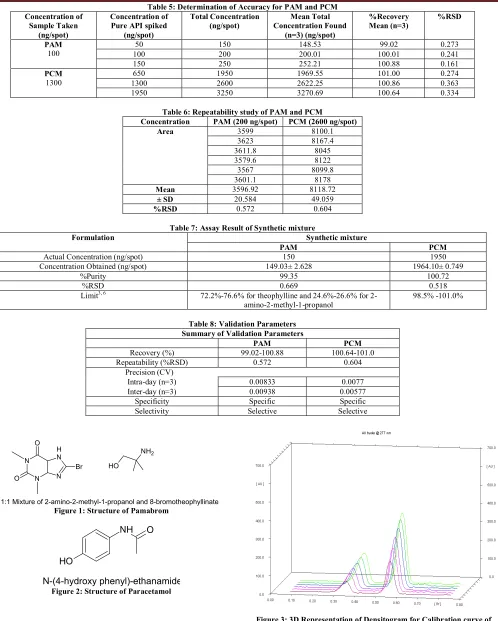
(3) Prajapati Premal P et al. IRJP 2012, 3 (11) Concentration of Sample Taken (ng/spot) PAM 100 PCM 1300. Table 5: Determination of Accuracy for PAM and PCM Concentration of Total Concentration Mean Total Pure API spiked (ng/spot) Concentration Found (ng/spot) (n=3) (ng/spot) 50 150 148.53 100 200 200.01 150 250 252.21 1950 1969.55 650 1300 2600 2622.25 1950 3250 3270.69. %Recovery Mean (n=3). %RSD. 99.02 100.01 100.88 101.00 100.86 100.64. 0.273 0.241 0.161 0.274 0.363 0.334. Table 6: Repeatability study of PAM and PCM Concentration PAM (200 ng/spot) PCM (2600 ng/spot) 3599 8100.1 Area 3623 8167.4 8045 3611.8 3579.6 8122 3567 8099.8 8178 3601.1 3596.92 8118.72 Mean 20.584 49.059 ± SD 0.572 0.604 %RSD Formulation Actual Concentration (ng/spot) Concentration Obtained (ng/spot) %Purity %RSD Limit3, 6. Table 7: Assay Result of Synthetic mixture Synthetic mixture PAM 150 149.03± 2.628 99.35 0.669 72.2%-76.6% for theophylline and 24.6%-26.6% for 2amino-2-methyl-1-propanol. Table 8: Validation Parameters Summary of Validation Parameters PAM Recovery (%) 99.02-100.88 Repeatability (%RSD) 0.572 Precision (CV) Intra-day (n=3) 0.00833 Inter-day (n=3) 0.00938 Specific Specificity Selectivity Selective. O N O. H N. PCM 100.64-101.0 0.604 0.0077 0.00577 Specific Selective. NH2 Br. N. PCM 1950 1964.10± 0.749 100.72 0.518 98.5% -101.0%. HO. N. 1:1 Mixture of 2-amino-2-methyl-1-propanol and 8-bromotheophyllinate. Figure 1: Structure of Pamabrom. NH. O. HO N-(4-hydroxy phenyl)-ethanamide Figure 2: Structure of Paracetamol Figure 3: 3D Representation of Densitogram for Calibration curve of PAM and PCM. Page 169.
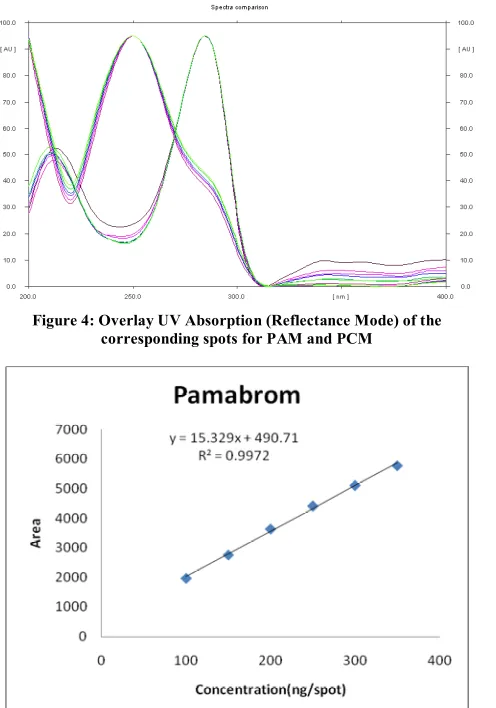
(4) Prajapati Premal P et al. IRJP 2012, 3 (11). Figure 4: Overlay UV Absorption (Reflectance Mode) of the corresponding spots for PAM and PCM. Figure 6: Calibration curve of PCM in Methanol at 277 nm. Figure 5: Calibration curve of PAM in Methanol at 277 nm. Figure 7: HPTLC Chromatogram of Standard PAM and PCM in mixture. RESULT AND DISCUSSION Method development The TLC procedure was optimized for simultaneous determination of PAM and PCM. The mobile phase Chloroform: Acetonitrile (5: 5 v/v) resulted in good resolution with sharp and symmetrical peaks of Rf 0.34 ± 0.004 for PAM and 0.56 ± 0.004 for PCM. It was observed that pre-washing of TLC plates with methanol (followed by drying and activation) and pre-saturation of TLC chamber with mobile phase for 30 min (optimum chamber saturation time) ensured reproducibility and proper peak shape of both drugs (Figure 3 and 7). Validation Linearity Linear regression data for the calibration plots revealed linear relationships between area and concentration over the ranges 100-350 ng/spot for PAM and 1300-4550 ng/spot for PCM. The linear equations for the calibration plots were y = 15.329x + 490.71 and y = 2.1193x + 2414.8 with correlation coefficient (r) being 0.9973 and 0.9984 for PAM and PCM, respectively (Table 1 and 2). Precision The precision of the method was expressed as relative standard deviation (RSD, %). The results listed in Table 3 and 4 reveal the high precision of the method. Accuracy When the method was used for accuracy and subsequent analysis of both drugs from the synthetic mix, and spiked with 50, 100, and 150% of additional drug, the recovery was 99.02- 100.88 % for PAM and 100.64- 101.0 % for PCM (Table 5).. Sensitivity The LOD and LOQ were calculated by equation. The LOD and LOQ values were 7.65 and 52.63 ng/spot for PAM and 23.17 and 159.48 ng/spot for PCM. Specificity The peak purity of PAM and PCM was assessed by comparing their respective spectra at peak start, apex and peak end positions of the spot i.e., r (S, M) = 0.9997 and r (M, E) =0.9993 for PAM and r (S, M) = 0.9991 and r (M, E) = 0.9995 for PCM. Good match was obtained between standard and sample spectra of PAM and PCM respectively. (Figure 4) Repeatability The % RSD for peak area values of PAM and PCM was found to be 0.572 and 0.604, respectively as given in Table 6. Analysis of PAM and PCM in synthetic mixture When synthetic mixture was analyzed, PAM and PCM gave sharp and well defined peaks at Rf 0.34± 0.004 and 0.56± 0.004, respectively, when scanned at 277 nm. The results in Table 7 indicate that there was no interference from the excipients commonly present in the tablets. The % purity was 99.35% for PAM and 100.72% for PCM. CONCLUSION The developed HPTLC method is simple, precise, accurate and reproducible and can be used in future for simultaneous determination of PAM and PCM in tablets as method gave results within range for synthetic mixture. The method was validated as per International Conference on Harmonization (ICH) guidelines. Page 170.
(5) Prajapati Premal P et al. IRJP 2012, 3 (11) ACKNOWLEDGEMENT Authors are thankful to Suven Lifesciences, Hyderabad for gratis sample of Pamabrom as well as Sophisticated Instrumentation Center for Applied Research & Testing (SICART), Vallabh Vidyanagar for providing facilities to complete this work successfully. REFERENCES 1. Pamabrom drug profile, [cited 2012 July 7], Available from: http://en.wikipedia.org/wiki/Pamabrom 2. Drug information of Paracetamol and Pamabrom, [2012 September 30], Available from: http://druginformationdirectory.blogspot.in/2010/05/acetaminophen-and-pamabrom.html 3. United State Pharmacopoeia- 34 and National Formulary-29, Asian edition, United State Pharmacopoeia Convention, Rockville, MD, USA, 2011; Vol II: 1720,3800. 4. Chen Z, Wen J, Li J, “Determination of pamabrom in pamabrom and pamabrom paracetamol tablets using RP-HPLC”, Journal of Zhengzhou University(Medical Sciences),2008;1.. Paracetamol drug profile,[Cited 2012 July 7], Available from: http://en.wikipedia.org/wiki/Paracetamol 6. Indian pharmacopoeia, Ministry of health and family welfare, 6th edition, Indian Pharmacopoeial Commission, Ghaziabad, India, 2010; 2: 1859-61. 7. British pharmacopoeia, 6th edition, The Stationary Office, London Medicines and Healthcare Product Regulatory Agency, 2010;Vol II: 1612. 8. Japanese Pharmacopoeia, Society of Japanese Pharmacopoeia, 15th edition, Shibuya Tokyo, Japan, 2006: 267-68. 9. Zhou L, Gu L, Wang Y, “Determination of two constituents in compound acetaminophen and pamabrom tablets in human plasma by high performance liquid chromatography”, Ch J of new drugs and Cli Rem, 2007;26:187-190. 10. ICH, Q2B (R1) Validation of Analytical Procedure: Methodology, International Conference on Harmonization, IFPMA, Geneva, Switzerland. 11. Lachman L, Lieberman HA, “The Theory and practice of industrial pharmacy”, Special Indian dition, CBS publishers and distributors, 2009, 344. 5.. Source of support: Nil, Conflict of interest: None Declared. IRJP is an official publication of Moksha Publishing House. Website: www.mokshaph.com. All rights reserved.. Page 171.
(6)
Figure
Related documents
6.1 The future challenge of Chinese liquid chemicals transportation 48 6.1.1The al-right expectation of world chemicals shipping market 48 6.1.2The steady increase of future
The cutoff point of pleural IL-33 level for the diagnosis of tubercu- lous pleural effusion was 19.16 ng/l with sensitivity of 91.7%, specificity of 96.4% and the cutoff point
Initial watershed conditions on the forecast date (1 March for spring freshet and 1 June for summer low-water period) were simulated by the hydrological model forced by
This article is concerned with the effect of slip boundary condition on two-dimensional creeping movement of a Newtonian fluid in the existence of pervious medium with wall features
Interestingly, predictions made by IPA were pointing towards directional changes in functions which may lead to a decreased risk of cancer among individuals with high scores for
The purpose of the study was to quantify through 3D computer modelling whether the new TFNA nail, with a 1.0-m bow design, provides a better anatomical fit com- pared with an
Main Fuel Line Reserve Fuel Line Fuel outlet Fuel Control Knob Tank to change over the.. position of the
It operates on only one condition at a time like if we using soil moisture sensor to control automated drip irrigation then whenever soil moisture level is get
