warwick.ac.uk/lib-publications
A Thesis Submitted for the Degree of PhD at the University of Warwick
Permanent WRAP URL:
http://wrap.warwick.ac.uk/111126
Copyright and reuse:
This thesis is made available online and is protected by original copyright. Please scroll down to view the document itself.
Please refer to the repository record for this item for information to help you to cite it. Our policy information is available from the repository home page.
3
Volatile Organic Compound and Microbiome
profiling in patients with colorectal cancer,
their spouses and first degree relatives
By
Dr Michael McFarlane
MBChB, MBiolSci, MRCP (UK)
A thesis submitted to
The University of Warwick Medical School
For the degree of
DOCTOR OF MEDICINE
4
Table of Contents
List of Tables . . . 9
List of Figures . . . 11
Acknowledgements . . . 16
Dedication . . . 18
Declaration . . . 19
Synopsis . . . 20
Abbreviations . . . 21
Chapter 1: Introduction . . . 24
Chapter 2: Colorectal Cancer, Volatile Organic Compounds and the Microbiome . . . . 28
2.1. Colorectal Cancer . . . 29
2.1.1. Epidemiology . . . 29
2.1.1.1. Incidence. . . 29
2.1.1.2. Mortality. . . 30
5
2.1.2.1. Age . . . 32
2.1.2.2. Sex . . . 32
2.1.2.3. Genetic Predisposition . . . 32
2.1.2.4. Family History . . . 34
2.1.2.5. Personal Medical History . . . 35
2.1.2.6. Obesity . . . 36
2.1.2.7. Physical Activity . . . 36
2.1.2.8 Diet . . . 37
2.1.2.8.i. Fruits and vegetables . . . 37
2.1.2.8.ii. Red and Processed Meat . . . 37
2.1.2.8.iii. Fibre . . . 37
2.1.2.8.iv. Calcium and dairy . . . 38
2.1.2.8.v. Micronutrients . . . 38
2.1.2.9. Smoking . . . 39
2.1.2.10. Alcohol . . . 39
2.1.2.11. Medication . . . 39
6
2.1.4. Treatment . . . 46
2.1.5. Bowel Cancer Screening Programme . . . . 48
2.1.5.1. Background . . . 48
2.1.5.2. Effectiveness . . . 49
2.1.5.3. Future . . . 50
2.2. Volatile Organic Compounds . . . 54
2.2.1. Background and Animal Studies . . . . 55
2.2.2. Current and future technologies and VOC sample type . 58 2.2.3. Mechanical VOC detection . . . 63
2.2.3.1. Initial Progress . . . 63
2.2.3.2. Lung Cancer . . . 64
2.2.3.3. Gastrointestinal Cancer . . . 71
2.2.3.4. Breast Cancer . . . 78
2.2.3.5. Other Cancer . . . 80
2.2.4. VOC generation . . . 83
7
2.3. The Microbiome in health and CRC . . . . 93
Chapter 3: Materials and Methods . . . . . 101
3.1. Ethical Approval . . . 102
3.2. Subject Recruitment and sample collection . . . 102
3.2.1. Patient Recruitment . . . 102
3.2.2. Relative and Co-habitor/Spouse recruitment . . . 103
3.2.3. Urine collection, storage and transfer . . . . 103
3.2.4. Faeces collection, storage and transfer . . . 104
3.3. Sample analysis . . . 105
3.3.1. LC-ultraFAIMS-MS . . . 105
3.3.1.2. Statistical analysis . . . 110
5.3.1.2.a Data processing . . . 110
5.3.1.2.b. Statistical methods . . . 115
3.3.2. FAIMS . . . 117
3.3.2.1 Statistical analysis . . . 121
3.3.2.2. Variation of mean of matrices from baseline . . 123
8
3.3.3. rRNA sequencing . . . 126
3.3.3.1. Bacterial DNA extraction . . . 126
3.3.3.2. DNA quantification . . . 128
3.3.3.3. Polymerase Chain Reaction . . . 128
3.3.3.4. Post-PCR DNA purification . . . 132
3.3.3.5. Illumina 16s rRNA gene sequencing library preparation . 133 3.3.3.6. Illumina 16s rRNA sequencing . . . . 136
3.3.3.7. Processing of the 16s rRNA gene fragment sequences . 136 3.4. Literature search . . . 139
CHAPTER 4: Characterisation of VOC degradation over time at room temperature for healthy individuals . . . . . 140
4.1. Introduction . . . 141
4.2. Methods . . . 143
4.3. Results . . . 144
4.3.1. VOC variation . . . 145
4.3.2. Relative variation in total ion count . . . . 161
9
CHAPTER 5: Urinary VOC profiling of colorectal cancer patients, their first
degree relatives and co-habitors . . . 174
5.1. Introduction . . . 175
5.2. Methods . . . 176
5.3. Results . . . 177
5.4. Discussion . . . 195
CHAPTER 6: Urinary VOC profiling of colorectal cancer patients prior to and after treatment and by disease site and referral method . . 201
6.1. Introduction . . . 202
6.2. Methods . . . 203
6.3. Results . . . 204
6.4. Discussion . . . 226
CHAPTER 7: Stool 16s RNA profiling of colorectal cancer patients, their first degree relative and co-habitors . . . 230
7.1. Introduction . . . 231
7.2. Methods . . . 232
7.3. Results . . . 233
10
CHAPTER 8: Stool 16s RNA profiling of colorectal cancer patients prior to and
after treatment . . . 252
8.1. Introduction . . . 253
8.2. Methods . . . 254
8.3. Results . . . 255
8.4. Discussion . . . 268
CHAPTER 9: Final Discussions . . . 272
BIBLIOGRAPHY . . . 281
11 List of Tables
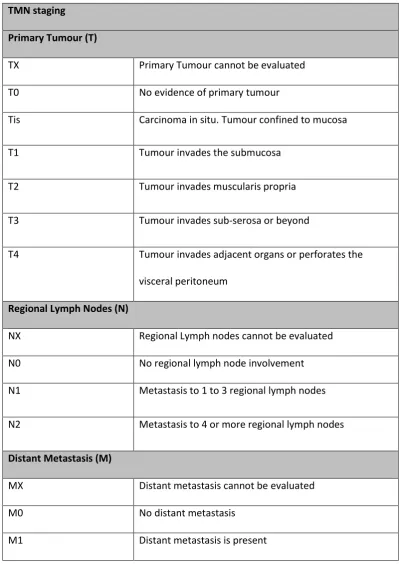
Chapter 2: Colorectal Cancer, Volatile Organic Compounds and the Microbiome
Table 2.1. Full TNM staging criteria. . . . 44
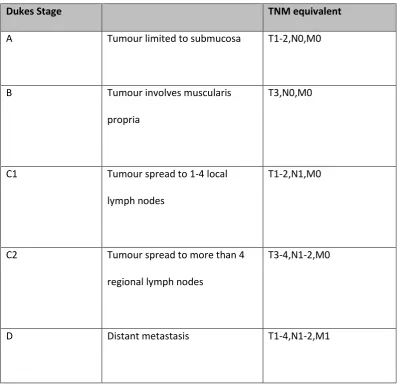
Table 2.2. Dukes staging and equivalent TNM stage . . . 45
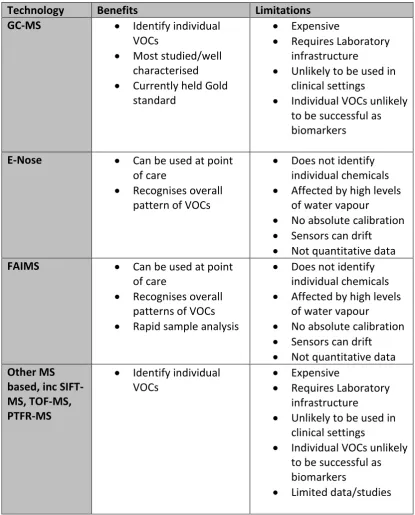
Table 2.3. Summary of the benefits and limitations of the various technologies
which are currently being used for detection of cancers by VOC analysis 59
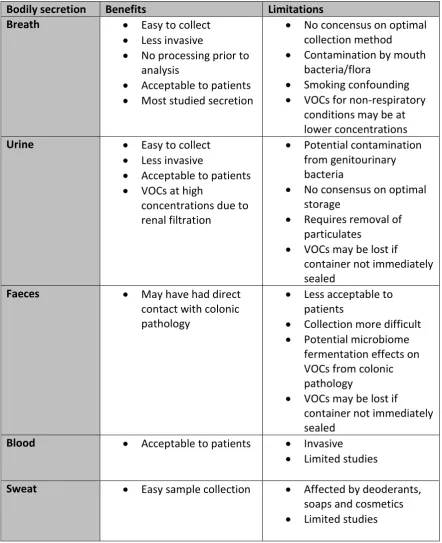
Table 2.4. Summary of the benefits and limitations of the various bodily
secretions currently being studied for cancer detectionby VOC analysis 89
Chapter 3: Materials and Methods
Table 3.1. Table of unique forward and reverse PCR primers . 134
Chapter 5: Urinary VOC profiling of colorectal cancer patients, their first degree
relatives and co-habitors
Table 5.1. Demographic data from recruited subjects . . 179
Chapter 7: Stool 16s RNA profiling of colorectal cancer patients, their first
degree relative and co-habitors
Table 7.1. Demographic data from recruited pre-treatment CRC patients, their
first degree relatives and co-habitors/spouses . . . 235
Table 7.2. Table of OTUs which were statistically significant in distribution
between the pre-operative CRC samples and all controls . . 240-42
Table 7.3. Table of OTUs which were statistically significant in distribution between
12
Table 7.4. OTUs showing statistically significant altered abundance in both whole
group and subset analysis of pre treatment CRC subjects and controls 246
Table 7.5. Table of OTUs which were statistically significant in distribution between
the relative and spouse control groups . . . 247
Chapter 8: Stool 16s RNA profiling of colorectal cancer patients prior to and
after treatment
Table 8.1. Duke’s stages of the pre-treatment CRC group, the 3/12 and 6/12
samples of the same group . . . 257
Table 8.2. Anatomical distribution of the pre-treatment CRC group, the 3/12 and
6/12 samples of the same group . . . 257
Table 8.3. Table of OTU which were statistically significant in distribution between
the pre-operative and 3 month post operative samples 260
Table 8.4. Table of OTU which were statistically significant in distribution between
the pre-operative and 6 month post operative samples 264
Table 8.5. Table of OTUs which were statistically significant in distribution
13 List of Figures
Chapter 2: Colorectal Cancer, Volatile Organic Compounds and the Microbiome
Figure 2.1. Results of Arasaradnam et al, demonstrating distinction of CRC from
healthy controls via urinary VOC detection using a FAIMS instrument 75
Figure 2.2. Results of Westenbrink et al, demonstrating distinction of CRC from
healthy controls and IBS controls via urinary VOC detection using a bespoke
E-nose . . . 75
Chapter 3: Materials and Methods
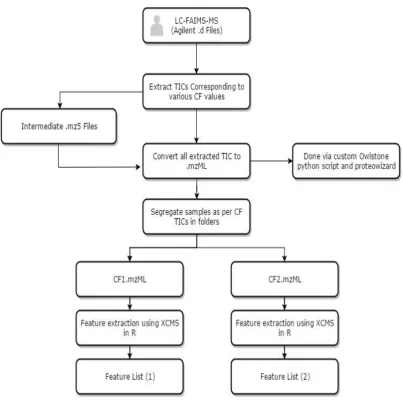
Figure 3.1. Workflow summary of data processing and extraction process 112
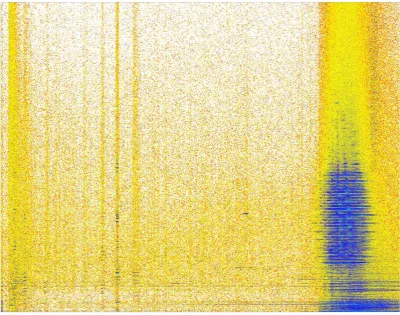
Figure 3.2. Example .mzML output file displayed on a log colour map 113
Figure 3.3. Example section of output .csv file . . . 114
Figure 3.4. Diagram of the FAIMS process. . . . . 119
Figure 3.5a and b. Example of a positive and negative FAIMS plumes 122
Figure 3.6. SDS-PAGE of the PCR with 16S v3/V4 specific primers . 131
Chapter 4: Characterisation of VOC degradation over time at room temperature
for healthy individuals
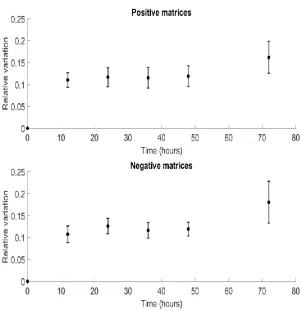
Figure 4.1a and b. Variation of positive and negative FAIMS matrices from time
14
Figure 4.2a. Positive matrices, difference from baseline with time . 148
Figure 4.2b. Negative matrices, difference from baseline with time . 149
Figure 4.3a. Pairwise relative differences for all pairs of positive matrices 151
Figure 4.3b. Pairwise relative differences for all pairs of negative matrices 152
Figure 4.4a. Relative variation from baseline for positive matrices . 154
Figure 4.4b. Relative variation from baseline for negative matrices . 155
Figure 4.5a. Differences from baseline for positive matrices . . 157
Figure 4.5b. Differences from baseline for negative matrices . 158
Figure 4.6a and b. Mean variation of positive and negative matrices 160
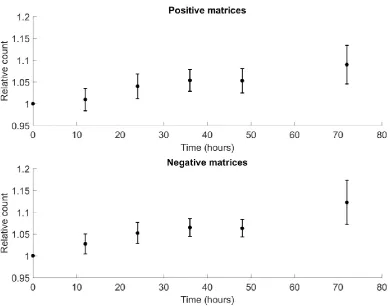
Figure 4.7a and b. Variation in total ion count for positive and negative matrices
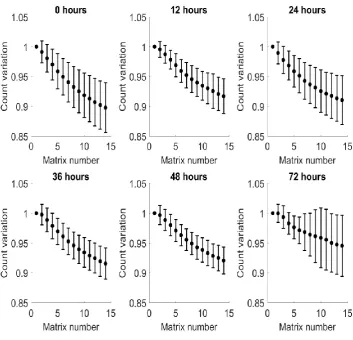
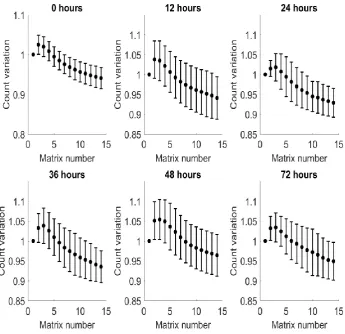
from time point zero . . . 162
Figure 4.8a. Relative variation of ion count for positive matrices . 164
Figure 4.8b. Relative variation of ion count for negative matrices . 165
Figure 4.9a and b. Correlation of mean variation of ion count for positive and
negative matrices . . . 167
Chapter 5: Urinary VOC profiling of colorectal cancer patients, their first degree
15
Figure 5.1. Receiver Operator Curve plots to distinguish pre-treatment CRC
patients from the relative and spouse/co-habitor control groups. . 182
Figure 5.2. Receiver Operator Curve plots to distinguish relatives from the
pre-treatment CRC and spouse/co-habitor groups . . . 184
Figure 5.3. Receiver Operator Curve plots to distinguish spouses from the
pre-treatment CRC and relative groups . . . 186
Figure 5.4. Receiver Operator Curve plots to distinguish the spouse/co-habitor
group from the relative group . . . 188
Figure 5.5. Receiver Operator Curve plots to distinguish the reduced
pre-treatment CRC from control groups. . . 190
Figure 5.6. Receiver Operator Curve plots to distinguish the relative group from
the reduced pre-treatment CRC and spouse/co-habitor groups . 192
Figure 5.7. Receiver Operator Curve plots to distinguish the spouse/co-habitor
group from the reduced pre-treatment CRC and relative groups . 194
Chapter 6: Urinary VOC profiling of colorectal cancer patients prior to and after
treatment and by disease site and referral method
Figure 6.1. Receiver Operator Curve plots to distinguish pre-treatment CRC
patients from the 3 month post-treatment group . . . 209
Figure 6.2. Receiver Operator Curve plots to distinguish pre-treatment CRC
16
Figure 6.3. Receiver Operator Curve plots to distinguish pre-treatment CRC
patients from 3 and 6 month post-treatment and long term CRC follow up
patients . . . 213
Figure 6.4. Receiver Operator Curve plots to distinguish 3 and 6 month
post-treatment CRC patients from pre-post-treatment and long term CRC follow up
patients . . . 215
Figure 6.5. Receiver Operator Curve plots to distinguish long term CRC follow up
patients from 3 and 6 month post-treatment and pre-treatment CRC. 217
Figure 6.6. Receiver Operator Curve plots to distinguish right sided CRC from left
sided and rectal CRC. . . 219
Figure 6.7. Receiver Operator Curve plots to distinguish left sided CRC from right
sided and rectal CRC. . . 221
Figure 6.8. Receiver Operator Curve plots to distinguish rectal CRC from left and
right sided CRC . . . 223
Figure 6.9. Receiver Operator Curve plots for statistical pipelines used to
distinguish CRC patients referred through either 2 week wait pathway or through
17
Chapter 7: Stool 16s RNA profiling of colorectal cancer patients, their first
degree relative and co-habitors
Figure 7.1. Relative abundance plots of pre op CRC subjects and all healthy
controls: relatives and spouses . . . 237
Figure 7.2. Principle component analysis of the overall diversity of pre op CRC
and healthy controls . . . 245
Chapter 8: Stool 16s RNA profiling of colorectal cancer patients prior to and
after treatment
Figure 8.1. Relative abundance plots of pre op CRC subjects and all post
operative samples . . . 259
Figure 8.2. Plots of mean abundances pre and post operatively at 3 months for
OTUs 44, 213, 542 and 627 . . . 261
Figure 8.3. Rarefaction curve of observed number of OTUs against sequences per
sample for pre-op samples and 3 month post op samples . . 262
Figure 8.4. Plots of mean abundances pre and post operatively at 6 months for
OTUs 213, 240, 278 and 1145 . . . 265
Figure 8.5. Rarefaction curve of observed number of OTUs against sequences per
18 Acknowledgements
I would like to thank Professor Chuka Nwokolo, for his supervision of this thesis
from inception to completion. Without his constant encouragement, questioning
and cajoling I would not have been able to complete it. I will be forever indebted
to him for taking an interest when his F1 mentioned at the end of a ward round
that he wanted to pursue a career in gastroenterology. He hasn’t stopped giving
me work to do since then.
Thanks must also go to Professor Harpal Randeva for his supervision and guidance
with this thesis. To Professor Ramesh Arasaradnam for his inexhaustible
enthusiasm and sweet supply and Professor James Covington and his team for
their assistance with understanding FAIMS.
I would like to acknowledge the funding for this thesis which has come from the
UHCW R&D department, Professor Nwokolo’s research fund and bursary awards
from CORE, the Medical Life Sciences Research Fund and the Midlands
Gastroenterology Society.
I would also like to thank the research team at UHCW. Nicola O’Connell, Subiatu
Wurie, Kirstie James, Leighanne Burns and Jiten Kansari for their help with sample
collection and all the advice and help they provided.
I must also thank Parmjit Dahaley and Sean James from tissue bank at UHCW for
their help with storing, processing and transporting samples and patiently dealing
19
My thanks also go to Aditya Malkar and Lauren Brown at Owlstone, Holly Hall at
the University of Warwick for their help with sample analysis. To Andrew Millard
and Richard Savage at the University of Warwick and Matthew Thomas at Oxford
Medical School for their help with statistical analyses and bioinformatics. I will
never be as smart as them.
Finally I must thank my beautiful, long suffering wife Sam, for her constant
support, encouragement and when needed, a stern telling off. Without her, none
20 Dedication
This thesis is dedicated to my late uncle, Chris Sparey. He lost his fight with
21 Declarations
I, Michael McFarlane, declare that this thesis has not been submitted for a
degree at any other University.
The work presented here, including data processing and data analysis, was
carried out by the author, except in the cases outlined below:
• Data processing of raw LC-MS-FAIMS data by Aditya Malkar at Owlstone
(chapters 5 and 6)
• VOC statistical analysis performed in collaboration with Matthew Thomas
and Richard Savage (chapters 4, 5 and 6)
• 16s bioinformatics analysis performed in collaboration Andrew Millard
22 Synopsis
Colorectal cancer (CRC) is the one of the commonest causes of cancer and cancer related death worldwide. Its aetiology is linked to a number of reversible and irreversible genetic and environmental factors, including age, sex, genetics, smoking and diet. There has been a drive in recent years for non-invasive biomarkers for many malignant and non-malignant diseases across multiple medical specialties. One of the areas of interest is the detection of volatile organic compounds (VOCs) in various bodily substances by means such as mass spectrometry and electronic noses. CRC patients have been shown to be distinguishable from healthy controls using urinary VOC detection in several studies, including two published by the research group at UHCW and the University of Warwick. There has also been much interest in recent years into the role that the intestinal microbiome plays in health and disease in humans.
The aim of this thesis was to characterise the urinary VOC and stool microbiome profiles of CRC patients, their spouses and first degree relatives. The aim being to determine whether the urinary VOC profiles could be distinguished using this technology and to try and better understand the underlying mechanism which lead to CRC carcinogenesis. The first degree relatives and spouses were selected as “common gene pool” and “shared environment” control groups respectively.
This work was done using an LC-FAIMS-MS hybrid machine to detect urinary VOCs and 16s RNA sequencing using an Illumina Miseq platform. Comparisons were also made between pre-treatment and post-treatment CRC samples to try and determine if there was any change in either VOC or microbiome profiles after CRC treatment.
The urinary VOC profiles of CRC subjects could be distinguished from both sets of healthy controls using a 5-fold cross validation and sparse logistics regression and Random Forrest statistical classifiers, achieving sensitivities of 63-69%, specificities of 64-69% and AUC 0.71-0.72. No statistically significant differences could be found in the urinary VOC profiles of pre-operative and post operative samples.
Microbiome analysis revealed over 1300 operational taxonomic units (OTUs), with a similarity of >93% between the CRC samples and the control groups, with significantly different bacterial abundances identified in only 82 OTUs (6.2%), mainly Clostridiales bacteria. Pre-treatment and post-treatment sample analysis revealed differences of 17 (3%) and 22 (4%) OTUs at 3 and 6 months respectively, again principally clostridiales.
23 Abbreviations
ANOVA: Analysis of Variance
APC: adenomatous polyposis coli
AUC: area under the curve
BCSP: Bowel cancer Screening Programme
BMI: body mass index
Bp: Base pairs
BSS: Bowel Scope Screening
CEA: Carcino Embryonic Antigen
COPD: Chronic Obstructive Pulmonary Disease
COX2: Cyclo-Oxgenase-2
CRC: Colorectal cancer
CT: Computerised Tomography
DNA: deoxyribonucleic acid
DCIS: ductal carcinoma in situ
E-nose: Electronic nose
FAIMS: Field Asymmetric Ion Mobility Spectrometry
FAP: Familial Adenomatous Polyposis
FIT: faecal Immunohistochemical Test
FOBT: faecal occult blood test
FT-ICR-MS: fourier transform-ion cyclotron resonance mass spectrometry
GC-MS: Gas Chromatography and Mass Spectrometry
GI: Gastrointestinal
GP: General Practitioner
24 HCC: Hepatocellular carcinoma
HLA: Human Leucocyte Antigen
HNPCC: Hereditary Non-Polyposis Colorectal Cancer
HNSCC: head and neck squamous cell cancer
HRT: Hormone Replacement therapy
HSD: honest significance difference
IBD: inflammatory bowel disease
IMS: Ion Mobility Spectrometry
LC: Liquid Chromatography
MDT: Multi-Disciplinary Team
MRI: Magnetic Resonance Imaging
MS: Mass Spectrometry
MUTYH: mutY homolog
OTU: Operational Taxonomic Unit
PCR: polymerase chain reaction
PSA: prostate specific antigen
PTR-MS: Proton Transfer Reaction Mass Spectrometry
ROC: Receiver Operator Curve
ROS: Reactive Oxygen Species
RNA: RiboNucleic Acid
SIFT-MS: Selected Ion Flow Tube Mass Spectrometry
SPME-GC: solid phase microextraction-gas chromatography
SD: Standard Deviation
TAE: Tris-acetate
25 TNM: Tumour Node Metastases
UK: United Kingdom
UHCW: University Hospitals Coventry and Warwickshire
USS: ultrasound scan
VOCs: Volatile Organic Compounds
26
CHAPTER 1
27 1.0 Introduction
Cancer is a leading cause of death worldwide irrespective of the socioeconomic
status of individual countries. The number of cancer cases is expected to grow
rapidly in line with population increases, and the greater prevalence of lifestyle
risk factors, such as tobacco use, physical inactivity and obesity, particularly in low
and middle income countries. Colorectal cancer (CRC) is one of the most common
types of cancer, and cause of cancer-related death worldwide, with 1 in 20 people
developing CRC in their life time.
Currently diagnosis of CRC, in the United Kingdom, is made via 3 main routes;
Emergency presentation with a complication of the primary tumour, such as bowel
obstruction, via the two week wait pathway, where patients with symptoms
suggestive of CRC are referred urgently to hospital for investigation, and via the
Bowel Cancer Screening Programme, where asymptomatic individuals undergo a
screening test based on Faecal occult blood testing. As will be discussed later in
this thesis, the accuracy of the FOB test is poor, and the test itself has a relatively
poor uptake due to the nature of the sample involved. There has been a recent
quest for a more reliable and acceptable method of screening for CRC. This has
included analysis of the profile of volatile organic compounds (VOCs) in various
bodily secretions of CRC patients using numerous different technologies. VOCs are
normal by products of an individuals metabolism, which are believed to be
perturbed in disease states such as CRC. The analysis of CRC derived VOCs is part
28
malignant and non-malignant conditions, across many body systems, including
respiratory, gastrointestinal, metabolic and renal.
This thesis will be a continuation of research I have previously carried out on the
urinary VOC profiles of CRC patients. This study discussed later in this thesis found
that CRC patients were distinguishable from healthy controls with a sensitivity of
83% and specificity of 60%. This thesis, though independent of this previous work,
follows on from it. The primary aim is to analyse the urinary VOC patterns, and the
faecal microbiomes, of patients with CRC, their first degree relatives and an
individual who lives in the same environment as them. Urinary VOC screening
could represent a more acceptable screening medium to patients than the current
faecal based tools in the screening for CRC.
The aim of this analysis is to determine whether urinary VOC profiles of CRC
patients are unique, compared to environmental (co-habitor), and genetic
controls (first degree relative). The previous studies had used healthy controls
completely distinct from the CRC subjects.
The urinary profiles of VOCs before, and after, tumour resection will also be
studied to determine whether any changes in the VOC profile occurs after removal
of the primary lesion.
The composition of the microbiome within all 4 groups, the initial CRC patient
specimens, the post-treatment CRC patient specimens, the co-habitors and the
29
samples. This is with the aim of elucidating any differences in the intestinal
microbiome between the groups. Additionally it should provide further
understanding of the changes which occur in the microbiome after CRC surgery.
The combination of these experiments will hopefully allow greater understanding
of the potential role of urinary VOCs as a non-invasive biomarker in the screening
for CRC and the variation of the faecal microbiome across the main study groups.
As this thesis will cover the aetiology of CRC, the VOC profiling of malignancy,
including CRC, and the microbiome of patients with CRC, each of these areas will
30
CHAPTER 2
Colorectal Cancer, Volatile Organic Compounds and the
31 2.1. Colorectal Cancer
2.1.1. Epidemiology
2.1.1.1. Incidence
Globally, CRC is the third and second commonest cancer in males and females
respectively, with incidence and mortality appearing to be on the increase. In
2008, an estimated 1.2 million people were diagnosed with CRC (1). By 2012 this
number had increased to 1.4 million (2). Worldwide, the age standardised rate for
CRC incidence is 17.3 per 100, 000 and cumulative CRC risk from birth to age 74
years is 0.9%. CRC incidence is higher in men, with an age standardised male to
female ratio of 1.4: 1 (1). Within the United Kingdom (UK), CRC is the fourth most
common cancer overall, and the third most common in both men and women,
with 41,100 cases diagnosed in 2013 (3).
Despite its global presence, there is marked variation in CRC incidence rates
worldwide. Developed or higher income countries account for almost two-thirds
of CRC cases, but the incidence rates in these countries are, for the most part
stable or declining. The incidence rates in developing countries and those with
historically low rates, such as those in Latin America, Asia and Eastern Europe are,
however, rising (1, 2). These increases are believed to be due to the effects of
adopting a more westernised diet, reduced physical activity and increased tobacco
32
The decreasing incidence rates in higher income countries have been attributed
to screening programmes for CRC, which result in the removal of pre-cancerous
lesions and polyps, and also a reduction in risk factors, particularly smoking.
Despite these overall falling incidence rates, higher income countries have been
experiencing an increase in the incidence rates for those aged less than 50 years,
for whom screening is not currently recommended. The underlying reasons for
this rise have not been established (4).
Within the UK, bowel cancer incidence rates are increasing, with a 14% increase
since the 1970s. This is likely to be due, in part, to the implementation of the bowel
cancer screening programme and an increase in lesion detection (5).
2.1.1.2. Mortality
Globally, mortality figures from CRC continue to increase in line with the rising
incidence. In 2008, there were 668,000 CRC related deaths, and in 2012 there
were 693,900 (1, 2). Overall, it is the fourth leading cause of cancer deaths,
accounting for 8% of all cancer deaths worldwide. In the UK, it is the second most
common cause of cancer death after lung cancer, with 15,900 people dying in 2014
(6).
In more developed countries, such as the US and many European countries,
despite a higher incidence rate, mortality rates are decreasing. Again, this is
attributed to screening programmes detecting the disease at earlier, more
33
Conversely, countries with rising incidence and mortality rates e.g. Brazil, Chile,
Romania and Russia, have increasingly westernised diets and life style risk factors,
but have relatively less resources for screening and treatment, resulting in poorer
mortality statistics (4).
The UKs mortality from CRC has been falling since the 1970s, with 16,200 dying in
2012. Over the last decade, the mortality has reduced by 14%. The UK currently
ranks the 10th lowest for males and 14th lowest for females in terms of CRC
mortality (6).
The mortality rate of CRC is approximately half of the incidence rate, giving it a
relatively good prognosis. The 5 year prevalence of CRC worldwide is
approximately 3.26 million (1) whilst in the UK it is 91,777. The UK 5 year survival
is 59%, and 57% at 10 years (8).
2.1.2. Aetiology
Epidemiological studies have identified numerous factors which increase the risk
of CRC, but also many which decrease CRC risk. Those such as personal or family
history of CRC, along with history of inflammatory bowel disease cannot be
modified, but lifestyle risk factors such as smoking, alcohol use, diet and physical
34 2.1.2.1. Age
Age is a major non-modifiable risk factor for both CRC and CRC mortality. In the
UK, 43% of bowel cancer was diagnosed in those aged >75 years, whilst 95% were
diagnosed in those aged 50 and over. The bowel cancer screening programme
(BCSP) was introduced in England in 2006, and has subsequently been rolled out
across the whole of the UK. This led to a 14% increase in CRC incidence for those
aged 60-69 years between 2004-2006, and 2008-2010 (6).
2.1.2.2. Sex
Worldwide, and in the UK, men are at greater risk of CRC than women, but the
reasons for this are not well understood. They have been postulated to be related
to hormonal, genetic and molecular interactions, as well as environmental risk
factors (9).
2.1.2.3. Genetic predisposition
Approximately 5% of CRC can be directly attributed to genetic predisposition. The
main inherited genetic syndromes predisposing to CRC are Familial Adenomatous
Polyposis (FAP) and Hereditary Non-Polyposis Colorectal Cancer (HNPCC), also
known as Lynch Syndrome.
FAP accounts for approximately 1% of CRC. It shows an autosomal dominant
inheritance pattern and is due to a germline mutation in the adenomatous
35
the development of hundreds to thousands of gastrointestinal polyps, which
undergo near inevitable progression to CRC by the age of 40-45 years (10). The
treatment of these patients involves genetic screening of families, endoscopic
surveillance and colectomy.
HNPCC meanwhile accounts for approximately 1-4% of CRC, which also shows an
autosomal dominant pattern of inheritance and is due to mutations in DNA
mismatch repair genes including MSH2, MLH1, MSH6 and PMS2. These mutations
lead to microsatellite instability and subsequent carcinogenesis. Additionally,
HNPCC confers a higher risk of other gastrointestinal (GI) cancers, such as gastric,
but also endometrial cancer. The lifetime risk for developing CRC with HNPCC is
approximately 80% (11).
Other syndromes associated with increased CRC risk are Peutz-Jegher's syndrome
and mutY homolog (MUTYH) associated polyposis. Peutz-Jegher's syndrome is a
rare autosomal dominant condition caused by mutations in the STK11 gene.
Patients develop characteristic hyperpigmentation of the fingers, toes and lips and
are at increased risk of developing hamartomatous polyps of the GI tract.
MUTYH-associated polyposis is an autosomal recessive condition caused by mutation in
the base excision repair gene MUTYH, resulting in multiple colorectal adenomas
36 2.1.2.4. Family History
Non-genetic susceptibility CRC, or sporadic CRC, does still appear to have a genetic
component to it. Family history is an important risk factor for the development of
CRC, even without the presence of genetic predisposition. A first degree relative,
such as a child, parent or sibling, having suffered from CRC leads to a doubling of
the risk of developing CRC by the age of 70 (equating to a 1 in 30 risk). This risk is
further increased if multiple relatives are affected, or diagnosis occurs at younger
than 60 years of age. This increase has been suggested to be due to an interaction
of genetic and environmental causes (12).
It has been found that adopted children are less likely to develop CRC if their
biological parents did not have CRC, compared to if they did. Also children with
adoptive parents who suffer from CRC are not at increased risk of developing CRC
(13). This would suggest that the genetic factors, rather than environmental
factors, underpin the increased family history risk of CRC.
Genome wide association studies (GWAS) have been conducted to examine for
markers of CRC risk. These studies initially showed only a few low penetrance
markers, and failed to identify specific genes. However, further, more powerful
studies have identified multiple low penetrance susceptibility loci which would
account for a higher proportion of CRC. This would support the theory that
sporadic familial CRC results from the cumulative effects of multiple low
37
approximately 20% of all CRC, with the remaining 75% of CRC representing true
sporadic CRC caused by the accumulation of multiple somatic mutations (14-17).
2.1.2.5. Personal Medical History
A past medical history including any of; adenomatous polyps, previous CRC,
inflammatory bowel disease (IBD), gallstones, type 2 Diabetes Mellitus and the
metabolic syndrome places people at an increased risk of developing CRC.
• A pooled analysis of adenomas and polyps has shown that 1% of people
with adenomas measuring greater than 20millimetres, or adenomas of any
size with high grade dysplasia will develop CRC within 4 years of adenoma
removal (18). Even the presence of low risk adenomatous polyps increases
your risk of developing CRC by 80% compared with people who have no
polyps (19).
• IBD (Ulcerative Colitis or Crohn's Disease) conveys an increased risk of
developing CRC. This risk is not now thought to be as high as previously
believed, but is still 70% higher than the general population (standardised
incidence ratio 1.7). Greater risk is found in those with more extensive
disease, longer disease duration and younger age at diagnosis. The
cumulative risk of CRC were found to be 1%, 2% and 5% after 10, 20 and
>20 years of disease duration respectively (20).
• The presence of gallstones confers a 33% increased risk of developing
38
adenoma compared to those who do not have gallstones. Interestingly,
cholecystectomy does not affect the risk of developing adenoma or CRC
(21, 22).
• Several studies have found an increased CRC risk in patients with type II
diabetes mellitus, compared to non-diabetics. This risk appears to be
22-30% greater (23-27). CRC risk is also higher by 33-41% in patients with the
metabolic syndrome (characterised by a combination of diabetes,
hypertension and central adiposity) (28).
2.1.2.6. Obesity
Obesity is a recognised risk factor for developing many forms of cancer, including
CRC. Obesity, measured by body mass index (BMI) >30, conveys a 33% increased
risk compared to those with normal BMI. This association is stronger for colon
cancer than for rectal cancer, and for men compared to women. Waist
circumference is also a risk factor for CRC, with larger waist circumference leading
to a 46% increased risk in CRC (29).
2.1.2.7. Physical activity
Physical activity has been shown to be strongly protective against the
development of CRC, with a 17-24% reduction in risk in the most physically active
39 2.1.2.8. Diet
Many dietary components have been implicated in both increased and decreased
risk of developing CRC.
2.1.2.8.i. Fruits and vegetables
Non-starchy vegetables and fruit show an inconclusive relationship with CRC in
terms of risk. Some studies have shown a reduction in risk with increased
consumption (32-34), whereas other studies have shown only a weak, or absent,
protective effect (35, 36).
2.1.2.8.ii. Red Meat and Processed Meat
Red meat and processed meat consumption have been linked with an estimated
21% of UK CRC, with an increase in risk of 17-30% per 100-120g/day of red meat
intake and 9-50% per 25-50g/day of processed meat intake (37-40). Haem iron,
which is found in red meat, is associated with an increased risk of 12% per
1mg/day intake (41). Although, in another cohort study, CRC risk was not found
to be linked to whole dietary iron intake (42).
2.1.2.8.iii. Fibre
Dietary fibre is believed to be protective against CRC. 12% of CRC in the UK is linked
to consuming less than 23g/day of fibre (43). There is believed to be a 10%
reduction in risk per 10g/day of total dietary fibre and cereal fibre, but
40
Whole grains appear to reduced CRC risk by 20% for every 90g consumed per day
(44).
2.1.2.8.iv. Calcium and dairy
Milk and calcium are protective against the development of CRC. Milk reduces the
risk of CRC by 9-15% per 200-250g consumed per day (45). Calcium meanwhile,
reduces the risk by 8% per 300mg consumed per day, and the risk was found to be
22% lower in the highest calcium intake group, compared to the lowest (46).
Calcium supplementation of the diet shows a mixed picture of evidence, with
some support for 9% lower risk per 300mg consumed per day, whilst other studies
have shown no risk reduction (47, 48).
2.1.2.8.v. Micronutrients
There has been much study into the role of micronutrients into the risk of CRC.
Retinol blood levels have been linked with a 37% reduction in CRC for the highest
versus the lowest serum levels (49, 50). Vitamin D has been linked with a 15-26%
reduction in CRC risk per 10-20ng/ml rise in serum levels (49-52), although, there
is also some evidence that it has no effect on CRC risk (42). Beta-carotene (31%),
Vitamin E (35%), Vitamin C (40%) and Zinc (20%) have all been linked with
reduction in CRC risk for those with the highest intake versus those with the lowest
41 2.1.2.9. Smoking
Cigarette smoking is one of the most common preventable risk factors for the
development of many types of cancer, including CRC. It is estimated that 8% of
CRC cases are linked to tobacco smoking, with CRC risk greater by 17-21%,
compared to non-smokers. The association is stronger for colon cancer than rectal
cancer, and for males compared to females. The risk is higher in heavier smokers,
with an increase of 7-11% for every 10 cigarettes smoked per day (55, 56).
2.1.2.10. Alcohol
In addition to cigarette smoking, alcohol consumption is another of the
commonest preventable risk factors for the development of CRC. An estimated
11% of CRC cases in the UK are linked to alcohol consumption, with an increase in
risk of 21% for those consuming 1.5-6 units per day; and 52% for those consuming
6 units or more per day. Overall this equates to an increase of 7% per unit of
alcohol consumed per day (57).
2.1.2.11. Medication
Several medications have been found to have a chemoprotective effect against
developing CRC. The strongest evidence is for Aspirin and Cyclo-Oxgenase-2
(COX-2) inhibitors, such as celecoxib and rofecoxib (58), although the latter two are no
longer in widespread clinical use. Daily aspirin use for 5 years or more conveys a
32-49% risk reduction in developing CRC, compared to those who do not use
42
(60). Unfortunately, the risks of regular aspirin use, such as GI haemorrhage, mean
that at the moment aspirin is not recommended for primary prophylaxis of CRC
(61).
Hormone Replacement therapy (HRT) and oral contraceptives have both been
shown to have a protective effect against CRC. HRT carries a 16% lower risk for
people who have used it, compared to those who have never used it. There is
some evidence that current users have better protection than previous HRT users
(62-65). Oral contraceptives, meanwhile, convey a 14-19% reduced risk for those
who have used them, compared to those that have never used them (60, 66).
There is contradictory evidence for the role of folate. Some studies have found a
protective effect against CRC (67), some found no effect (68, 69) and one study
43 2.1.3. Diagnosis
Clinical features of CRC depend on the location of the tumour. Approximately 50%
of tumours arise in the rectum and sigmoid colon, approximately 30% in the
caecum and ascending colon, and the remaining 20% arise between the hepatic
flexure and the sigmoid-descending colon junction (70, 71). Left sided and rectal
lesions tend to present earlier, due to the narrower lumen of the left sided colon
and the more formed nature of the stools within it. The presenting symptoms are
usually altered bowel habit, lower abdominal pain, rectal bleeding, and tenesmus
(feeling of incomplete evacuation), or sometimes with more advanced obstructive
symptoms, including perforation. Right sided lesions present more insidiously, as
the caecum and ascending colon have a larger lumen with more liquid stools
passing through. This means that obstructive symptoms are rarer and later. These
patients usually present with symptomatic anaemia, weight loss and, potentially,
an abdominal mass (72).
Investigation of a patient with suspected colorectal cancer is based around the
patient's history, physical examination findings (including rectal examination),
laboratory blood test findings and endoscopic examination of the colon with a
colonoscopy, including biopsy specimens from any lesions identified as suspicious
for CRC. Patients may also undergo a Computerised Tomography (CT) scan of the
abdomen as an initial investigation, or, alternatively, a staging CT scan of their
whole body as part of their assessment once a CRC lesion has been detected.
44
(MRI) scan of the liver, to assess for potential metastases, a MRI scan of the rectum
for rectal cancers, to allow better delineation of the anatomy pre surgery, or a
trans rectal ultrasound scan (USS), again, to better assess a rectal cancer before
deciding on the surgical treatment of the CRC. For those patients who are not
suitable to undergo a colonoscopy, then a "virtual colonoscopy", or CT
colonography, can be performed to assess for possible colonic tumours (72).
The histological confirmation of CRC is a vital part of the Multi-Disciplinary Team
(MDT) approach to the management of patients with the disease. More than 90%
of CRC are adenocarcinomas, which originate from the epithelial cells of the
colorectal mucosa. This tumour type is characterised by its glandular appearance.
It is held that in well differentiated adenocarcinoma >95% of the tumour is gland
forming, moderately differentiated adenocarcinoma shows 50-95% gland
formation, and poorly differentiated adenocarcinoma is mostly solid, with <50%
gland formation. The commonest subtype is moderately differentiated,
comprising approximately 70% of CRC adenocarcinoma. Within the bracket of
adenocarcinoma, there are some rare histological subtypes, including mucinous,
signet ring cell, and medullary type. Other rarer forms of CRC include,
neuroendocrine tumours, squamous cell, adenosquamous, spindle cell and
undifferentiated carcinomas (73).
The staging of CRC tumours is by far the most important prognostic predictor of
clinical outcome for these patients. CRC is staged via the TNM system which was
45
depth of tumour invasion (T), the extent of nodal metastases (N), and the presence
of any distant metastases (M) (see table 2.3.1 for full TNM staging). This system is
utilised, along with the Duke's staging system, which provides a simplified form of
staging (see table 2.3.1 for full Duke’s staging). Duke's staging was first described
in 1929, and, after several revisions, is now well-defined. It describes the tumour
pattern in terms of 4 stages, ranging from minimal colonic wall invasion, to more
extensive wall invasion, the invasion of surrounding lymph nodes and finally, to
include distant metastases (75). The more advanced the disease is, unsurprisingly,
the poorer the expected prognosis. Data from 2002 – 2006 in the UK showed that
Duke's stage A carries a 5 year survival of >90%, Duke's B >80%, Duke's C >60%
46
TMN staging
Primary Tumour (T)
TX Primary Tumour cannot be evaluated
T0 No evidence of primary tumour
Tis Carcinoma in situ. Tumour confined to mucosa
T1 Tumour invades the submucosa
T2 Tumour invades muscularis propria
T3 Tumour invades sub-serosa or beyond
T4 Tumour invades adjacent organs or perforates the
visceral peritoneum
Regional Lymph Nodes (N)
NX Regional Lymph nodes cannot be evaluated
N0 No regional lymph node involvement
N1 Metastasis to 1 to 3 regional lymph nodes
N2 Metastasis to 4 or more regional lymph nodes
Distant Metastasis (M)
MX Distant metastasis cannot be evaluated
M0 No distant metastasis
[image:45.595.111.511.119.690.2]M1 Distant metastasis is present
47
Table 2.2. Dukes staging and equivalent TNM stage (8).
Dukes Stage TNM equivalent
A Tumour limited to submucosa T1-2,N0,M0
B Tumour involves muscularis
propria
T3,N0,M0
C1 Tumour spread to 1-4 local
lymph nodes
T1-2,N1,M0
C2 Tumour spread to more than 4
regional lymph nodes
T3-4,N1-2,M0
48 2.1.4. Treatment
Once CRC has been adequately staged, the treatment is determined by the disease
extent. Treatment options include surgical resection of the affected section of the
bowel. The type of resection is determined by factors including tumour location,
the functional status of the patient, their preference, and the skill of the surgeon.
Wherever possible a direct anastomosis is attempted to ensure continuity of the
bowel. In cases where this is not technically possible, a stoma, either temporary
or permanent, will be sited. However, in patients with low positioned rectal
tumours, the patient may have to undergo an abdominoperineal resection and
have a permanent colostomy. Previously metastatic disease was considered a
contraindication to surgery, however, increasingly; amenable solitary liver or lung
metastases are resected either synchronously, or at a later date (72).
Following surgical resection, the cancer will be fully staged by histological
examination of the excised tumour. This will allow determination of the depth of
tumour invasion, the presence of surrounding lymph node involvement, and any
vascular invasion. Patients with Duke’s C and D, and some with Duke's B, will
undergo adjuvant chemotherapy to reduce the risk of CRC recurrence.
Chemotherapy regimens include combinations of Fluorouracil, oxaliplatin and
capecitabine. They are given as combination therapy or as a monotherapy, and
the choice depends on the patients' functional status, the CRC phenotype, and the
oncologist’s choice and experience. Some patients with particularly bulky disease
49
in an attempt to reduce the size of the tumour, thus possibly allowing easier and
potentially curative surgical resection.
In addition, some patients with rectal cancer will undergo neo-adjuvant, or
adjuvant, radiotherapy, either to reduce the size of tumour pre-operatively, or
reduce the risk of tumour recurrence post-treatment. This may be used in isolation
or in conjunction with chemotherapy.
Approximately two thirds of patients present with potentially curable disease, and
of these 30-50% will develop recurrent disease (76, 77). Disease recurrence is
typically at the site of resection, or the liver or lungs, with 80% of recurrences
occurring within 3 years, and most within 5 years (78, 79).
After surgical resection, patients will be monitored for several years to assess for
disease recurrence. There is little evidence to suggest that intensive follow-up
increases survival, but neither is there evidence to the contrary (80). There is also
variation between centres in terms of the form of follow-up, but most patients will
undergo a CT scan to assess for potential liver metastases, and a colonoscopy to
assess for metachronous lesions (80). The current British Society of
Gastroenterology guidelines state that colonoscopy follow-up should be
performed 5 years after surgery, and then every 5 years subsequently until benefit
is outweighed by co-morbidities (80). However, many centres instead follow the
50
1 year post-surgery, an annual CT scan for 3 years and 6-monthly Carcino
Embryonic Antigen (CEA) monitoring for 5 years (81).
2.1.5. Bowel Cancer Screening Programme:
2.1.5.1 Background
CRC is a condition which is well-suited to screening. It is common, with a high
mortality rate, and the symptoms are frequently non-specific and perceived as
common, leading to many patients ignoring them. This leads to the disease often
presenting at a later and hence more likely incurable, stage. As discussed earlier,
prognosis in CRC is strongly linked to stage at diagnosis. Earlier detection of CRC
may lead to reduced mortality, with clinically incurable disease being potentially
curable if identified earlier. Screening for CRC could also prevent many future
cases of the disease by virtue of the detection, and removal, of potentially
pre-malignant adenomatous polyps. The natural history of colonic adenomas is not
fully understood, but it is believed that the transformation from adenoma to
carcinoma takes approximately 10 years. If these lesions are detected early and
removed, then the incidence of CRC could be reduced (82).
It has been demonstrated that screening for CRC using guaiac based faecal occult
blood tests (gFOBT) can reduce mortality by 16% in people offered screening, and
25% in those who accept screening. Economic analysis of screening CRC has shown
cost effectiveness, with a cost per quality adjusted life year gained of <£3000 for
51
Screening programmes have been introduced successfully in many countries,
including the United Kingdom, which began its programme in July 2006 in England.
It was based on biannual gFOBT screening of 60-69 year olds and was subsequently
rolled-out countrywide and then to the rest of the United Kingdom, with complete
roll-out by January 2010 (83). The upper age limit was then extended to 74 years
in 2012, although, those aged over 74 can still request a screening kit to be sent
to them. If the kit returns a positive result then the individual is invited to undergo
a colonoscopy. There are three main outcomes: 1) if the colonoscopy is normal,
then they are discharged from that round of screening and will be invited to take
part in the next round 2 years later. 2) If any polyps are detected then the patient
will leave the screening programme and enter into the polyp surveillance
programme, which is based on the current BSG guidelines for polyp surveillance.
3) If cancer is detected, the patient will follow the MDT route of management for
their CRC (83).
2.1.5.2. Effectiveness
Reports into the effectiveness of the Bowel cancer Screening Programme (BCSP)
found that uptake of the programme varied according to geographic location, and
socioeconomic status. However, across England, uptake of gFOB testing was 52%,
which is comparable with pilot studies carried out in the 1980s and in 2000 (83).
Women were more likely to return the kit (54.4%), compared to men (49.6%).
Abnormal results were found in 2% of all cases, with 2.5% of men returning a
52
Of those with an abnormal gFOBT; 10.1% were subsequently diagnosed with CRC
(11.6% men, 7.8% women), a further 12% of men and 6.2% of women were found
to have polyps defined as high risk, and 19.3% of men and 14.6% of women were
found to have intermediate risk polyps (83).
The location of CRC detected in the screening programme showed that 28.7%
were reported as rectal cancers, and, overall, 77.3% were recorded as left-sided,
with only 14.3% recorded as right-sided. This was a slightly surprising finding as it
was previously found that the only 66% of CRC was left-sided in non-screening CRC
population. 71.3% of detected CRC was found to be the earlier Dukes Stages of A
or B, which is again comparable to the 2000 English pilot study (72%) (83).
2.1.5.3. Future
Following the successful extension of the BCSP to 60-74 year olds, a further
screening programme, Bowel Scope Screening (BSS), underwent pilot studies
beginning in early 2013. This involved a one-off flexible sigmoidoscopy for those
aged 55-60 years. At the age of 60, they would then enter the BCSP. Analysis of
the 6 pilot centres results showed an uptake of 43.1%, and surprisingly, compared
to the BCSP, uptake was higher in men than in women (45% vs 42%). National
roll-out of the programme began following these pilots and, as of March 2015,
two-thirds of BCSP centres now offer BSS. One of the pilot studies reported they found
53
Another potential development in the BCSP is the replacement of gFOBT with
faecal Immunohistochemical Tests (FIT). This is based around the apparent
superiority of FIT testing to gFOBT in terms of diagnostic accuracy, but also with
regards to uptake rate (85-87). gFOBT is based on a peroxidase reaction which
makes it susceptible to false positive results, especially with diets rich in meat,
vegetable and fruit products which contain peroxidase (88). This potentially
explains the low positive predictive value of ~10%. FIT testing, meanwhile, is based
on antibody testing against human haemoglobin, which allows for quantitative
results of the levels of haemoglobin (7). The Scottish BCSP has introduced a
two-tier system of gFOBT and FIT (89). A subsequent trial of FIT as the first line
screening test revealed a higher uptake rate of 58.5% compared to gFOBT, but a
similar positive predictive value, though given the increased uptake this may
represent more cases diagnosed (86). Other studies have shown a 13-15% higher
participation rate as a result of FIT testing (90, 91). It seems likely that in the
coming years FIT testing will replace gFOBT as the screening test for the BCSP.
Other, more novel technologies which are being developed include, Faecal DNA
testing, faecal protein testing and pyruvate kinase isoenzyme type M2 (M2-PK).
Faecal DNA testing involves looking for specific genetic changes, such as mutations
in the WNT and MAPK pathway genes (e.g. Kras and APC), which are known to be
present in neoplastic cells and are shed into the colonic lumen. These tests are in
the development phase, and are mostly being used on patients who have been
54
However, they appear promising, with a sensitivity of >85% for CRC and >50% for
large adenomas (90). A multi-target faecal DNA test was recently compared to FIT
in an average risk screening population, and found to have a sensitivity of 92.3%
for CRC, and 42.4% for adenomas with high grade dysplasia. The sensitivity was
approximately 20% higher than the comparator; FIT. The specificity was lower for
the faecal stool analysis, 86.6%, compared to 94.9% for FIT (92).
Several faecal proteins, such as lactoferrin, lysozyme and albumin have been
assessed as potential faecal biomarkers of organic pathology, although, only faecal
calprotectin (FC) has shown any promise, due to the poor diagnostic accuracy of
the other tests (88, 93). Faecal calprotectin is an inflammatory protein released
from white blood cells in response to inflammation or malignancy. It has a mean
sensitivity of 83% and specificity of 84% for organic bowel pathology, but, as it is
unable to distinguish between malignancy and inflammation, it is unsuitable for
CRC screening (88).
Pyruvate kinase isoenzyme type M2 has shown promise as a potential stool
biomarker for GI cancers, including CRC. The rationale behind its use is that
different isoenzymes of pyruvate kinase are expressed depending on the
metabolic functions of tissues. During rapid cellular division, as seen in CRC,
specific isoenzymes are replaced with M2-PK in its dimeric form. The main
advantages are that only one stool test is required, and points of care tests are
available commercially. A pooled analysis of 12 studies, revealed a sensitivity of
55
patients, and therefore, larger scale studies are required before M2-PK could be
used as a screening tool for CRC (88, 94).
Blood serum markers for CRC are also undergoing investigation at present. DNA
originating from cancer cells has been found circulating in plasma, which could
allow serological screening for CRC. DNA methylation occurs early in
carcinogenesis and thus, biomarkers of these epigenetic events may permit earlier
diagnosis. Some genes are more heavily methylated e.g. Septin-9 (SEPT9), and this
target is currently under assessment in the screening population (90). A
commercially available test, including molecular assays for aberrant methylation
of BMP3, NDRG4, KRAS and an immunochemical FOB test, is available. This test
gives better sensitivity than FOB, but at the expense of specificity (88). The current
cost of these DNA sequencing technologies, at present, prevents their use as a
viable screening test at present.
There is an ongoing quest for non-invasive biomarkers of disease, particularly
cancer. This search has led to the exploration of volatile organic compounds as a
56 2.2. Volatile Organic Compounds
The quest for a non-invasive method of screening for, or detecting, early stage
cancers has been applied to genomics, proteomics and metabolomics. One of the
most promising metabolomic approaches is the detection and analysis of volatile
organic compounds (VOCs). The detection of patterns of VOCs by both invasive
and non-invasive methods, and their utility as disease specific gas phase
biomarkers, has been a rapidly developing area within several medical domains
over recent years (95).
VOCs are a widely diverse group of carbon based chemicals and are classified
according to their boiling points and retention times. They represent the product
of metabolic processes within the body and are simple chemicals such as alcohols,
aldehydes, alkanes etc. They are present in exhaled breath as well as blood, urine,
faeces and sweat. Alterations in the patterns of VOCs have been suggested to
result from pathological processes in the body generating new VOCs, which are
not produced during normal physiological processes, thus allowing their use as
biomarkers of disease (95).
VOCs have been shown to produce disease specific patterns which allow the
distinction of cancer from non-cancer, but also, other non-cancerous diseases
from controls, across a wide range of medical specialties, including respiratory;
gastroenterology and metabolic medicine (96). The study of this technology has
57
which will allow patients to be tested for various disease states, and responses to
treatment.
2.2.1. Background and Animal studies
Initial interest in non-invasive VOC detection as screening tests for disease arose
from the observation of canine olfactory detection of cancer in humans. This was
first reported in 1989, with a dog reported to have persistently sniffed a spot on
its owners leg which, on medical examination and biopsy, was proven to be
melanoma (97). A study in 2004, using 2 separate dogs on 7 patients, found the
dogs were able to detect biopsy proven melanoma in 6 of them (98). Another
study in 2004, demonstrated that canines were able to detect malignancy in the
urine of patients with bladder cancer (99). Further early studies, looking at lung,
breast, prostate and ovarian cancer, have all suggested a role for canine detection
of human malignancy (100-102). These studies showed varying success rates,
sensitivities and specificities. Gordon et al demonstrated only 22% sensitivity for
detecting breast cancer in urine specimens, and only a 17% success rate for
prostate cancer. The authors suggest that this may be due to the urine being dried
first, resulting in evaporation of VOCs, as fresh samples demonstrated a 50%
sensitivity (101). Other studies into breast and lung cancer detection via exhaled
breath, showed sensitivities of 88% and 99% respectively, and specificities of 98%
and 99% respectively (100). A review of the early studies highlighted several
problems in terms of lack of controls, and the use of canines, which need to be
58
canine detection of CRC using both breath and stool samples showed high
sensitivity and specificity for both sample types (sensitivity 91%, specificity 99%
for breath and sensitivity 97%, specificity 99% for stool). Interestingly, the canine
detection remained high even for earlier stages of CRC. This suggests that the
changes in the VOC profile occur early in the carcinogenesis pathway. The authors
also found that canine scent detection was not confounded by smoking status, the
presence of benign polyps or IBD (104).
A further study demonstrated that four trained dogs were able to distinguish
bladder cancer from controls through urine, with a pooled sensitivity of 64%, and
specificity ranging from 56% to 92%. Again, this study demonstrated no
confounding by smoking, gender or age. Although they did find that sensitivity and
specificity were affected by other, non-cancerous, urological co-morbidities (105).
Better success appears to have been found with prostate cancer. One study
reported that using urine specimens, the dog, which had received 24 months of
training, was able to distinguish prostate cancer specimens from controls with a
sensitivity and specificity of 91% (106). This was followed by a larger study looking
at urine from 362 patients with prostate cancer and 540 healthy controls, which
found that 2 dogs achieved respective sensitivities of 100% and 98.6%, and
specificities of 98.7% and 97.6% (107).
In recent years, subsequent studies into the animal detection of various cancers
by bodily substance olfaction have included; studies assessing lung cancer
59
and one study assessing lung cancer detection from breath and urine samples
(110).
The problems with animal olfactory detection of cancer include; training time for
the animal, the variability of training and also 'olfactory fatigue'. This phenomenon
describes where the olfactory receptors become saturated with a particular odour
and, hence, will lose sensitivity with continuous exposure (111, 112). This, in part,
has accelerated the quest to find a technology which will allow for rapid,
reproducible testing of bodily samples for VOC patterns that show a high
diagnostic accuracy.
Interestingly, as previously mentioned, canine cancer detection has repeatedly
been shown to be unaffected by confounders such as smoking status, food odours
and drug metabolites. This suggests that while the robotic VOC detection methods
may be more reproducible, they lack the "canine element" of being able to tune
out potential confounding smells (113). The argued benefits of canine detection
over mechanical detection are that dogs give a clear binary response (yes/no) to
the presence of cancer, and the sample can be analysed at the bedside, which
reduces the risk of sample degradation due to storage (114). Most mechanical
forms of VOC detection, with some exceptions, detect individual VOCs, whereas
canines are most likely sensing the overall "smell print" of multiple VOCs in the
60
2.2.2. Current and future technologies and VOC sample type
There are several available analytical tools which can be used to detect VOCs in
various bodily substances. The current gold standard is widely held to be GC-MS.
A systematic review from 2015 looked at the use of exhaled breath in detection of
all types of cancer. Of these studies, 42 relied on GC-MS as their analytical
machine, whilst 24 utilised E-nose technology. A summary of the various
technologies used for VOC detection can be found in Table 2.3.
GC-MS technology allows identification of individual VOCs within the specimen
chosen for sampling. Significant differences in the type of VOCs found between
cancer patients and healthy controls have been identified. Individual VOCs
identified vary according to cancer type, however, some have been found to be
elevated in cancer compared to non-cancer patients. These include
2-methyl-3phenyl-2propenal; p-cymene, anisole, 4-methyl-phenol and 1,2-dihydro-1,
1,6-trimethyl-napthalene, whereas dimethyl sulphide was found to be present at
lower concentrations in cancer patients as compared to non-cancer (115).
Though GC-MS allows identification of individual VOCs, it is a large, expensive
piece of equipment, with significant operational costs and specific laboratory
requirements. Furthermore, there have been to date no unique VOCs identified
which are consistently present through out cancer patients, rather a panel of VOCs
are used to identify the cancer patients. These factors mean it is unlikely to