Salt Bridges Regulate Both Dimer Formation and
Monomeric Flexibility in HdeB and May Have a Role in
Periplasmic Chaperone Function
Wenjian Wang
1, 3†
, Tim Rasmussen
2†
, Amanda J. Harding
2†
,
Nuala A. Booth
2, Ian R. Booth
2⁎
and James H. Naismith
1⁎
1Biomedical Sciences Research Complex, University of St Andrews, St Andrews, Fife KY16 9ST, UK
2Institute of Medical Sciences, University of Aberdeen, Foresterhill, Aberdeen AB25 2ZD, UK
3Laboratory of Department of Surgery, The First Affiliated Hospital, Sun Yat-sen University,
58 Zhongshan RoadⅡ, Guangzhou 510080, China
Received 14 October 2011; received in revised form 14 November 2011;
accepted 15 November 2011
Available online 25 November 2011
Edited by R. Huber
Keywords:
crystal structure;
fluorescence measurements; hydrophobic residues; acid response;
pH titration
Escherichia coliand Gram-negative bacteria that live in the human gut must be able to tolerate rapid and large changes in environmental pH. Low pH irreversibly denatures and precipitates many bacterial proteins. While cytoplasmic proteins are well buffered against such swings, periplasmic proteins are not. Instead, it appears that some bacteria utilize chaperone proteins that stabilize periplasmic proteins, preventing their precipitation. Two highly expressed and related proteins, HdeA and HdeB, have been identified as acid-activated chaperones. The structure of HdeA is known and a mechanism for activation has been proposed. In this model, dimeric HdeA dissociates at low pH, and the exposed dimeric interface binds exposed hydrophobic surfaces of acid-denatured proteins, preventing their irreversible aggregation. We now report the structure and biophysical characterization of the HdeB protein. The monomer of HdeB shares a similar structure with HdeA, but its dimeric interface is different in composition and spatial location. We have used fluorescence to study the behavior of HdeB as pH is lowered, and like HdeA, it dissociates to monomers. We have identified one of the key intersubunit interactions that controls pH-induced monomerization. Our analysis identifies a structural interaction within the HdeB monomer that is disrupted as pH is lowered, leading to enhanced structural flexibility.
© 2011 Elsevier Ltd. All rights reserved.
Introduction
Bacterial cells that passage through the stomach en route to colonization of the gut must survive
extremely low external pH of around 2.1At this pH,
many critical proteins will unfold and aggregate with lethal consequences for the organism. Bacteria protect
their cytoplasmic components by buffering their internal pH and thus preventing such lethal changes
in the external environment.2,3 However, the
peri-plasm, due to weak buffering and the presence of porins in the outer membrane, does suffer large drops in pH in response to changes in extracellular environment. Two proteins, HdeA and HdeB, were discovered as abundant periplasmic proteins in
stationary-phase Escherichia coli cells, and genetic
studies implicated them in survival of extremely acid pH.3–6Subsequently, thehdeABoperon has been shown to be subject to the complex regulation that is associated with many proteins that are required for
survival of acid stress.6–9 Unusually for stress
*Corresponding authors. E-mail addresses:
[email protected];[email protected].
†W.W., T.R., and A.J.H. contributed equally to this work. Present address: W. Wang, Laboratory of Department of Surgery, The First Affiliated Hospital, Sun Yat-sen University, 58 Zhongshan Road II , Guangzhou 510080, China.
Journal of Molecular Biology
j o u r n a l h o m e p a g e : h t t p : / / e e s . e l s e v i e r. c o m . j m b
proteins, which are normally widespread among bacterial species, the distribution of HdeA and HdeB is extremely narrow, being restricted to selected members of the Proteobacteriaciae (Table S1).
HdeA and HdeB have been shown, in vitro, to
have acid-activated chaperone functions; that is, by binding to acid-denatured proteins, they prevent these other proteins from irreversible aggregation
and precipitation.4,10 At a molecular level, the
proteins sequester the exposed hydrophobic surface of target proteins. At neutral pH, HdeA, which is the more intensively studied protein of the pair, exists as a homodimer that has no ability to bind to other proteins. The structure of HdeA has been solved to 2 Å resolution at neutral pH and reveals that the
monomer is primarilyα-helical and forms a dimer
with an extensive and hydrophobic interface.4,11
Upon incubation at acid pH (∼pH 2), HdeA is
activated and forms monomers. It is this newly exposed dimer interface of HdeA that binds to hydrophobic faces of the denatured proteins, pre-venting their aggregation. This poses a challenge on how the specific dimer interface seen in HdeA can recognize such a wide range of substrates. Here, we report the crystal structure of HdeB at pH 4.5 and biophysical characterization of HdeB at both acid and neutral pH. Like HdeA, HdeB is dimeric at neutral pH but forms monomers at low pH (∼pH 3.5). By monitoring the intrinsic fluorescence of HdeB as pH changes, we have identified additional changes in structure that accompany acid-induced monomer formation.
Results
HdeB is a dimer
The asymmetric unit of the crystal contains four protein monomers with residues A30 to A102 ordered; six C-terminal residues and the His-tag are disordered. The N-terminal 29-residue periplas-mic export sequence is predicted by SignalP to be
removed during processing.12 Thus, the structure
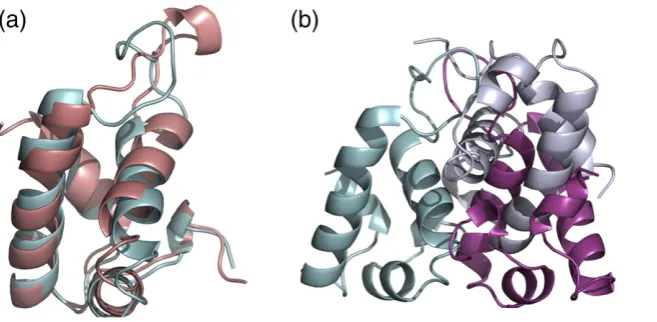
represents the whole of the mature protein in experimental electron density. The monomeric structure is composed of two 12-residue helices (α2 andα3), three short (4 or 5 residues) helices (α1,α4, andα5), and interconnecting loops (Fig. 1a). Despite low sequence identity between HdeA and HdeB (13%), the monomeric structure of HdeB is very
close to that observed for HdeA4,11(1dj8 and 1bg8)
as had been predicted by threading analysis.4 In
total, 61 Cα atoms superimpose with an RMSD of
1.75 Å. The major difference occurs in the long loop that connects the two large helices (residues 64 to 72 in HdeB). The superposition of the structures shows
that the two loops generate an almost ‘figure of
eight’arrangement (Fig. 1a). The difficulty in tracing the HdeB loop structure from molecular replace-ment models had hindered our refinereplace-ment.
Analysis with PISA13reveals that the four
mono-mers in the asymmetric unit are arranged as two identical dimers of HdeB. The dimers themselves make no significant contacts with each other. The
dimer is identified as stable by the program PISA13
and the dimer interface buries in total 2400 Å2 of
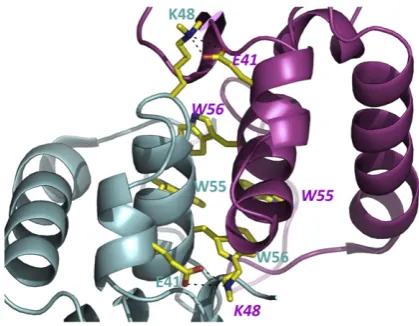
surface area, much of it involving hydrophobic residues (Fig. 1b). There are six main-chain
inter-subunit hydrogen bonds (akin to aβ-sheet
interac-tion) formed between the loop from each monomer that connects the two long helices. Theα2 helix from each monomer makes extensive intersubunit in-teractions, as does the N-terminus of the mature protein. Two tryptophan residues (W55 and W56) and a tyrosine residue (Y64) from each monomer come together to make a cluster of aromatic residues at the C-terminal end ofα2 (Fig. 2). This hydropho-bic cluster is a striking feature of the HdeB dimer. We constructed the double mutant (W55A, W56A) to support our structural model and indeed the double mutant is folded but is found only as a monomer at pH 7 (Fig. S1). For K48, which is at the interface and methylated, the Nz atom makes a salt contact with the side chain of E41 of the other
[image:2.595.68.397.87.248.2]subunit (Fig. 2). The methyl groups point towards
the solvent, suggesting that the methyl groups do not perturb the dimer interface.
The HdeA dimer buries 2200 Å2of surface area,
which also predominantly involves hydrophobic residues, but interestingly, it has a quite different
arrangement from that seen for HdeB. The twoα2
helices in the HdeA dimer are almost parallel, whereas they are almost perpendicular in the HdeB dimer (Fig. 1b). In HdeA, the side chains of theα2 helix on one monomer fill a groove on the surface of the other monomer. This groove is absent in HdeB and is instead filled by side chains from within the monomer (including W55 and W56). The different dimer arrangements seen for HdeA and HdeB are mutually exclusive since, unless there are significant conformational changes, the arrangements would cause extensive van der Waals clashes. Further, the residues engaged in each dimer interface are not conserved between the proteins. We conclude that the different arrangement of the HdeB dimer observed in the crystal is real rather than artifactual. Analogous to the behavior observed for HdeA, gel-filtration analysis shows that the dimer of HdeB can be fully dissociated into monomers at pH 2.5 (Fig. S1) and that this dissociation is fully reversible by increasing the pH. CD spectra at different pH values showed that HdeB retained its overall structure through the range in which it dissociates but that significant structural changes may occur in the
monomer at very low pH (bpH 3).
Spectroscopic characterization of the
pH-dependent dissociation of the HdeB dimer
The position of the only tryptophan residues (W55 and W56) at the dimer interface (Fig. S2) suggested
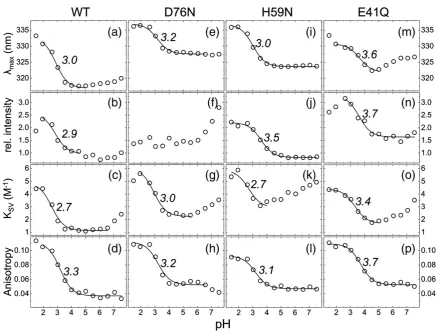
that they could be used as intrinsic probe to monitor changes in the dimeric state of HdeB by fluorescence spectroscopy. Emission spectra, steady-state fluo-rescence anisotropies, and quenching curves were recorded in the range from pH 1.5 to 7.5 for the
purified HdeB-His6 WT (Fig. 3a–d). Significant
changes in the emission properties and in quenching were observed when the pH was varied. The emission maximum moved to longer wavelengths (red shift) below around pH 3, indicating an increase in polarity of the immediate environment of the tryptophan residues, as would be expected from dimer-to-monomer transition and consistent with gel-filtration results (Fig. S1 and Ref.10). Quenching experiments follow a similar trend; below pH 3, much higher Stern–Volmer acrylamide quenching constants were obtained, indicating that the
trypto-phan residues become exposed to bulk water (Fig.
3c). Fitting of these data to Eq. (3) revealed an
effective pKa≈3 for dissociation of the dimer.
Similar pH dependence was obtained for fluores-cence anisotropy. These changes are likewise fully reversible by increasing the pH (Fig. S2). The data convincingly identify pH-dependent dissociation of the dimer.
Dimer dissociation; role of the intersubunit salt bridge E41 and K48
The tryptophan residues are clearly essential for dimer formation, but it is difficult to explain how they could control pH sensitivity. The crystal structure shows an intersubunit salt bridge at the dimer interface of HdeB: E41 from one subunit with K48 from the other (Fig. 2) and internal salt bridge
within each monomer D76–H59 (Fig. 4a). We created
the E41Q mutant to break the intermolecular salt bridge and determined the fluorescence properties of the purified mutant protein. Although the E41Q mutant still undergoes a pH-dependent dissociation
at 50 μM, with consequent increase in λmax and
quenching, it does so with an apparent pKa∼0.5 pH
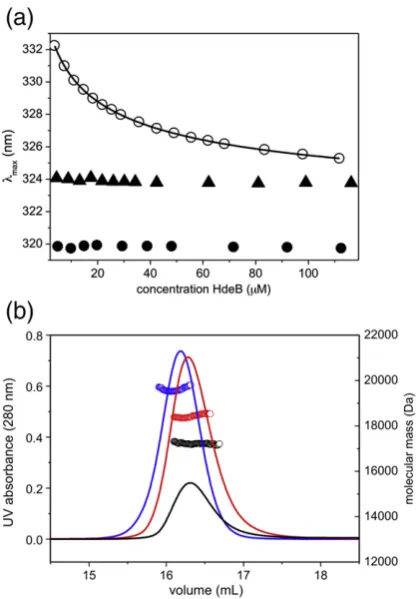
units higher than that of wild type (Fig. 3m, o, and p). Gel-filtration data suggested a mixture of dimer and monomer, even at neutral pH. We therefore inves-tigated the concentration dependence of the dimeric state. The emission maximum wavelength was observed to shift as a function of the protein
concentration at pH 7.5 (Fig. 5a; 1–100 μM range).
Fitting of these data yields λM= 334.4 ± 0.4 nm and
λD= 320.9 ± 0.3 nm at low (monomer) and high
(dimer) concentrations, respectively. These values
agree well with λmax values found for wild-type
monomer (acid pH) and dimer (neutral pH), respectively. Light scattering revealed a slight reduction in apparent average mass with 20 kDa versus17 kDa for wild type and E41Q, respectively (Fig. 5b). A simple dissociation curve yields aKd= 34
[image:3.595.66.276.86.249.2]± 10μM for the E41Q dimer; no such dissociation is
observed for wild type, indicating aKdbelow 1μM.
We therefore conclude that this salt bridge is indeed critical for the stability of the dimer and that its loss destabilizes the dimer by at least 2 orders of magni-tude. The fact that the destabilized dimer still under-goes pH-dependent dissociation suggests that other salt bridges may be present. However, none are evi-dent in the native structure, and consequently, these may only form in the mutant. The most likely candi-date we predict would be E42, which is close to E41 in the tertiary structure and, in the mutant, could par-tially substitute for E41, making a salt bridge to K48.
Influence of pH upon monomer structure; internal salt bridge
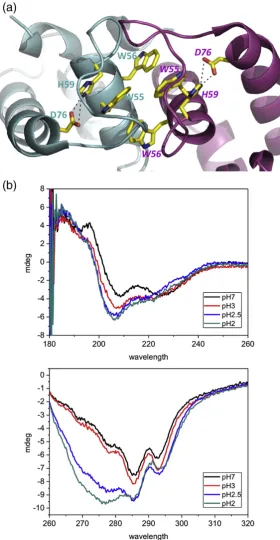
We noted that for the native protein, the fluores-cence intensity changes in response to pH, with the effect titrating at pH 2.9. Although this could be attributed to dissociation, we investigated further to see whether there were additional pH-induced changes around the tryptophan residues. Asp76
makes a polar contact with the indole nitrogen of Trp55 and a salt bridge with His59, which in turn
stacks against the indole of W55 (Fig. 4a). The
hydrogen bond between D76 and H59 linksα3 and
α2 helices together. We reasoned that the D76–H59
salt bridge may be disrupted at low pH, and this in turn could perturb tryptophan fluorescence. The D67N mutant exhibited the same monomer–dimer pH transition as wild type (as judged by gel filtration), and analysis of fluorescence data indicat-ed that the monomer-to-dimer transition occurrindicat-ed
with a pKa identical with that of the wild-type
protein (Fig. 3e, g, and h). These data are consistent with the internal salt bridge having no role in dimer formation, which is also consistent with the struc-ture of HdeB where the His59–Asp76 salt bridge is remote from the dimer interface. However, the D76N protein exhibited profound differences in the spectroscopic properties of the Trp residues; notably, the emission intensity was constant in the pH 1.5–6 range (in contrast to wild type, which
[image:4.595.81.523.83.417.2]titrates with pKa= 2.9, Fig. 3f) and the emission
maximum wavelength was red shifted (Fig. 3e). Since this titration is not possible for D76N, we attribute the changes in fluorescence intensity in the wild-type protein arising from protonation of D76, which changes the charge in the direct environment
of the tryptophan,14,15 rather than protonation of
either D76 or H59, causing pH-dependent dissoci-ation of the HdeB dimer. Although the pKaof 2.9 for
D76 is below the 3.5 normally found for aspartic residues in proteins,16the involvement of Asp76 in a salt bridge with His59 would be expected to lower its pKa. Protonation of histidine to change structure
and regulate function is extremely common. A
recent example is E. coli DegQ protease, which
[image:5.595.61.342.88.629.2]range associated with His protonation, although no formal evidence for this mechanism has been
presented.17 The system in HdeB is different, in
that it is the protonation of Asp76 involved in a salt bridge with H59 that mediates a subtle structural change. The D76N data also reveal an increase in intensity at higher pH (N6.5) much greater than that seen in the wild type. We ascribe this to deprotona-tion of H59 at higher pH values, which in its protonated (charged) form would also be expected
to quench tryptophan.18 The difference between
mutant and wild type is explained by a salt bridge
with Asp76 that, when present, would raise the pKa
of His59. To confirm this interpretation, we created the H59N mutant, which shows a single titratable pKaof 3.5, consistent with a simple D76 protonation
event, but no major modification of the dimer– monomer transition (Fig. 3i, j, and l).
At pH 6, both D67N and H59N exhibit a substantial red shift in the emission maximum and a corresponding offset of the quenching curves (Fig.
3e and i) relative to native, suggesting increased
access to water. The salt bridge between D76 and H59 thus appears to be important in maintaining the local structural environment around the tryptophan
residues, probably due to linkingα3 andα2. Since
the Asp76–His59 salt bridge breaks at about the same pH as observed for monomer formation, we predicted that the structure of the protein monomer would likewise change at about the same point the dimer breaks. This hypothesis is supported by CD spectroscopy, where changes in secondary and tertiary structure are observed at low pH (Fig. 4b). We suggest that this indicates that dimer dissocia-tion is accompanied by conformadissocia-tional change within the monomer.
Discussion
Chaperones frequently exert their action by providing hydrophobic surfaces that sequester hydrophobic groups that are exposed during either
folding or unfolding of other proteins.19The HdeAB
proteins fulfill this role for periplasmic proteins in some Gram-negative bacteria, and the observation that their hydrophobic face is buried until the proteins are exposed to low pH has led to their being implicated in stabilizing proteins that are
destabilized at low pH.4,10 Paradoxically, the
HdeAB system enjoys a very narrow distribution in the microbial kingdom from which we infer that these chaperones do not provide a universal panacea to acid stress-induced protein denaturation. The crystal structures show that HdeA and HdeB have distinct hydrophobic interfaces that are ex-posed at different low pH values, perhaps indicating different targets. Although each protein has been demonstrated to have chaperone activity with ‘artificial’(i.e., non-periplasmic or non-E. coli) pro-teins, their substrates in their host organism remain
unclear.4,10 For HdeA, partial unfolding in acid is
proposed to be required to adapt to different
substrates.20 Recent work has suggested that the
HdeA protein has a very narrow substrate range, including other chaperones and protein-folding
proteins.21 However, the substrate profile of HdeB
[image:6.595.74.284.86.386.2]remains unknown. We have determined the struc-ture of HdeB and the mechanism of its acid sensing, identifying two critical salt bridges that are broken upon exposure to low pH. This leads us to speculate that HdeB could work by means of a two-step mechanism. Firstly, the inter-monomer salt bridge, when broken, destabilizes the HdeB dimer signifi-cantly (at least 100-fold). Secondly, the internal salt bridge within the HdeB monomer is broken, and this increases structural flexibility, particularly at the Fig. 5. Concentration-dependent dissociation of HdeB
newly exposed interface. Enhancing the flexibility of the newly exposed interface is potentially a molec-ular mechanism by which HdeB may be able to deform to chaperone different target protein structures.10
Materials and Methods
Structural biology
Hdeb-His6was expressed and purified after cloning of
thehdeABgenes fromE. coliinto pTrc99A (Pharmacia) using a PCR product generated with primers Hdeb-His6-F and
Hdeb-His6-R (Supplementary Data) that integrate
appro-priate restrictions sites, to create plasmid pTrcHdeABHis6.
The primers were designed such that a His6-tag was fused
in-frame to the carboxy-terminus of HdeB. The insert in the plasmid was sequenced on both strands to ensure retention of the E. colicoding sequence and the in-frame His-tag. Expression in strain MG1655ΔhdeAB was induced by growth with 1 mM IPTG and cell extracts prepared after 18 h of growth (i.e., after entry into stationary phase). The expressed protein was shown to complement the HdeB deficiency in acid survival experiments (data not shown). Purification of Hdeb-His6from the extract used Ni resin,
protein was eluted using 50–100 mM imidazole, and the eluted material was subjected to further purification by gel filtration. The identity and integrity of the purified protein were verified by peptide mass spectrometry.
After gel filtration, HdeB was concentrated to 5, 10, and 15 mg ml−1. The protein was screened for crystallization
against a range of conditions from commercial kits in standard use at the Scottish Structural Proteomic Facility.22 The protein crystallized under a number of
conditions, but we failed to obtain any diffraction data for the crystals. The protein was modified by reductive methylation following a published protocol.23 After methylation, gel filtration was rerun, and a small shift was observed in elution (to a higher mass), but the peak remained sharp and consistent with a dimer; crystal trials were repeated. After methylation, the protein yielded crystals with sharp edges with protein at 15 mg ml−1in cryo-47 (Emerald BioSystems): 50% (v/v) polyethylene glycol 400, 0.1 M acetate, pH 4.5, and 0.2 M Li2SO4. The
crystals were taken directly from the drop and cryo-cooled prior to data collection. Data were recorded to 1.5 Å at the European Synchrotron Radiation Facility and processed with MOSFLM.24 Molecular replacement using HdeA
failed to give a solution that we were able to refine with confidence. Selenomethionine-variant protein was pro-duced using the method of Doublie.25 The variant was
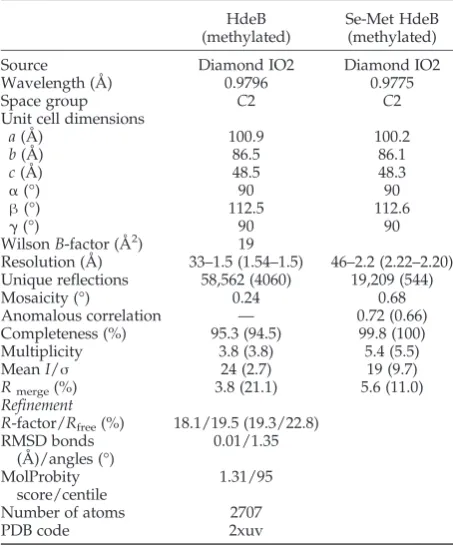
treated identically to the native and yielded crystals under the same conditions. Data were collected at the European Synchrotron Radiation Facility. Selenium sites were identified, and the structure was phased using the SHELX suite of programs.26 The model was built with ARP/wARP,27refined with REFMAC5,28and adjusted by Coot.29TLS groups were defined using the TLSD server30 and used throughout refinement. Individual atomic thermal parameters were refined isotropically. Crystallo-graphic statistics are given inTable 1. There is unambig-uous electron density for doubly methylated lysine
residues (K48, K88, and K93) and clear density for some modification of others (K35, K65, K89, and K99), with only K82 apparently unmodified in the crystal. In two mono-mers, there is electron suggestive of methylated tyrosine (Y64 in chain A); however, we could not confirm this by mass spectrometry, and the additional density could be due to different rotamers.
Gel-filtration and circular dichroism analysis
Hdeb-His6was concentrated to approximately 0.3 mg
ml−1in 10 mM sodium phosphate or 10 mM citrate buffer depending on the required pH. A series of CD spectra were recorded from pH 2 to pH 7. The near-UV region (260–310 nm) shows that the protein undergoes a profound conformational change below pH 3. This change can be reversed by increasing the pH back to 7.
Fluorescence spectroscopy
Purified samples of Hdeb-His6 were diluted in
McIl-vaine buffer to a final concentration of 50μM. McIlvaine buffer is a mixture of 0.1 M citric acid and 0.2 M Na2HPO4
[image:7.595.303.530.103.378.2]at different ratios to buffer at a pH between 2.6 and 7.31 For more acid solutions, a 10-mM KCl solution was adjusted with hydrochloric acid. Fluorescence spectra were recorded with an FLS920 spectrometer (Edinburgh Instruments) as described earlier.32 Briefly, 200 μl of sample was excited at 295 nm with an excitation path of 10 mm and an emission path of 4 mm while both slits were
Table 1.Crystallographic data
HdeB (methylated)
Se-Met HdeB (methylated)
Source Diamond IO2 Diamond IO2 Wavelength (Å) 0.9796 0.9775
Space group C2 C2
Unit cell dimensions
a(Å) 100.9 100.2
b(Å) 86.5 86.1
c(Å) 48.5 48.3
α(°) 90 90
β(°) 112.5 112.6
γ(°) 90 90
WilsonB-factor (Å2) 19
Resolution (Å) 33–1.5 (1.54–1.5) 46–2.2 (2.22–2.20) Unique reflections 58,562 (4060) 19,209 (544)
Mosaicity (°) 0.24 0.68
Anomalous correlation — 0.72 (0.66) Completeness (%) 95.3 (94.5) 99.8 (100) Multiplicity 3.8 (3.8) 5.4 (5.5)
MeanI/σ 24 (2.7) 19 (9.7)
Rmerge(%) 3.8 (21.1) 5.6 (11.0) Refinement
R-factor/Rfree(%) 18.1/19.5 (19.3/22.8) RMSD bonds
(Å)/angles (°)
0.01/1.35
MolProbity score/centile
1.31/95
Number of atoms 2707
PDB code 2xuv
set to 2 nm. The temperature was kept at 20 °C. The spectra were fitted to a skewed Gaussian:33
I=Imaxexp −ðln2Þ½ln 1 + 2ð bðE−EmaxÞ=wEÞ=b2
+að1Þ
with fluorescence intensityIat wavelengthλandImaxat
λmax, skew parameter ofb, peak width at half-height ofwλ,
and baseline offset ofa. Intensities were normalized to the emission intensity of HdeB-His6WT at pH 7.5.
Quenching experiments were performed by titrating a 1-M stock solution of acrylamide to the sample up to a concentration of 0.2 M. The intensities at 340 nm were fitted to the Stern–Volmer equation:
I0=I= 1 +KSV½ Q ð2Þ
IandI0represent the fluorescence intensities with and without quencher, respectively; KSV is the quenching constant; and [Q] is the concentration of acrylamide.
Parameters obtained from fitting the spectra (Imax,
λmax), KSV from the quenching experiments, and the fluorescence anisotropy were fitted toEq. (3) to obtain an apparent pKavalue:
P=ðPA½Hþ+PBKaÞ=ðKa+ H½ þÞ ð3Þ wherePis one of the spectroscopic parameters at a specific pH;PAandPBare the parameters for the acidic and basic form, respectively; [H+] is the proton concentration; and Ka is the equilibrium constant. As discussed above, the mutant D76N showed that changes in the intensities were independent of changes in the other parameters reflecting different processes. Therefore,PA andPB forλmax, KSV, and anisotropy directly indicated concentrations of species and required no correction for intensities. Data analysis and fitting were performed using the software Origin 8.0 (OriginLab). pH-dependent measurements were performed at least in duplicate, and mean values for the apparent pKavalues are given.
The dissociation constant Kd for HdeB E41Q was determined from the concentration-dependent change in peak positionλmaxat pH 7.5.
M + MfD ð4Þ
Kd= M½ 2=½ D ð5Þ
Kd can be expressed dependent on the degree of dissociationα= [M]/c, where cis the total concentration of HdeB given as monomers34[Eq. (6)]
Kd= 2a2c=ð1−aÞ ð6Þ Equation (6) solved forαresults in:
a= 8cKd+Kd2
1=2−K d
=4c ð7Þ
pH-dependent measurements on HdeB D76N suggest that the quantum yields for the monomer and the dimer are similar (seeResults). Therefore, α can be obtained from measurements of the peak positionλmaxaccording toEq. (8), which also contains the peak positions for the pure dimer and monomer,λDandλM:
a=ðED−EmaxÞ=ðED−EMÞ ð8Þ
Substitution ofEq. (8) in Eq. (7) results in:
Emax=ED−ðED−EMÞ 8cKd+Kd2
1=2−K d
=4c ð9Þ
λD andλM were difficult to estimate from experiments directly but fittings ofEq. (9) toλmax were sensitive to these parameters so that they were varied together with
Kd using Origin 8.0. Experiments were performed in triplicate and mean and standard deviation are given.
Static light scattering
A Wyatt miniDAWN TREOS multiangle light-scatter-ing instrument, together with a Wyatt Optilab T-rEX refractometer, was used, coupled online to an AKTA Purifier (GE Healthcare) pump system. An analytical 25-ml Superdex 200 size-exclusion column (GE Health-care) was equilibrated with 50 mM phosphate buffer, pH 7.5 (containing 150 mM NaCl), and purified HdeB-His6 WT and E41Q samples were injected. Molecular
masses were calculated using the ASTRA software (Wyatt) according to the manufacturer. Bovine serum albumin (Thermo Fisher) and rabbit aldolase (Sigma) were used as controls. Refractive index increments were calculated on the basis of the amino acid sequence using the software Sedfit,35 and extinction coefficients were calculated using the ExPASy online suite.
Accession numbers
Coordinates and structure factors have been deposited in the Protein Data Bank with accession number 2xuv.
Acknowledgements
The structural facilities were supported by the Scottish Funding Council (SFC reference SULSA) and by a grant to J.H.N. and I.R.B. from the Wellcome Trust (ref 077564/B/05/Z). A.J.H. was supported by a B.B.S.R.C. Committee Studentship to I.R.B. and N.A.B.
Supplementary Data
Supplementary data to this article can be found
online atdoi:10.1016/j.jmb.2011.11.026
References
1. Foster, J. W. & Hall, H. K. (1990). Adaptive acidifica-tion tolerance response of Salmonella typhimurium. J. Bacteriol.172, 771–778.
2. Booth, I. R. (1985). Regulation of cytoplasmic pH in bacteria.Microbiol. Rev.49, 359–378.
4. Gajiwala, K. S. & Burley, S. K. (2000). HDEA, a periplasmic protein that supports acid resistance in pathogenic enteric bacteria.J. Mol. Biol.295, 605–612. 5. Link, A. J., Phillips, D. & Church, G. M. (1997). Methods for generating precise deletions and in-sertions in the genome of wild-type Escherichia coli: application to open reading frame characterization.J. Bacteriol.179, 6228–6237.
6. Waterman, S. R. & Small, P. L. (1996). Identification of sigma S-dependent genes associated with the station-ary-phase acid-resistance phenotype of Shigella flex-neri.Mol. Microbiol.21, 925–940.
7. Masuda, N. & Church, G. M. (2003). Regulatory network of acid resistance genes in Escherichia coli.
Mol. Microbiol.48, 699–712.
8. Ruiz, C., McMurry, L. M. & Levy, S. B. (2008). Role of the multidrug resistance regulator MarA in global regulation of the hdeAB acid resistance operon in
Escherichia coli.J. Bacteriol.190, 1290–1297.
9. Schneiders, T., Barbosa, T. M., McMurry, L. M. & Levy, S. B. (2004). TheEscherichia colitranscriptional regulator MarA directly represses transcription of purA and hdeA.J. Biol. Chem.279, 9037–9042. 10. Kern, R., Malki, A., Abdallah, J., Tagourti, J. &
Richarme, G. (2007).Escherichia coli HdeB is an acid stress chaperone.J. Bacteriol.189, 603–610.
11. Yang, F., Gustafson, K. R., Boyd, M. R. & Wlodawer, A. (1998). Crystal structure ofEscherichia coliHdeA.
Nat. Struct. Biol.5, 763–764.
12. Holland, R. D., Duffy, C. R., Rafii, F., Sutherland, J. B., Heinze, T. M., Holder, C. L.et al.(1999). Identifica-tion of bacterial proteins observed in MALDI TOF mass spectra from whole cells. Anal. Chem. 71, 3226–3230.
13. Krissinel, E. & Henrick, K. (2005). Detection of protein assemblies in crystals. Comput. Life Sci. Proc. 3695, 163–174.
14. Callis, P. R. & Liu, T. (2004). Quantitative prediction of fluorescence quantum yields for tryptophan in pro-teins.J. Phys. Chem. B,108, 4248–4259.
15. Osysko, A. P. & Muino, P. L. (2011). Fluorescence quenching of tryptophan and tryptophanyl dipep-tides in solution.J. Biophys. Chem.2, 316–321. 16. Pace, C. N., Grimsley, G. R. & Scholtz, J. M. (2009).
Protein ionizable groups: pKvalues and their contri-bution to protein stability and solubility.J. Biol. Chem. 284, 13285–13289.
17. Sawa, J., Malet, H., Krojer, T., Canellas, F., Ehrmann, M. & Clausen, T. (2011). Molecular adaptation of the DegQ protease to exert protein quality control in the bacterial cell envelope.J. Biol. Chem.286, 30680–30690. 18. Chen, Y. & Barkley, M. D. (1998). Toward under-standing tryptophan fluorescence in proteins. Bio-chemistry,37, 9976–9982.
19. Sun, Y. & MacRae, T. H. (2005). Small heat shock proteins: molecular structure and chaperone function.
Cell. Mol. Life Sci.62, 2460–2476.
20. Tapley, T. L., Korner, J. L., Barge, M. T., Hupfeld, J., Schauerte, J. A., Gafni, A. et al. (2009). Structural plasticity of an acid-activated chaperone allows promiscuous substrate binding. Proc. Natl Acad. Sci. USA,106, 5557–5562.
21. Zhang, M., Lin, S., Song, X., Liu, J., Fu, Y., Ge, X.et al.
(2011). A genetically incorporated crosslinker reveals chaperone cooperation in acid resistance. Nat. Chem. Biol.7, 671–677.
22. Oke, M., Carter, L. G., Johnson, K. A., Liu, H., McMahon, S. A., Yan, X. et al. (2010). The Scottish Structural Proteomics Facility: targets, methods and outputs.J. Struct. Funct. Genomics,11, 167–180. 23. Shaw, N., Zhao, M., Cheng, C. Y., Xu, H., Saarikettu,
J., Li, Y.et al.(2007). The multifunctional human p100 protein‘hooks’methylated ligands. Nat. Struct. Biol. 14, 779–784.
24. Leslie, A. G. W. (1992). Recent changes to the MOSFLM package for processing film and image plate data.Joint CCP4 and ESF-EAMCB Newsletter on Protein Crystallography,26, 1–10.
25. Doublie, S. (1997). Preparation of selenomethionyl proteins for phase determination. Methods Enzymol. 276, 523–530.
26. Schneider, T. R. & Sheldrick, G. M. (2002). Substruc-ture solution with SHELXD.Acta Crystallogr., Sect. D: Biol. Crystallogr.58, 1772–1779.
27. Morris, R. J., Perrakis, A. & Lamzin, V. S. (2002). ARP/ wARP's model-building algorithms. I. The main chain. Acta Crystallogr., Sect. D: Biol. Crystallogr.58, 968–975.
28. Murshudov, G. N., Vagin, A. A., Lebedev, A., Wilson, K. S. & Dodson, E. J. (1999). Efficient anisotropic refinement of macromolecular structures using FFT.
Acta Crystallogr., Sect. D: Biol. Crystallogr.55, 247–255. 29. Emsley, P. & Cowtan, K. (2004). Coot: model-building tools for molecular graphics.Acta Crystallogr., Sect. D: Biol. Crystallogr.60, 2126–2132.
30. Painter, J. & Merritt, E. A. (2006). TLSMD web server for the generation of multi-group TLS models.J. Appl. Crystallogr.39, 109–111.
31. McIlvaine, T. C. (1921). A buffer solution for colori-metric comparison.J. Biol. Chem.49, 183–186. 32. Rasmussen, T., Edwards, M. D., Black, S. S., Rasmussen,
A., Miller, S. & Booth, I. R. (2010). Tryptophan in the pore of the mechanosensitive channel MscS: assessment of pore conformations by fluorescence spectroscopy.
J. Biol. Chem.285, 5377–5384.
33. Clark, E. H., East, J. M. & Lee, A. G. (2003). The role of tryptophan residues in an integral membrane protein: diacylglycerol kinase.Biochemistry,42, 11065–11073. 34. Silva, J. L. & Verjovski-Almeida, S. (1985). Monomer–
dimer association constant of solubilized sarcoplasmic reticulum ATPase.J. Biol. Chem.260, 4764–4769. 35. Zhao, H., Brown, P. H. & Schuck, P. (2011). On the
distribution of protein refractive index increments.